Remigiusz Pielech, Adrian Wysocki, Kacper Foremnik, Marek Malicki, Bartłomiej Surmacz, Jerzy Szwagrzyk, Zbigniew Maciejewski. Restoration of natural herbaceous vegetation and spatial variability of forest structure by gradual removal of Scots pine from former plantations[J]. Forest Ecosystems, 2025, 12(1): 100285. DOI: 10.1016/j.fecs.2024.100285
Citation:
Remigiusz Pielech, Adrian Wysocki, Kacper Foremnik, Marek Malicki, Bartłomiej Surmacz, Jerzy Szwagrzyk, Zbigniew Maciejewski. Restoration of natural herbaceous vegetation and spatial variability of forest structure by gradual removal of Scots pine from former plantations[J]. Forest Ecosystems, 2025, 12(1): 100285. DOI: 10.1016/j.fecs.2024.100285
Remigiusz Pielech, Adrian Wysocki, Kacper Foremnik, Marek Malicki, Bartłomiej Surmacz, Jerzy Szwagrzyk, Zbigniew Maciejewski. Restoration of natural herbaceous vegetation and spatial variability of forest structure by gradual removal of Scots pine from former plantations[J]. Forest Ecosystems, 2025, 12(1): 100285. DOI: 10.1016/j.fecs.2024.100285
Citation:
Remigiusz Pielech, Adrian Wysocki, Kacper Foremnik, Marek Malicki, Bartłomiej Surmacz, Jerzy Szwagrzyk, Zbigniew Maciejewski. Restoration of natural herbaceous vegetation and spatial variability of forest structure by gradual removal of Scots pine from former plantations[J]. Forest Ecosystems, 2025, 12(1): 100285. DOI: 10.1016/j.fecs.2024.100285
Department of Plant Ecology, Institute of Botany, Faculty of Biology, Jagiellonian University in Kraków, Poland. E-mail address: remigiusz.pielech@uj.edu.pl (R. Pielech)
We tested the effectiveness of the gradual removal of Scots pine (Pinus sylvestris L.) in former plantations of this species in Roztocze National Park (SE Poland) to support the restoration of natural herbaceous flora and forest structure. We compared 0.5-ha study plots subjected to selective removal of pine trees with control plots excluded from any kind of human intervention for half a century. The observed changes in forest floor vegetation in the converted plots showed naturalization towards habitat-specific species. However, differences in the spatial distribution of trees between the treatment and control plots showed no universal pattern and revealed subtle but positive shifts from regular to random or clustered patterns. The mean tree diameters were higher in plots subjected to Scots pine removal, which resulted from the vigorous growth of tree species, consistent with habitat types. We conclude that forest restoration through the removal of planted trees can support the naturalization of former Scots pine plantations in protected areas. However, the selection of an appropriate method and its intensity are of vital importance. Methods that resemble typical management practices, such as selection thinning, are not always the best approach, as they may preserve or even increase the regular distribution of trees. Therefore, for restoration purposes, we recommend testing other methods that increase spatial heterogeneity, including systematic cutting or emulating natural disturbances. In addition, low-intensity thinning may not be sufficient to support the restoration of natural forest floor vegetation and the variability in forest stand structure.
Over the last few centuries, coniferous plantations have replaced the natural forest ecosystems in large parts of Central Europe (Kint et al., 2006; Zerbe, 2002). The planting of Scots pine (Pinus sylvestris L.) in the lowlands of Europe followed extensive clearcutting. Fast growth and low habitat requirements, as well as a wide demand for pine wood in the timber and building industries, have been the main reasons for using this species for reforestation since the 18th century. At present, this Euro-Siberian species is the most widely distributed in the world, covering 28 million hectares (Durrant et al., 2016). Monospecific and even-aged Scots pine forests predominate the lowland landscapes of Poland, Germany, and other European countries, covering more than half of the total forested area (Aleksandrowicz-Trzcińska et al., 2017; Förster et al., 2021).
The natural occurrence of Scots pine is mainly limited to nutrient-poor sites within its natural range; however, due to the widespread plantations, it now dominates almost all site types, including the nutrient-rich sites of former broadleaved forests (Dobrowolska, 2006). The conversion of secondary forests dominated by Scots pine and pure stands of this species has become one of the main economic and ecological goals of forestry in Europe over the last few decades (Kint, 2005; Pach et al., 2018). The conversion of pure pine stands into mixed and broadleaved forests increases ecosystem stability and resistance to biotic and abiotic threats (Jactel et al., 2017). Furthermore, converting pure stands to mixed stands usually increases forest productivity, and the resulting income for forest managers (Bielak et al., 2014; Pretzsch et al., 2015). However, the conversion of pure and even-aged forest stands is often motivated by their influence on biodiversity, as spatially diverse, multilayered, and multispecies forests support higher levels of biodiversity than their simplified counterparts (Felton et al., 2010).
Management activities aimed at improving the naturalness and ecological quality of forest ecosystems may involve several strategies. Operations that provide space for a new generation of trees and promote a new cohort support the development of uneven-aged and multilayered forest stands (Kint et al., 2009; O'Hara, 2001). Regular spatial patterns in the distribution of trees that are typical of forest plantations and result from the regular spacing of planted trees can be transformed into random or clumped patterns via systematic thinning or aggregated retention harvesting (Crecente-Campo et al., 2009; Franklin et al., 2018; Nuutinen et al., 2021). In Scots pine monocultures planted on rich substrates, where temperate broadleaved forests have occurred in the past, the gradual removal of Scots pine trees and the promotion of natural regeneration of deciduous tree species accelerated the recovery of species composition typical of natural forests (Budde et al., 2011). Numerous studies have confirmed the positive effects of stand conversion practices in coniferous monocultures on various components and indicators of biodiversity, including herbaceous vegetation of the forest floor (Atkinson et al., 2015; Lust et al., 1998; Zerbe, 2002), tree diversity (Kint et al., 2009; Zerbe and Kreyer, 2007), lichens and beetles (Laarmann et al., 2013), mosses (Maciejewski and Zubel, 2009), forest stand structure (Crecente-Campo et al., 2009; Lust et al., 1998), and the number of large habitat trees (Vrska et al., 2017).
Forest stand conversion is typically undertaken in managed forests where timber production is the most important function. However, the experience of stand conversion gained in production forests may also be useful in protected areas where biodiversity conservation is a priority. In this study, we present the results of research conducted in Roztocze National Park (SE Poland) based on paired plots (also referred to as twin plots). In addition to natural forests of outstanding biological value, approximately one-third of the total forest area in the park is covered by former Scots pine plantations, which constitute a legacy of former forest management, and were included within the borders of the national park during its establishment and enlargements. These former pine plantations undergo natural succession processes and reveal trajectories towards natural ecosystems (Maciejewski, 2011; Maciejewski and Zubel, 2009). However, this process is very slow, and the national park services strive to accelerate the naturalization of former plantations by gradually removing pine trees. This study aimed to test whether these methods were effective in regenerating natural herbaceous vegetation and shifting the spatial distribution of trees and stand structures to more natural patterns. Specifically, we asked the following questions.
1) Does the removal of Scots pine trees support the recovery of natural herbaceous vegetation?
2) Does gradual removal of planted trees result in more natural spatial patterns of trees?
3) Does forest conversion support the recovery of natural features in forest structure?
We expected that Scots pine thinning resulted in an increased abundance of habitat-specific species in the forest floor, lower regularity of spatial tree distribution, and higher variability of structural indices.
2.
Methods
2.1
Study area
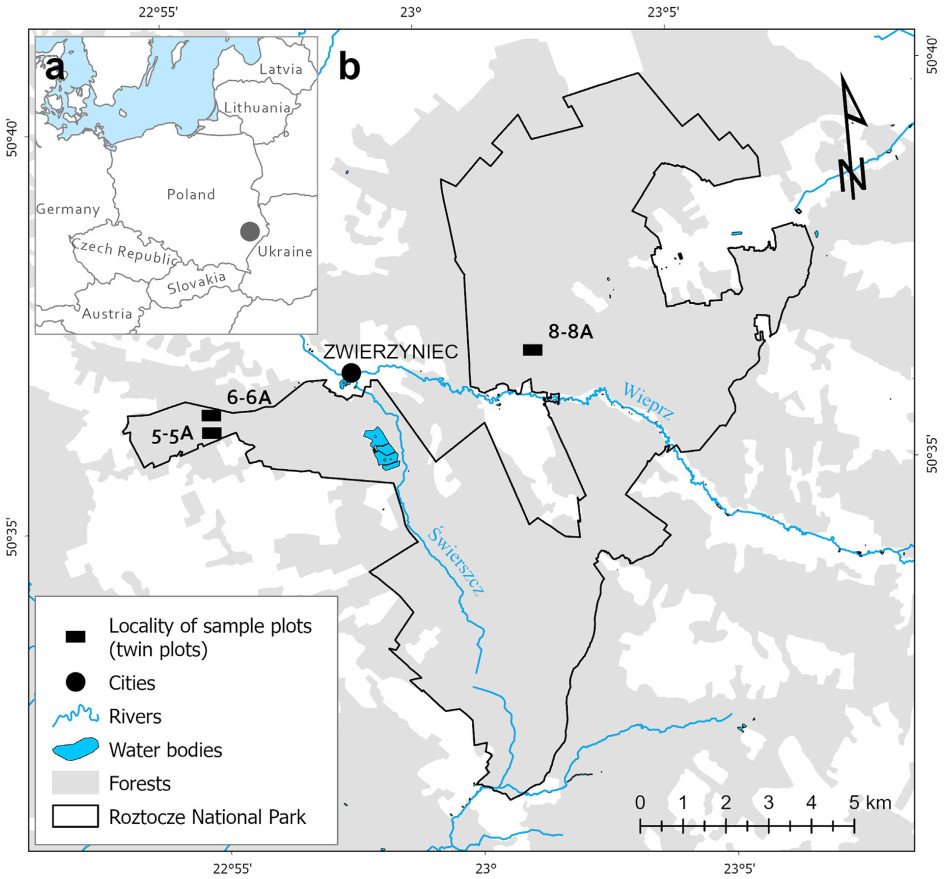
The study was carried out in the Roztocze National Park (RPN), located in SE Poland (Fig. 1). It was established in 1974 to protect natural forest resources that were previously protected in several nature reserves scattered across the Central Roztocze Highlands. The area of the national park is 84.82 km2. The climate of Central Roztocze is classified as warm-summer humid continental, according to the Köppen-Geiger classification (Peel et al., 2007). The average duration of the growing season (days with a daily temperature above 5 ℃) is approximately 210 days a year. The mean annual temperature is 7.2 ℃–7.4 ℃ and the mean annual precipitation ranges between 650 and 750 mm (Kaszewski, 2008). The topography of the Roztocze region is characterized by a range of hills that run in the NW-SE direction. The hills are composed of silicate-carbonate marine deposits from the Upper Cretaceous period, mainly opokas and gaises. The terrain is complicated by numerous valleys filled with post-glacial deposits, including fluvial and aeolian sands. The differences between the tops of the hills and valley bottoms reach 100 m (Maruszczak, 1998). Of the 14 soil types identified within the national park, rendzinas, podzols, and rusty soils predominate (Koba and Miśta, 2015).
Figure
1.
Top-left panel (a): Localization of Roztocze National Park (grey circle) in Central-European context. Main panel (b): Localities of study plot pairs in Roztocze National Park (black rectangles).
The forests are comprised of 32 native tree species (80% of all native tree species that grow in Poland). Some of these species are characteristic of the mountains, e.g., European beech (Fagus sylvatica L.), silver fir (Abies alba Mill.) and Norway spruce (Picea abies (L.) H.Karst), whereas the others are typical of lowlands, such as Scots pine (Pinus sylvestris L.), European hornbeam (Carpinus betulus L.), small-leaved and large-leaved lindens (Tilia cordata Mill., and T. platyphyllos Scop.), together creating a mosaic of coexisting forest stands (Izdebski et al., 1992; Szwagrzyk et al., 2012). Submountain rich beech forests and oak-hornbeam forests are the most common types of broadleaved woodlands, whereas secondary Scots pine forests and natural silver fir forests are the most common representatives of coniferous woodlands.
2.2
Study objects
We sampled pairs of 0.5 ha (50 m × 100 m) study plots in three locations in Roztocze National Park (Fig. 1). Each pair consisted of a plot subjected to stand conversion activities over the last few decades, and a control plot excluded from management for nearly half a century. Control plots (nos. 5, 6, and 8) were established between 1971 and 1973 as part of a project on the productivity of native forest communities in the Roztocze Highlands (Izdebski et al., 1976, 1977). Since then, these plots have been excluded from any kind of human intervention and resampled several times to track spontaneous changes in vegetation and forest dynamics (Maciejewski, 2011; Pielech et al., 2022). The plots subjected to stand conversion (nos. 5A, 6A, and 8A, hereinafter referred to as converted plots) were established in 2007 as part of a project on the dynamics of native tree species in Roztocze National Park. These plots were placed next to the control plots under the same habitat conditions to form pairs for future comparison. They have been subject to low-intensity management for several decades, and these practices mainly included the removal of Scots pine aimed at the conversion to natural forests.
2.3
Management history
In 2021, we summarized all available information regarding recent and historical management activities, including management plans (since 1934), forestry maps (since 1946), documents related to the implementation of management plans (before the establishment of the RPN), and protection plans. Based on these documents, as well as the knowledge of the national park staff, we have detailed knowledge of the management history in our study plots. Owing to previous measurements of permanent plots, we have precise data on the intensity of stand conversion activities. Table 1 summarizes the information on our study objects.
Table
1.
Characteristics of permanent plots used in this study. Intensity of Scots pine removal refers to total number (N) and total basal area (BA, m2) of Scots pine trees removed since 2007.
The management treatments used for restoration purposes in plots 5A, 6A, and 8A stemmed from common forestry management practices. In the first step, the individuals of the target tree species were selected. The target species were defined as those that were typical components of restored communities. In the second step, Scots pine trees that negatively affected the growth and regeneration of the target species were gradually removed. These two steps resemble the selection thinning approach commonly used in Central European forestry. However, as opposed to selection thinning, which aims to increase the production capacity and timber quality, the treatment applied in RPN is aimed at restoring the natural species composition and structure of forest communities. Our treatment plots differed in terms of the intensity of cutting the Scots pine trees (Table 1).
2.4
Vegetation sampling and measurements
Field work was conducted in the summer of 2021 and organized into two campaigns dedicated to (1) sampling herbaceous vegetation of the forest floor and (2) measuring the structure of the forest stand. In addition, for broadleaved forest plots (5-5A), we conducted additional sampling in the spring of 2021 to ensure that we recorded all spring geophytes typical of this forest ecosystem.
2.4.1
Herbaceous vegetation
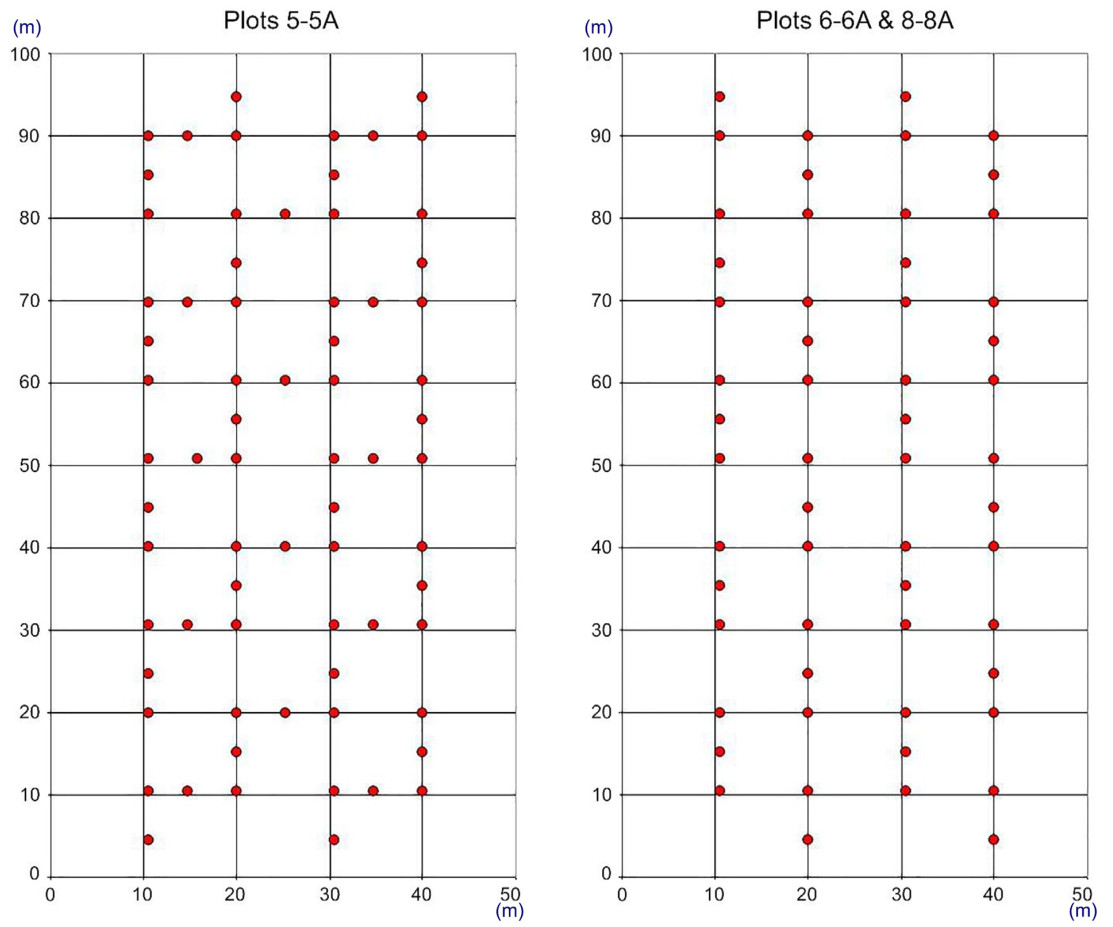
To analyze changes in the species composition and the abundance of plant species of the forest floor, we conducted floristic surveys recording all vascular plants within 0.5 m2 circular plots (364 circular sample plots in total; hereinafter, to distinguish between large rectangular 0.5 ha study plots and small circular 0.5 m2 plots, we refer to the latter as to ‘circular plots’) and estimated percentage cover of each identified species. Plant cover was estimated visually with 1% accuracy for low cover values and to the nearest 5% for cover values greater than 20%. For study plots designated as pairs 5-5A, we sampled 70 circular plots each, whereas for pairs 6-6A and 8-8A, we sampled 56 circular plots each. Differences in the number of circular plots sampled stem from the original study design proposed in the early 1970s, when permanent plots were established (Izdebski et al., 1976, 1977). The authors of this methodology proposed 70 circular plots in deciduous forest sites and 56 circular plots in coniferous and mixed forest sites because of the spatial variability of vegetation on the forest floors in these habitats. To maintain consistency in long-term sampling and allow for the analysis of vegetation trajectories, we followed the initial sampling scheme (Fig. 2).
Figure
2.
Distribution of 0.5 m2 circular plots (red dots) established to sample herbaceous vegetation within 0.5 ha study plot pairs (5-5A, 6-6A, and 8-8A).
Forest structure measurements were conducted using the Field-Map technology (Institute of Forest Ecosystem Research – IFER, Jílové u Prahy, Czech Republic, https://www.ifer.cz/) to map the spatial distribution of trees and measure the structural attributes of a forest stand. We recorded the position, species identity, diameter at breast height (DBH), and viability of each tree with a DBH equal to or greater than 7 cm. DBH was calculated as the mean of two perpendicular measurements of the tree trunk. In addition, we used dendrometric tape to measure the perimeter of the tree trunks. Perimeter measurements were used to control for possible errors because we searched our dataset for major discrepancies between the perimeter calculated from the DBH and that measured with a tape.
2.5
Data analyses
2.5.1
Herbaceous vegetation
For each circular sample plot, we analyzed the richness and vascular plant diversity of forest floor species by computing several indices, including species richness (number of species), Shannon and Simpson diversity indices, and the Shannon evenness index, i.e. Shannon diversity index divided by the logarithm of the species number. Subsequently, we compared the average values of these indices between the managed and control plots, assessing the statistical significance of the observed differences using the Wilcoxon test (since the data did not follow a normal distribution). To explore differences in the species composition of herbaceous vegetation between the managed and control plots, we performed Non-metric Multidimensional Scaling (NMDS) ordination. In addition, we tested these differences for statistical significance with permutational analysis of variance (PERMANOVA) using the vegan::adonis2 function with 999 permutations (Oksanen et al., 2019).
For detailed comparisons of herbaceous plant species in the community, we only considered plant species that reached a minimum frequency of 10% across all circular sample plots within particular plot pairs. In this way, we prioritized species with a substantial presence within the ecosystem studied, ensuring that our analyses would encompass the most ecologically relevant species in the forest floor and disregard rare species. We compared plant species coverage between plots subjected to the treatment and that of the control group. Given the non-normal distribution of the data, we used the Wilcoxon test.
2.5.2
Spatial patterns and structural indices
Ripley's L function was used to examine the spatial arrangement of the measured trees. We were interested in whether the regular distributions of trees typical of forest plantations changed to random or clumped patterns as a result of stand conversion activities. Ripley's L function is a well-established method that allows for the analysis of spatial patterns in tree distribution; however, it also considers a range of spatial scales (Ripley, 1976, 1977). Often, trees show a regular pattern under small spatial scales (e.g., a few meters), whereas under larger spatial scales, they are distributed in a random or clustered manner (Dixon, 2002). For each plot, we calculated the transformed L-function for Ripley's K function using the spatstat::Lest function (Baddeley et al., 2015). The Besag's transformation of the original K function to its L derivative linearize the expected values and stabilize the variance (Ward and Ferrandino, 1999). Ripley's function counts the number of trees within a circular plot of radius centered on each tree in the plot. The calculations were repeated with increasing radius. In addition, we ran Monte Carlo simulations with 999 iterations to calculate the 95% simulation envelope and assess the significance of the dispersion or clustering of trees in the plots.
To examine the effect of Scots pine removal on the structural characteristics of the forest, we calculated a set of structural indices, including the basal area (BA), density of living trees, mean and maximum DBH, and quadratic mean diameter (QMD). We used these metrics to conduct a pairwise comparison between treatments, specifically comparing plots that underwent conversion with those of the control group.
3.1
Diversity, composition and abundance of herbaceous species
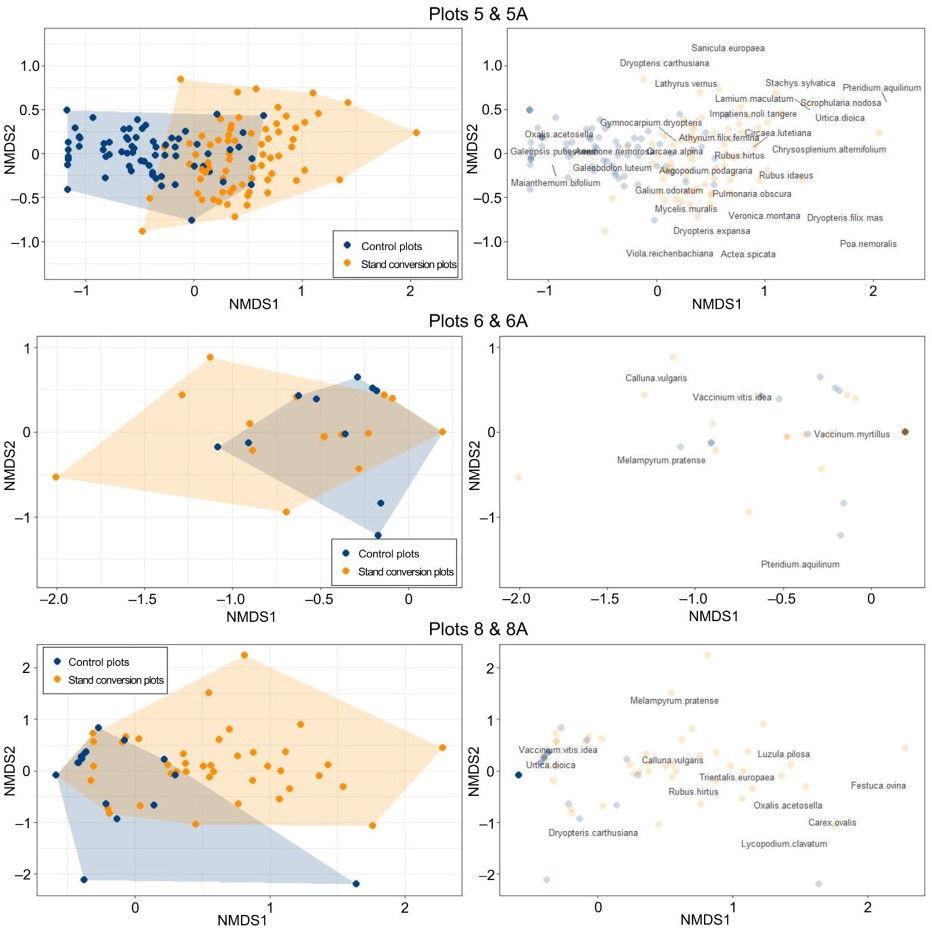
Species composition varied among the plot pairs studied, primarily because each pair represented a different forest type (Table 1). In total, we recorded 60 herbaceous species in the six study plots. The species composition of forest floor vegetation differed between converted and control plots, and these differences were the strongest for pair 5-5A. In the NMDS ordination space, the convex hulls for both groups overlapped only partially, suggesting substantial segregation. These differences were less profound in plots 6-6A and 8-8A (Fig. 3). However, PERMANOVA confirmed that only the plot pairs 5-5A and 6-6A differed significantly. In contrast, the differences in species composition in plot pair 8-8A were statistically insignificant (Table 2). Detailed comparisons were performed for 20 frequent species with a minimum frequency of 10% in all circular sample plots for particular plot pairs. We observed significant differences in species abundances in two out of the three pairs of examined plots, i.e. 5-5A and 8-8A.
Figure
3.
Non-metric multidimensional scaling (NMDS) for three pairs of plots compared. Left-hand plots present distribution of converted and control plots in ordinal spaces along first and second NMDS axes. Background polygons (convex hulls) represent portions of ordinal space occupied by each group. Right-hand panels show distribution of plant species in ordinal spaces with position of plots in the background.
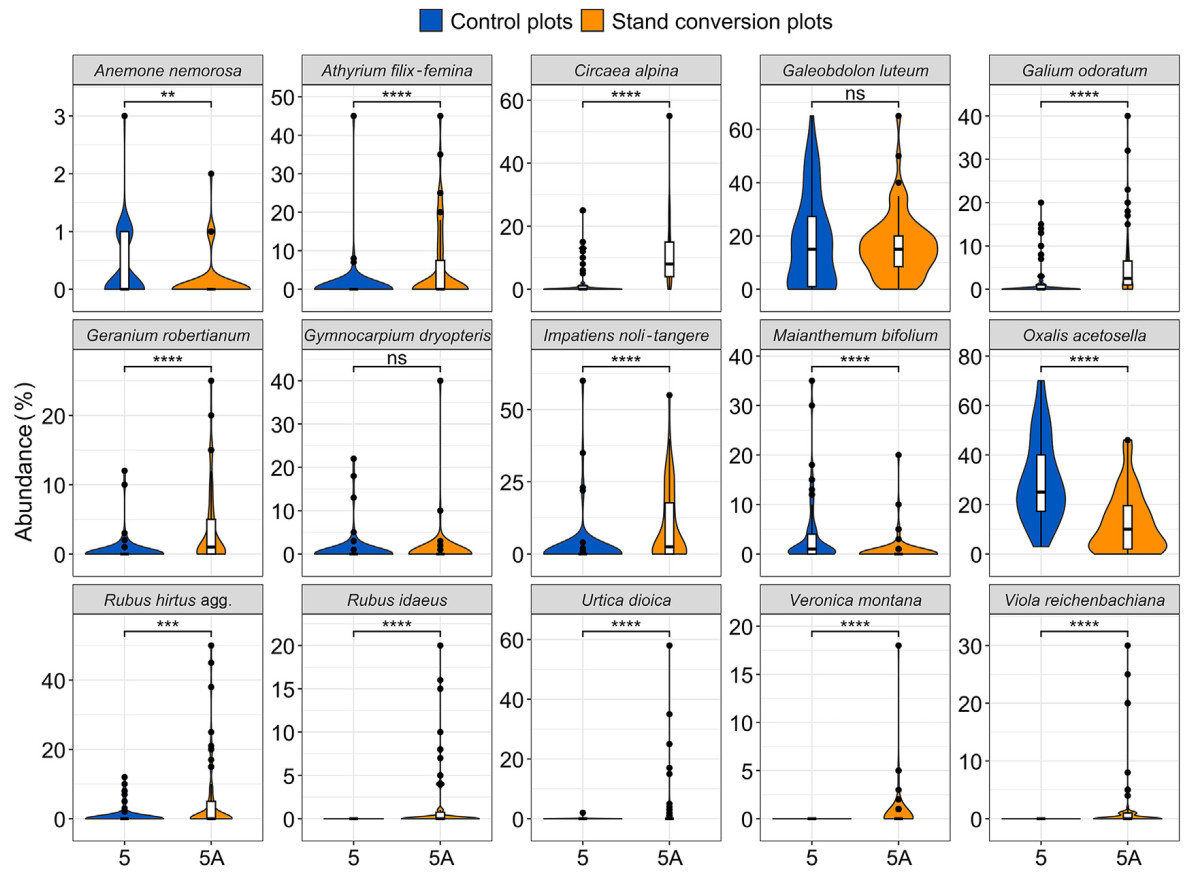
In the case of pair 5-5A, the treatment plot had a higher abundance of species naturally associated with mesic broadleaved forests, i.e., typical to this specific forest habitat (Table 1; Fig. 4). These species included Athyrium filix-femina (L.) Roth, Circaea alpina L., Galium odoratum Scop., Impatiens noli-tangere L., Veronica montana L., and Viola reichenbachiana Jord. ex Boreau. Light-demanding species, such as Geranium robertianum L., Rubus hirtus Waldst & Kit. agg., R. idaeus L., and Urtica dioica L, also increased in presence in plots subjected to cutting. Species that prefer acidic or moderately acidic conditions, such as Oxalis acetosella L. and Maianthemum bifolium (L.) F. W. Schmidt exhibited lower abundance in the treatment plot than in the control plot.
Figure
4.
Comparison of herbaceous vegetation between plots 5 and 5A. Vertical line represents median, while points indicate outliers. Statistical significance: ns, p > 0.05 (not significant); **, p ≤ 0.01; ***p ≤ 0.001; ****p ≤ 0.0001.
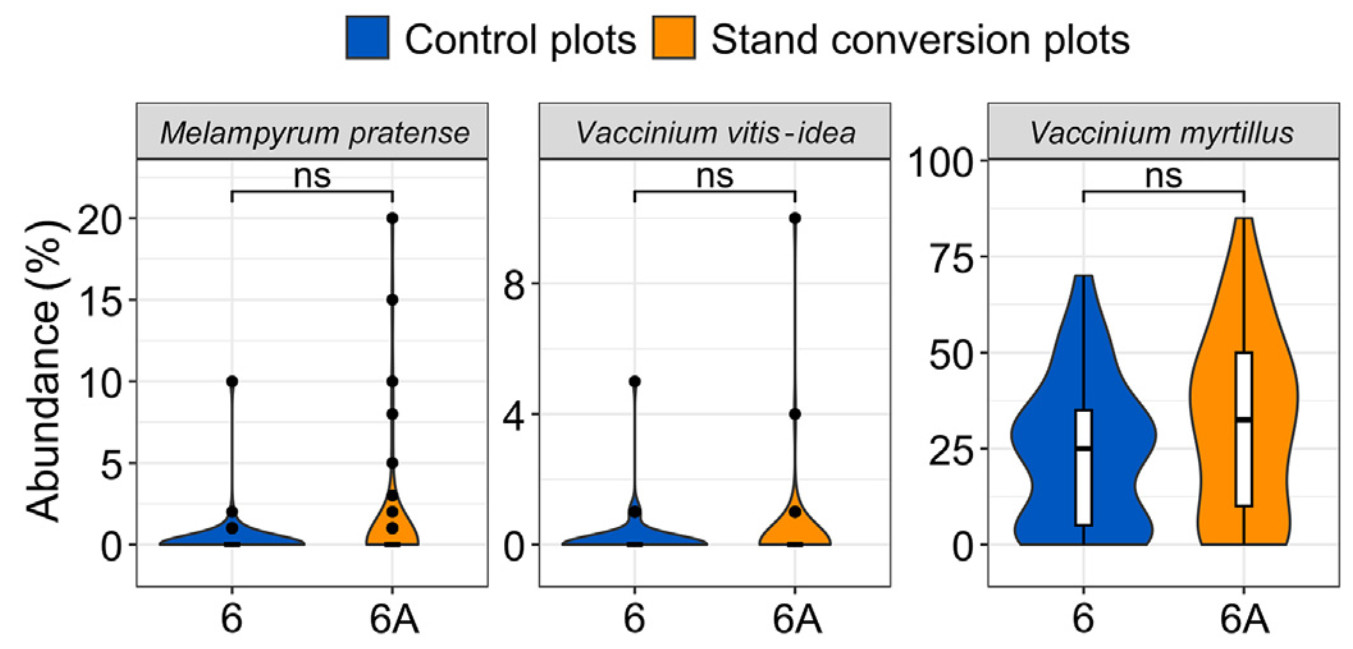
For the pair of plots 6-6A, many circular plots had no or a very small number of species; therefore, only three species reached the 10% threshold (see subsection 2.5.1. Herbaceous vegetation), and were included in further analyses. No significant differences in the abundance were observed (Fig. 5).
Figure
5.
Comparison of herbaceous vegetation between plots 6 and 6A. Vertical line represents median, while the points indicate outliers. Abbreviation ‘ns’ denotes results lacking statistical significance.
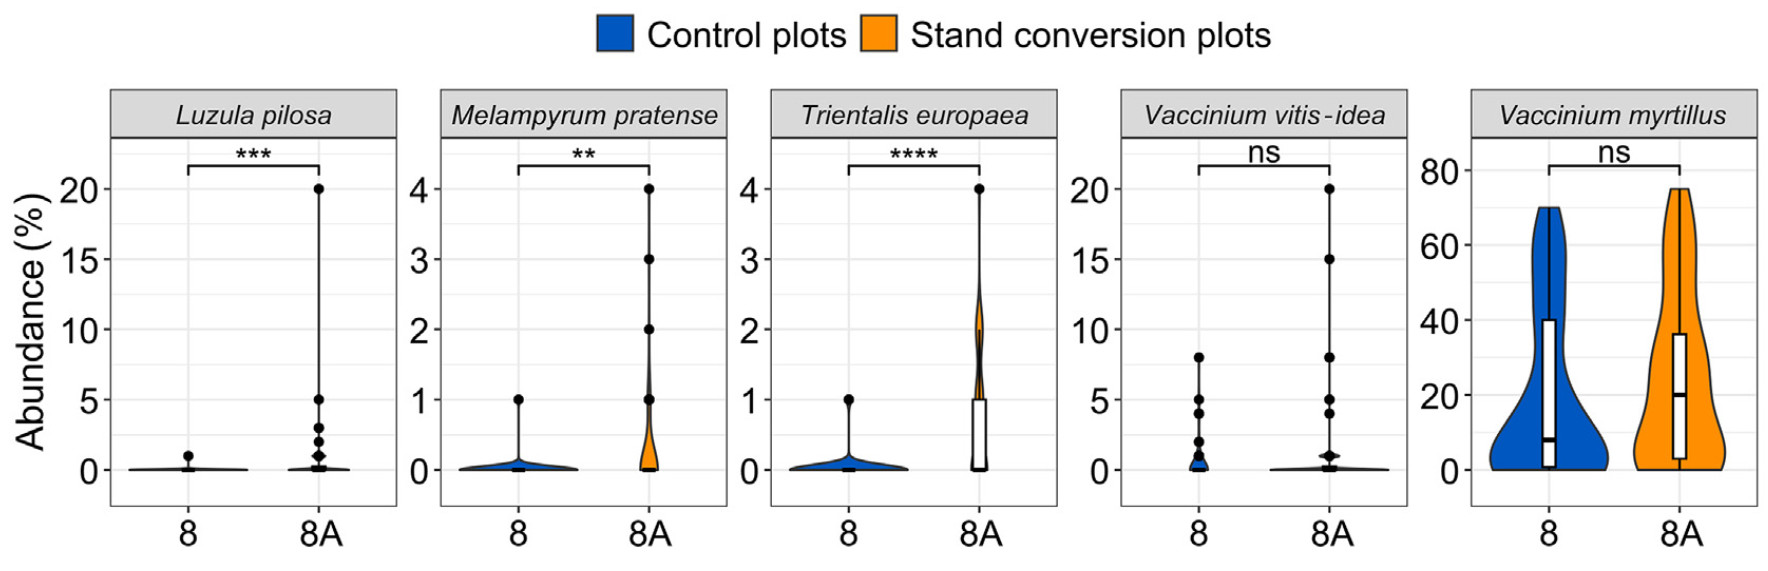
On the contrary, for pair 8-8A, treatment plots had a significantly higher abundances of acidophilic species characteristic of this specific habitat type (Table 1; Fig. 6), and these species included Luzula pilosa (L.) Willd., Melampyrum pratense L., and Trientalis europaea L.
Figure
6.
Comparison of herbaceous vegetation between plots 8 and 8A. Vertical line represents median, while the points indicate outliers. Statistical significance: ns, p > 0.05 (not significant); **, p ≤ 0.01; ***p ≤ 0.001; ****p ≤ 0.0001.
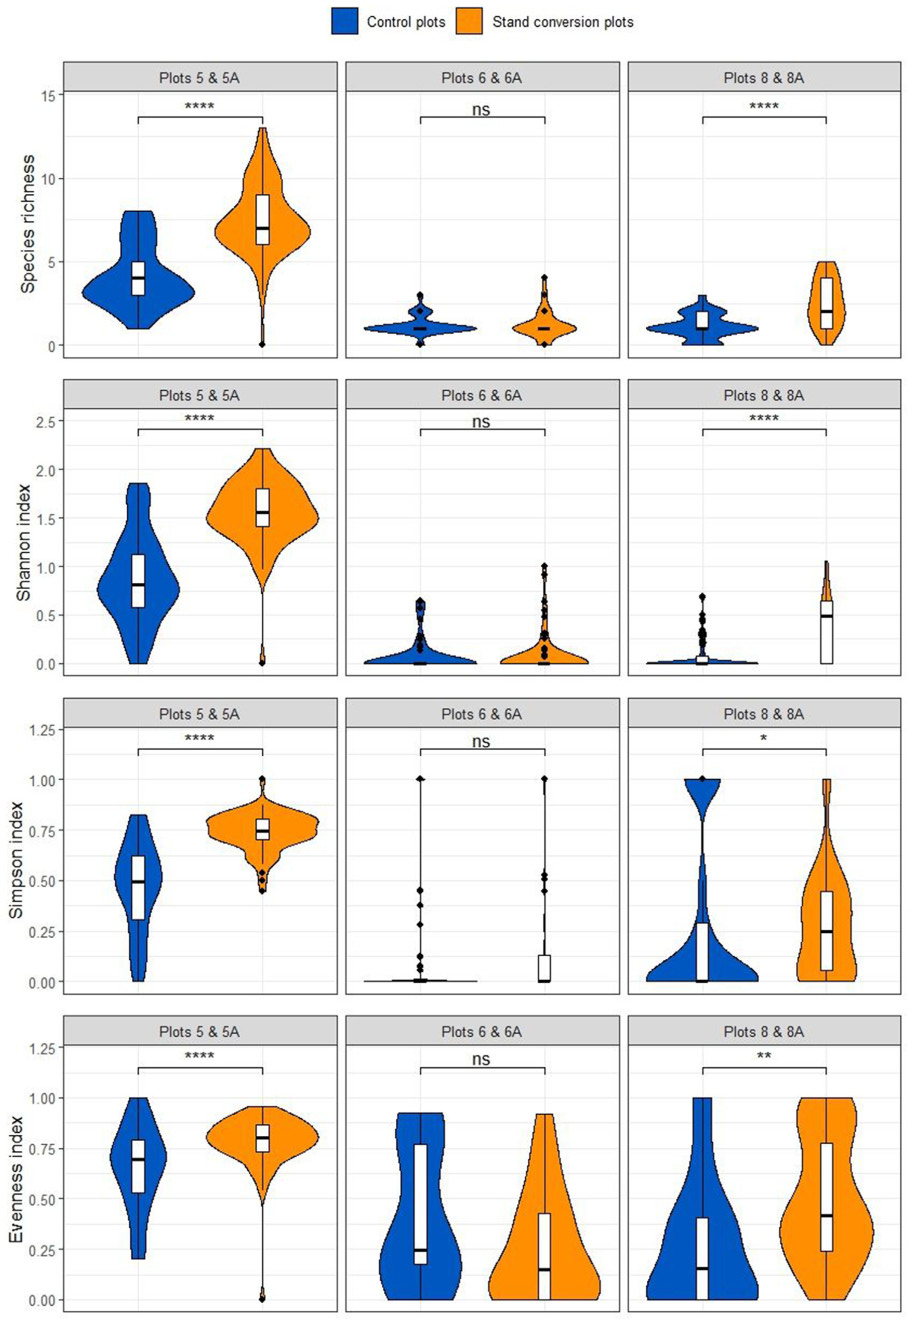
When compared to the control, plots subjected to the removal of pine trees had increased species richness and diversity of the forest floor vegetation in the studied communities in two out of the three study plots (Fig. 7). Notably, the species richness was significantly higher in the converted plots 5A and 8A than in their corresponding control plots. Moreover, the values of the Shannon and Simpson diversity indices, along with the evenness index, were also significantly higher. In contrast, such positive changes were not observed in plot 6A, which was characterized by the lowest cutting intensity.
Figure
7.
Comparison of species richness and diversity indices between plots subjected to stand conversion and control plots. Statistical significance: ns, p > 0.05 (not significant); * p ≤ 0.05; ** p ≤ 0.01; *** p ≤ 0.001; **** p ≤ 0.0001.
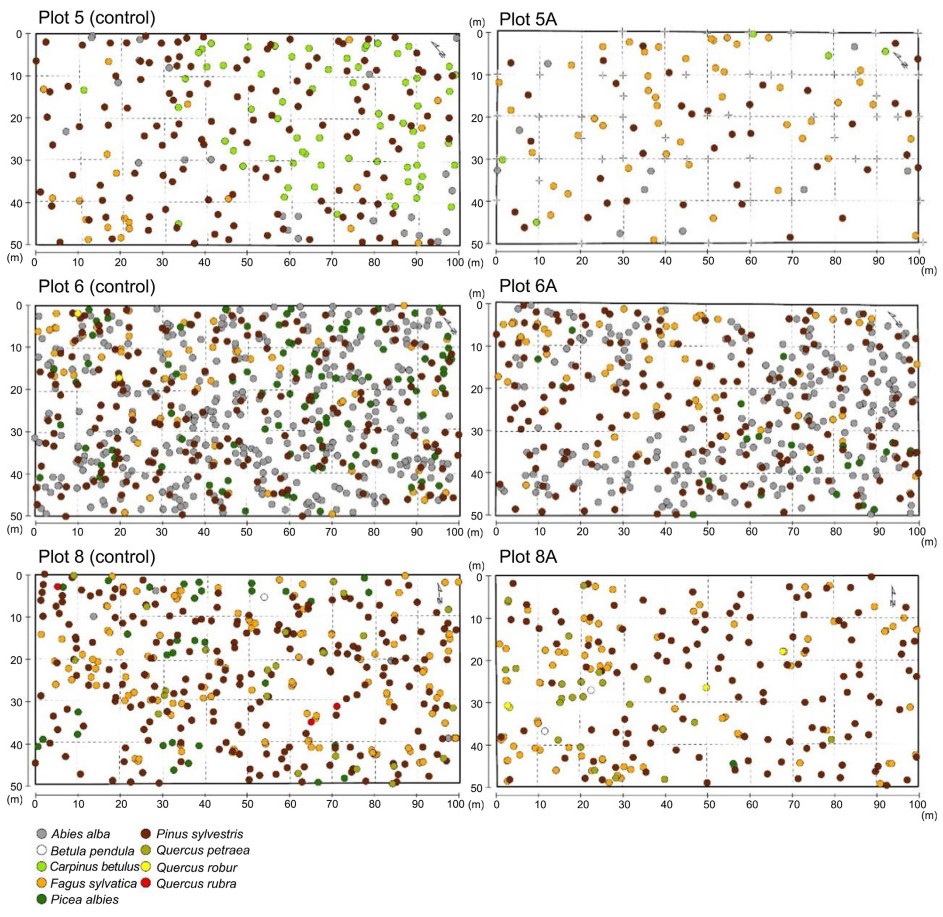
In total, 1,977 trees of nine species (excluding individuals with DBH<7 cm) were recorded in the six study plots. Besides Scots pine, the dominance of which was an effect of the former plantation, other dominant tree species were European beech and European hornbeam in plots 5-5A; silver fir, Norway spruce and European beech in plots 6-6A; and European beech and sessile oak (Quercus petraea (Matt.) Liebl.) in plots 8-8A (Fig. 8).
Figure
8.
Pairs of study plots presenting tree distributions.
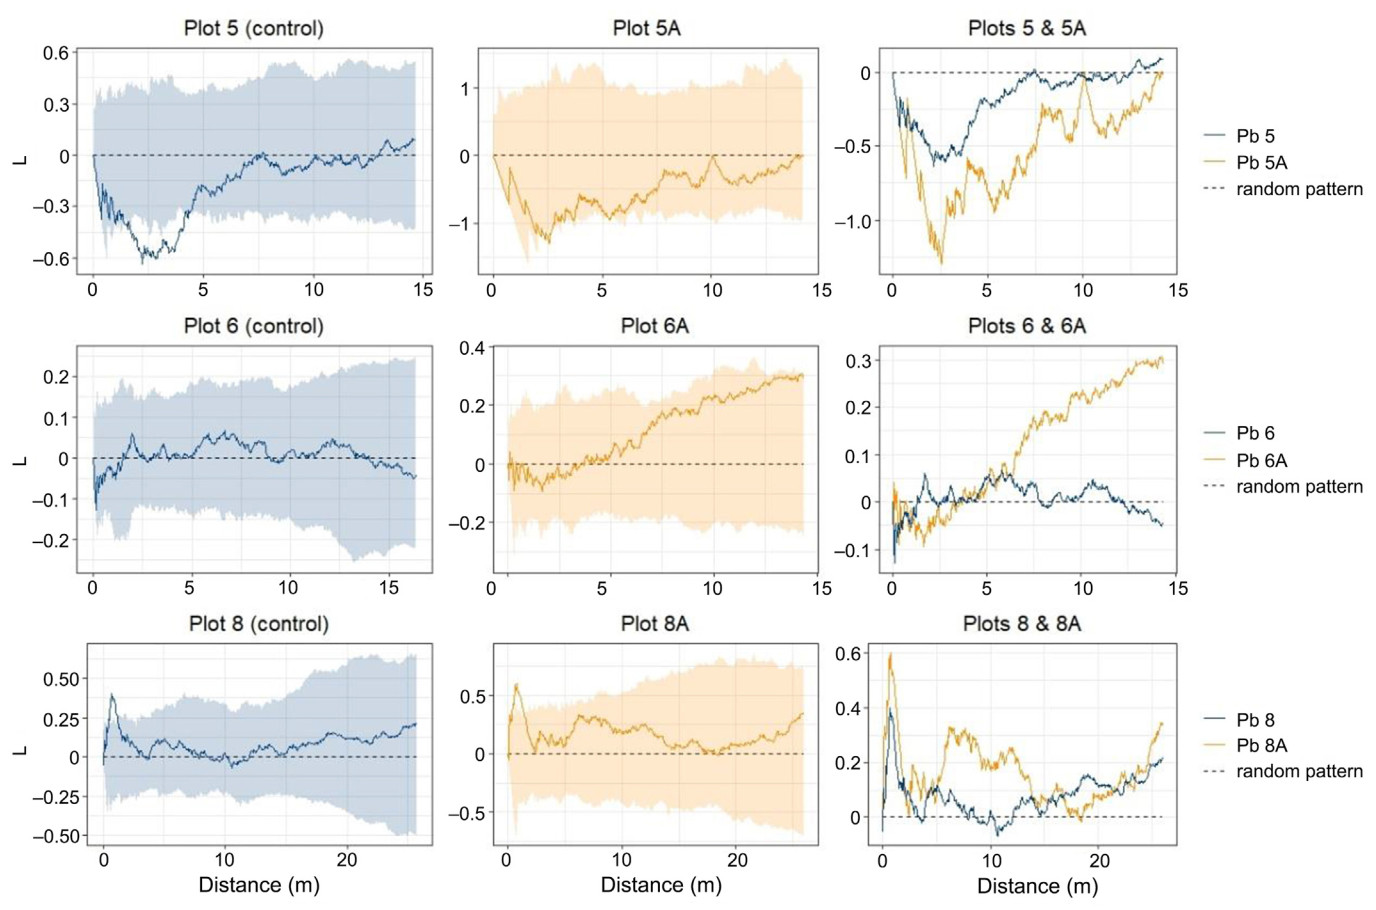
Ripley's L function revealed differences between the control plots and the plots subjected to stand conversion; however, there was no common pattern, and each pair showed different changes (Fig. 9). A comparison of plots 6 and 6A revealed that conversion resulted in a remarkable increase in the L-function values, showing a tendency from a random to clustered tree distribution pattern. However, the deviation from randomness is not statistically significant. When comparing plots 8 and 8A, the shape of the L function was similar for both plots, except for the distances between 5 and 15 m. Our analyses showed an increase in the L function values; however, in this case, the deviation from randomness was not significant. Comparison of plots 5-5A showed a significant regular pattern at small scales (up to 5 m), but a random pattern in converted stands.
Figure
9.
Comparison of Ripley's L function between plots subjected to Scots pine removal and the control plots. The first and second columns show the shapes of the L functions and simulation envelopes, allowing for assessments of the significance of deviation from randomness. The third column presents the overlapped L functions for both converted and control plots.
We detected differences in the structural characteristics between the converted and control plots. The total basal area and the density of live trees were lower in the converted plots because of the selective removal of the pine trees (Table 3). In contrast, the mean DBH and QMD were higher in the converted stands, and the maximum diameters were higher in the converted plots in two of the analyzed pairs of plots. The vigorous growth of European beech was the main factor responsible for the increase in the mean diameter in plot 5A when compared to the control plot 5. In plot 8A, the high contribution of oaks, both sessile and pedunculate (Quercus robur L.), was a driving factor for the higher mean DBH when compared to the control plot. The differences in mean diameters between plots 6 and 6A for the analyzed tree species were subtle, apparently because of the low intensity of cutting.
Table
3.
Comparison of structural characteristics between plots subjected to Scots pine removal (5A, 6A, 8A) and the control plots (5, 6, 8).
4.1
Effect of Scots pine removal on herbaceous vegetation
The results of our study shed light on the intricate relationship between forest conversion through the removal of planted Scots pine trees and the naturalization of herbaceous vegetation, highlighting the significant influence of initial forest type on these dynamics. Our findings underscore the positive impact of silvicultural practices on beech forests, which are renowned for their diverse ecosystem services (Augustynczik and Yousefpour, 2021). Beech forests play a pivotal role in Europe's forest habitats, and the preservation and rejuvenation of their tree communities should be a central focus of forest management approaches aimed at balancing biodiversity conservation and timber production.
Conversion practices had a beneficial effect on herbaceous vegetation in the studied forest communities. This was especially evident when comparing the species composition of the undergrowth in the beech forests, where both richness and diversity were significantly higher in the converted plots than in the control plots. It is important to note that our analyses are quantitative in nature, comparing the overall richness and diversity indices. Numerous studies have shown that thinning may result in a higher plant species richness (Götmark et al., 2005; Widenfalk and Weslien, 2009; Yang et al., 2023). However, an increase in the number of species and their diversity may not always be desirable when considering the naturalization of economically managed forest ecosystems, and such an increase may be due to the greater presence of ruderal or invasive species in response to canopy openings during conversion (Heinrichs and Schmidt, 2009). Therefore, to obtain a deeper understanding of the characteristics of the detected changes, we also analyzed differences in species and interpreted these changes in the context of consistency with habitat types. From this perspective, our analyses indicate that the quantitative changes in the studied areas are closely linked to the regeneration of typical woodland-specialist species, characteristic of habitats naturally occurring before their transformation into Scots pine plantations. In a habitat typical of beech forests, plot subjected to the gradual removal of planted pine trees (plot 5A) was characterized by the increased abundances of herbaceous plants typical of mesic broadleaved forests. Analogously, in the habitat of acidophilous broadleaved forests, increased abundances of species typical of this specific habitat was found in the converted plot (8A). A notable increase in the abundance of native species closely related to specific habitats within plots subjected to conversion demonstrates the potential for successful conversion (Zerbe, 2002). The observed changes in herbaceous vegetation offer promising implications for ecosystem services, with potential benefits, such as enhanced soil stability (Löbmann et al., 2020) and improved nutrient cycling (Hobbie, 1992). These transformations facilitate the rapid decomposition of aging plant material within the herbaceous layer. Increased organic matter and root turnover from higher natural herbaceous vegetation cover introduce various organic inputs, including leaf litter and root exudates, which stimulate microbial diversity and activity, which are key factors in decomposition rates (Keiser et al., 2013; Elliott et al., 2015). These processes, combined with rapid turnover of herbaceous vegetation, supply essential nutrients that support both naturalization and regeneration of target tree species (Rawlik et al., 2021). Furthermore, the resulting nutrient inputs positively influence tree foliage production, causing increased leaf mass among overstory species (Albaugh et al., 2012; Norris et al., 2013; Elliott et al., 2015). Understanding these broader ecosystem functions not only justifies the adoption of forest conversion practices, but also presents opportunities for their refinement, tailored to various ecological objectives.
4.2
Effect of Scots pine removal on spatial distribution of trees
This study showed that forest stand conversion activities that rely on the selective removal of planted trees and support the regeneration of target species can affect the spatial distribution of trees, accelerate the naturalization process of former plantations, and restore natural forest ecosystems. Positive changes were observed in all three paired plots. The results of Ripley's L function analyses revealed changes in the spatial patterns in an expected direction, that is, from regular to random and from random to clustered. However, these changes were more subtle and weaker than expected. We consider this to be mainly due to the methods and intensity of stand conversion operations applied, but also due to the relatively short period of restoration management.
In our study in Roztocze National Park, Scots pine removal was used to convert the structure of the stand and accelerate the naturalization of former plantations, which was very similar to selection thinning, a method widely used in typically managed forests. In this type of management activity, trees are removed more or less regularly to provide the remaining planted trees with an equal amount of living space and resources. Selection thinning may, therefore, preserve regularity in tree distribution and fail as a method aimed at increasing spatial heterogeneity in forests. Nuutinen et al. (2021) used the Clark-Evans aggregation index to show that this kind of thinning cannot alter the regularity of the tree distribution in forest plantations. Similarly, other authors also confirmed that typical management practices can maintain, or even increase, regularity in the spatial distribution of trees (Boncina et al., 2007; Kint et al., 2003; Li et al., 2021; Puettmann et al., 2014). Previous studies have shown that post-thinning spatial arrangement of trees may depend on which component of the forest ecosystem was removed. Removal of dominant and co-dominant species led to more clustered spatial patterns, whereas removal of intermediate and suppressed individuals resulted in more regular arrangements (Kuehne et al., 2018). In addition, spatial patterns may also depend on the thinning intensity. Moderate thinning intensities may be insufficient to change spatial patterns over time because of the low mortality rates and low levels of ingrowth. In contrast, heavy thinning resulted in clustered or random patterns (Acquah et al., 2023). Therefore, if the restoration of natural spatial patterns is a priority, decisions on thinning intensities and removed components of forest stands should be taken in advance.
4.3
Structural differences between plots subjected to stand conversion and those left for natural succession
Forest stand conversion based on pine tree removal resulted in several positive changes in the structural characteristics of the study plots. With lower tree density, the mean DBH and QMD were higher in the converted plots than in the control plots. Tree species that comprise natural forest communities in the studied sites were responsible for this change, including European beech in plot 5A and pedunculate and sessile oaks in plot 8A. This suggests that the applied selective cutting of Scots pine trees supported forest stand naturalization by improving conditions for tree species consistent with habitat types. However, in plot 6A, the mean tree diameters (both DBH and QMD) were only slightly higher than those in the control plot. This could be explained by a very low intensity of Scots pine removal in this plot when compared to the 5A and 8A plots (BA of the removed pine trees was 1.52 m2 vs. 6.63 m2 and 4.07 m2, respectively; see Table 1). Such a low intensity of cutting did not improve the conditions for growth and competition for other tree species. Furthermore, when comparing BA, plots 6 and 6A did not differ in terms of the BA of living pine trees (35.6 m2 vs. 35.2 m2), even though 23 pine trees were removed in 6A (see Table 1). In plot 6A, the intensity of cutting was similar to that of natural mortality in control plot 6. The low intensity of cutting was probably compensated for by the increased growth rate in the converted plot, and therefore, the Scots pine contribution expressed by BA remained similar. Previous studies have shown that lite thinning (<20% of the trees removed) promoted forest regeneration, heavy thinning (>35% of the trees) facilitated forest growth, and only thinning of moderate intensity (20%–35% of the trees) created a stable and heterogeneous spatial structure (Wang et al., 2024).
4.4
Implications for forest stand conversions for nature conservation purposes
Forest management activities in protected areas are sometimes controversial because non-intervention or “hands-off” approaches are often favored by the public (Landres, 2010). Such conservation strategies are the most reasonable options for primeval and close-to-primeval forests, where natural processes have uninterrupted biodiversity for centuries (Jaroszewicz et al., 2019). However, in seminatural ecosystems developing under intense human pressure and a lack of natural disturbance regimes, management activities may have beneficial effects on biodiversity resources in protected areas (Sebek et al., 2015).
In this study, we found several positive effects of forest stand conversion on the naturalization of former pine plantations. The changes that occurred on the forest floor were highly favorable, resulting in increased species richness and diversity, as well as the successful establishment of species naturally found in broadleaved forests. However, the differences in the spatial patterns of tree distribution and, to some extent, in structural indices, between converted and control plots were lower than expected. We explain these subtle differences by the fact that operations aimed at stand conversion were mainly based on conventional methods used in typically managed forests. As mentioned above, the removal of planted trees using methods following selection thinning can preserve or even increase the regular distribution of canopy trees. The aim of this method is to selectively cut trees to create equal spaces for the remaining trees. This treatment conserves the spatial homogeneity of both old and young trees. This is a good strategy for production forests; however, if nature conservation is a priority, other methods that improve the spatial heterogeneity of tree distributions should be applied. Several authors have shown that systematic thinning is more effective at breaking tree regularity than selective cutting (Nuutinen et al., 2021). Generally, stand conversion for conservation purposes should be based on increasing spatial heterogeneity by forming a mosaic of patches with dense canopies, patches with moderate densities, and gaps of various sizes (Duflot et al., 2022). In addition, all management strategies based on emulating natural disturbances, such as those based on the gap dynamic model, could accelerate forest naturalization (Angelstam, 1998; Aszalós et al., 2022). For small-scale interventions, simulations of tree cutting and analysis of potential results using geostatistical tools could also be beneficial.
In addition to the appropriate method, the intensity of planned operations is crucial when planning forest stand conversion for conservation purposes. Our study showed that the low-intensity Scots pine removal applied in Roztocze National Park was not always sufficient to change the structure of the site. In plot 6A, where the cutting intensity was the lowest, the contribution of Scots pine expressed as BA was similar to that of the control plot. Therefore, to successfully accelerate the naturalization of former plantations, a higher intensity of cutting activities and its spatial variability depending on existing natural regeneration patches is strongly recommended. Possible public concerns regarding intensive tree cutting in national parks could be mitigated by information campaigns that explain the purpose and character of active protection.
5.
Conclusions
The selective cutting of planted trees can support the naturalization of former Scots pine plantations in protected areas. However, the specific ecological requirements of the target species and habitats, as well as the selection of the proper method and intensity of the canopy tree cuttings, are of vital importance for achieving the desired conservation outcomes. Strategies based on typical management practices, such as selection thinning, although supporting the naturalization of herbaceous vegetation, are not always the best approach, as they may preserve or even increase the regular distribution of trees. Therefore, other methods that increase spatial heterogeneity could be potentially a better choice, including systematic thinning or the simulation of cutting scenarios and the resulting spatial patterns using geostatistical tools. In addition, low-intensity cutting activities may not be sufficient to support natural regeneration or change the size structure. Unfortunately, in our study system, we were unable to test the effects of a broad range of management strategies and thinning intensities, which could be tested experimentally in further long-term studies.
CRediT authorship contribution statement
Remigiusz Pielech: Writing – review & editing, Writing – original draft, Visualization, Validation, Supervision, Resources, Project administration, Methodology, Investigation, Funding acquisition, Formal analysis, Data curation, Conceptualization. Adrian Wysocki: Writing – review & editing, Writing – original draft, Visualization, Validation, Investigation, Formal analysis, Data curation. Kacper Foremnik: Writing – review & editing, Writing – original draft, Visualization, Validation, Investigation, Formal analysis, Data curation. Marek Malicki: Investigation. Bartłomiej Surmacz: Writing – review & editing, Writing – original draft, Visualization, Validation, Investigation, Formal analysis, Data curation. Jerzy Szwagrzyk: Methodology, Funding acquisition, Conceptualization. Zbigniew Maciejewski: Writing – review & editing, Writing – original draft, Visualization, Validation, Supervision, Resources, Project administration, Methodology, Investigation, Funding acquisition, Formal analysis, Data curation, Conceptualization.
Data availability
Data are available on request from the authors.
Declaration of competing interest
The authors declare the following financial interests/personal relationships which may be considered as potential competing interests: Remigiusz Pielech reports financial support was provided by Polish State Forests. If there are other authors, they declare that they have no known competing financial interests or personal relationships that could have appeared to influence the work reported in this paper.
Aleksandrowicz-Trzcińska, M., Drozdowski, S., Wołczyk, Z., Bielak, K., Żybura, H., 2017. Effects of reforestation and site preparation methods on early growth and survival of Scots pine (Pinus sylvestris L.) in south-eastern Poland. Forests 8, 421. .
Angelstam, P.K., 1998. Maintaining and restoring biodiversity in European boreal forests by developing natural disturbance regimes. J. Veg. Sci. 9, 593–602. .
Aszalós, R., Thom, D., Aakala, T., Angelstam, P., Brūmelis, G., Gálhidy, L., Gratzer, G., Hlásny, T., Katzensteiner, K., Kovács, B., Knoke, T., Larrieu, L., Motta, R., Müller, J., Ódor, P., Roženbergar, D., Paillet, Y., Pitar, D., Standovár, T., Svoboda, M., Szwagrzyk, J., Toscani, P., Keeton, W.S., 2022. Natural disturbance regimes as a guide for sustainable forest management in Europe. Ecol. Appl. 32, e2596. .
Atkinson, B., Bailey, S., Vaughan, I.P., Memmott, J., 2015. A comparison of clearfelling and gradual thinning of plantations for the restoration of insect herbivores and woodland plants. J. Appl. Ecol. 52, 1538–1546. .
Augustynczik, A.L.D., Yousefpour, R., 2021. Assessing the synergistic value of ecosystem services in European beech forests. Ecosyst. Serv. 49, 101264. .
Baddeley, A., Rubak, E., Turner, R., 2015. Spatial Point Patterns: Methodology and Applications with R. CRC Press, Boca Raton, FL.
Bielak, K., Dudzińska, M., Pretzsch, H., 2014. Mixed stands of Scots pine (Pinus sylvestris L.) and Norway spruce (Picea abies [L.] Karst) can be more productive than monocultures. Evidence from over 100 years of observation of long-term experiments. Forest Syst. 23, 573–589. .
Bivand, R., Lewin-Koh,N., 2021. maptools:tools for handling spatial objects. R package version 1, 1–2. . (Accessed 9 July 2024).
Boncina, A., Kadunc, A., Robic, D., 2007. Effects of selective thinning on growth and development of beech (Fagus sylvatica L.) forest stands in south-eastern Slovenia. Ann. For. Sci. 64, 47–57. .
Budde, S., Schmidt, W., Weckesser, M., 2011. Impact of the admixture of European beech (Fagus sylvatica L.) on plant species diversity and naturalness of conifer stands in Lower Saxony. Biodivers. Conserv. 20, 895–908. .
Crecente-Campo, F., Pommerening, A., Rodríguez-Soalleiro, R., 2009. Impacts of thinning on structure, growth and risk of crown fire in a Pinus sylvestris L. plantation in northern Spain. For. Ecol. Manag. 257, 1945–1954. .
Dixon, P.M., 2002. Ripley’s K function. In: El-Shaarawi, Abdel H., Piegorsch, Walter W. (Eds.), Encyclopedia of Environmetrics, 3. John Wiley & Sons, Chichester, pp. 1796–1803. Ltd.
Dobrowolska, D., 2006. Oak natural regeneration and conversion processes in mixed Scots pine stands. Forestry 79, 503–513. .
Duflot, R., Fahrig, L., Mönkkönen, M., 2022. Management diversity begets biodiversity in production forest landscapes. Biol. Conserv. 268, 109514. .
Durrant, H.T., de Rigo, D., Caudullo, G., 2016. Pinus sylvestris in Europe: distribution, habitat, usage and threats. In: San-Miguel-Ayanz, J., de Rigo, D., Caudullo, G., Houston Durrant, T., Mauri, A. (Eds.), European Atlas of Forest Tree Species. Publications Office of the European Union, Luxembourg, pp. 81–83.
Elliott, K.J., Vose, J.M., Knoepp, J.D., Clinton, B.D., Kloeppel, B.D., 2015. Functional role of the herbaceous layer in eastern deciduous forest ecosystems. Ecosystems 18, 221–236. .
Felton, A., Lindbladh, M., Brunet, J., Fritz, Ö., 2010. Replacing coniferous monocultures with mixed-species production stands: an assessment of the potential benefits for forest biodiversity in northern Europe. For. Ecol. Manag. 260, 939–947. .
Förster, A., Culmsee, H., Leuschner, C., 2021. Thinned northern German Scots pine forests have a low carbon storage and uptake potential in comparison to naturally developing beech forests. For. Ecol. Manag. 479, 118575. .
Franklin, C.M.A., Macdonald, S.E., Nielsen, S.E., 2018. Combining aggregated and dispersed tree retention harvesting for conservation of vascular plant communities. Ecol. Appl. 28, 1830–1840. .
Götmark, F., Paltto, H., Nordén, B., Götmark, E., 2005. Evaluating partial cutting in broadleaved temperate forest under strong experimental control: short-term effects on herbaceous plants. For. Ecol. Manag. 214, 124–141. .
Heinrichs, S., Schmidt, W., 2009. Short-term effects of selection and clear-cutting on the shrub and herb layer vegetation during the conversion of even-aged Norway spruce stands into mixed stands. For. Ecol. Manag. 258, 667–678. .
Hobbie, S.E., 1992. Effects of plant species on nutrient cycling. Trends Ecol. Evol. 7, 336–339. .
Izdebski, K., Czarnecka, B., Grądziel, T., Lorens, B., Popiołek, Z., 1992. Plant communities against the background of the Roztocze National Park habitat conditions. UMCS, Lublin.[In Polish with English summary].
Izdebski, K., Kimsa, T., Kozak, K., Michna, E., Popiołek, Z., Strączek, A., Zienkiewicz, A., 1976. Influence of habitats of two forest ecosystems on productivity of pine stands in Central Roztocze. Ann. Univ. Mariae Curie-Skłodowska 32 (C), 1–43.
Izdebski, K., Kimsa, T., Kozak, K., Michna, E., Popiołek, Z., Strączek, A., Zinkiewicz, A., 1977. The effect of habitats in two forest ecosystems on the productivity of pine stands in Central Roztocze. Ekol. Pol. 25, 89–105.
Jactel, H., Bauhus, J., Boberg, J., Bonal, D., Castagneyrol, B., Gardiner, B., Gonzalez-Olabarria, J.R., Koricheva, J., Meurisse, N., Brockerhoff, E.G., 2017. Tree diversity drives forest stand resistance to natural disturbances. Curr. For. Rep. 3, 223–243.
Jaroszewicz, B., Cholewińska, O., Gutowski, J.M., Samojlik, T., Zimny, M., Latałowa, M., 2019. Białowieża Forest—a relic of the high naturalness of European forests. Forests 10 (10), 849. .
Keiser, A.D., Knoepp, J.D., Bradford, M.A., 2013. Microbial communities may modify how litter quality affects potential decomposition rates as tree species migrate. Plant Soil 372, 167–176. .
Kassambara, A., 2020. ggpubr: ‘ggplot2’ based publication-ready plots. R Package Version 0.4.0.
Kaszewski, B.M., 2008. Warunki Klimatyczne Lubelszczyzny. Wydawnictwo UMCS [In Polish].
Kint, V., 2005. Structural development in ageing temperate Scots pine stands. For. Ecol. Manag. 214, 237–250. .
Kint, V., Geudens, G., Mohren, G.M.J., Lust, N., 2006. Silvicultural interpretation of natural vegetation dynamics in ageing Scots pine stands for their conversion into mixed broadleaved stands. For. Ecol. Manag. 223, 363–370. .
Kint, V., Lasch, P., Lindner, M., Muys, B., 2009. Multipurpose conversion management of Scots pine towards mixed oak–birch stands—a long-term simulation approach. For. Ecol. Manag. 257, 199–214. .
Kint, V., van Meirvenne, M., Nachtergale, L., Geudens, G., Lust, N., 2003. Spatial methods for quantifying forest stand structure development: a comparison between nearest-neighbor indices and variogram analysis. For. Sci. 49, 36–49.
Koba, J., Miśta, T., 2015. Forest site types and soil cover in the Roztocze National Park – the current state of knowledge. Ann. UMCS, Ser. C 70.
Kuehne, C., Weiskittel, A., Pommerening, A., Wagner, R.G., 2018. Evaluation of 10-year temporal and spatial variability in structure and growth across contrasting commercial thinning treatments in spruce-fir forests of northern Maine, USA. Ann. For. Sci 75, 20. .
Laarmann, D., Korjus, H., Sims, A., Kangur, A., Stanturf, J.A., 2013. Initial effects of restoring natural forest structures in Estonia. For. Ecol. Manag. 304, 303–311. .
Landres, P., 2010. Let it be: a hands-off approach to preserving wildness in protected areas. In: Cole, D.N.Y., Laurie (Eds.), Beyond Naturalness: Rethinking Park and Wilderness Stewardship in an Era of Rapid Change. Island Press, Washington D.C., pp. 88–105
Li, Y., Xu, J., Wang, H., Nong, Y., Sun, G., Yu, S., Liao, L., Ye, S., 2021. Long-term effects of thinning and mixing on stand spatial structure: a case study of Chinese fir plantations. iForest 14, 113–121. .
Löbmann, M.T., Geitner, C., Wellstein, C., Zerbe, S., 2020. The influence of herbaceous vegetation on slope stability – a review. Earth Sci. Rev. 209, 103328. .
Lust, N., Muys, B., Nachtergale, L., 1998. Increase of biodiversity in homogeneous Scots pine stands by an ecologically diversified management. Biodivers. Conserv. 7, 249–260. .
Maciejewski, Z., 2011. Spontaneous regeneration of a Carpathian beech forest in planted pine stands on the Roztocze Highlands (Roztocze National Park, south-east Poland). Pol. J. Ecol. 59, 235–248.
Maciejewski, Z., Zubel, R., 2009. Long-term changes in Leucobryo-Pinetum community: interactions between the tree-stand, understorey and moss layer. Ann. UMCS, Ser. C 64, 23–34.
Maruszczak, H., 1998. Geologiczne i geomorfologiczne warunki rozwoju osadnictwa prahistorycznego na Roztoczu. Prz. Geol. 46, 851–856.
Nuutinen, Y., Miina, J., Saksa, T., Bergström, D., Routa, J., 2021. Comparing the characteristics of boom-corridor and selectively thinned stands of Scots pine and birch. Silva Fenn. 55, id10462. .
Norris, M.D., Avis, P.G., Reich, P.B., Hobbie, S.E., 2013. Positive feedbacks between decomposition and soil nitrogen availability along fertility gradients. Plant Soil 367, 347–361. .
O’Hara, K.L., 2001. The silviculture of transformation — a commentary. For. Ecol. Manag. 151, 81–86. .
Oksanen, J., Blanchet, F.G., Friendly, M., Kindt, R., Legendre, P., McGlinn, D., Minchin, P.R., O'Hara, R., Simpson, G.L., Solymos, P., 2019. Vegan: community ecology package. R package version 2, 5–6. . (Accessed 9 June 2024).
Pach, M., Sansone, D., Ponette, Q., Barreiro, S., Mason, B., Bravo-Oviedo, A., Löf, M., Bravo, F., Pretzsch, H., Lesiński, J., Ammer, C., Đodan, M., Peric, S., Bielak, K., Brazaitis, G., del Río, M., Dezzotti, A., Drossler, L., Fabrika, M., Fonseca, T., Govedar, Z., Kangur, A., Kurylyak, V., Loguercio, G.A., Libiete-Zalite, Z., Madsen, P., Matović, B., Meliadis, I., Meliadis, M., Metslaid, M., Mounir, F., Müller-Using, S., Short, I., Souidi, Z., Sterba, H., Stojanović, D., Svoboda, M., Verheyen, K., Yildiz, O., Zahvoyska, L., Zlatanov, T., Corona, P., 2018. Silviculture of mixed forests: a European overview of current practices and challenges. In: Bravo-Oviedo, A., Pretzsch, H., del Río, M. (Eds.), Dynamics, Silviculture and Management of Mixed Forests. Springer International Publishing, Cham, pp. 185–253. .
Peel, M.C., Finlayson, B.L., McMahon, T.A., 2007. Updated world map of the Köppen-Geiger climate classification. Hydrol. Earth Syst. Sci. 11, 1633–1644. .
Pielech, R., Foremnik, K., Surmacz, B., Szwagrzyk, J., Maciejewski, Z., 2022. Przebudowa drzewostanu jako narzędzie czynnej ochrony w parkach narodowych. Pr. Mater. Muz. Wł. Szafera 32, 65–78 https://zenodo.org/records/7471710.
Pretzsch, H., del Río, M., Ammer, C., Avdagic, A., Barbeito, I., Bielak, K., Brazaitis, G., Coll, L., Dirnberger, G., Drössler, L., Fabrika, M., Forrester, D.I., Godvod, K., Heym, M., Hurt, V., Kurylyak, V., Löf, M., Lombardi, F., Matović, B., Mohren, F., Motta, R., den Ouden, J., Pach, M., Ponette, Q., Schütze, G., Schweig, J., Skrzyszewski, J., Sramek, V., Sterba, H., Stojanović, D., Svoboda, M., Vanhellemont, M., Verheyen, K., Wellhausen, K., Zlatanov, T., Bravo-Oviedo, A., 2015. Growth and yield of mixed versus pure stands of Scots pine (Pinus sylvestris L.) and European beech (Fagus sylvatica L.) analysed along a productivity gradient through Europe. Eur. J. For. Res. 134, 927–947. .
Puettmann, K.J., Messier, C., Coates, K.D., 2014. Managing forests as complex adaptive systems: introductory concepts and applications. In: Messier, C., Puettmann, K.J., Coates, K.D. (Eds.), Managing Forests as Complex Adaptive Systems: Building Resilience to the Challenge of Global Change. Routledge Taylor & Francis, Oxford, UK, pp. 3–16. .
R Core Team, 2022. R: A Language and Environment for Statistical Computing. R Foundation for Statistical Computing, Vienna, Austria. . (Accessed 9 June 2024).
Rawlik, K., Nowiński, M., Jagodziński, A.M., 2021. Short life–fast death: decomposition rates of woody plants leaf- and herb-litter. Ann. For. Sci 78, 6. .
Ripley, B.D., 1976. The second-order analysis of stationary point processes. J. Appl. Probab. 13, 255–266. .
Ripley, B.D., 1977. Modelling spatial patterns. J. R. Stat. Soc. Ser. B (Methodol.) 39, 172–192. .
Sebek, P., Bace, R., Bartos, M., Benes, J., Chlumska, Z., Dolezal, J., Dvorsky, M., Kovar, J., Machac, O., Mikatova, B., Perlik, M., Platek, M., Polakova, S., Skorpik, M., Stejskal, R., Svoboda, M., Trnka, F., Vlasin, M., Zapletal, M., Cizek, L., 2015. Does a minimal intervention approach threaten the biodiversity of protected areas? A multi-taxa short-term response to intervention in temperate oak-dominated forests. For. Ecol. Manag. 358, 80–89. .
Szwagrzyk, J., Szewczyk, J., Maciejewski, Z., 2012. Shade-tolerant tree species from temperate forests differ in their competitive abilities: a case study from Roztocze, south-eastern Poland. For. Ecol. Manag. 282, 28–35. .
Vrska, T., Ponikelsky, J., Pavlicova, P., Janik, D., Adam, D., 2017. Twenty years of conversion: from Scots pine plantations to oak-dominated multifunctional forests. iForest 10, 75–82. .
Ward, J.S., Ferrandino, F.J., 1999. New derivation reduces bias and increases power of Ripley's L index. Ecol. Model. 116, 225–236. .
Wang, Z., Li, Y., Wang, G., Zhang, Z., Chen, Y., Liu, X., Peng, R., 2024. Drivers of spatial structure in thinned forests. For. Ecosyst. 11, 100182. .
Wickham, H., 2016. ggplot2: Elegant Graphics for Data Analysis. Springer. .
Wickham, H., François, R., Henry, L., Müller, K., 2020. dplyr: a grammar of data
manipulation. R package, version 1.0.0. . (Accessed 9 June 2024).
Wickham, H., Henry, L., 2020. tidyr: tidy messy data. R package version 1.1.0. . (Accessed 9 June 2024).
Widenfalk, O., Weslien, J., 2009. Plant species richness in managed boreal forests—effects of stand succession and thinning. For. Ecol. Manag. 257, 1386–1394. .
Yang, H., Pan, C., Wu, Y., Qing, S., Wang, Z., Wang, D., 2023. Response of understory plant species richness and tree regeneration to thinning in Pinus tabuliformis plantations in northern China. For. Ecosyst. 10, 100105. .
Zerbe, S., 2002. Restoration of natural broad-leaved woodland in Central Europe on sites with coniferous forest plantations. For. Ecol. Manag. 167, 27–42. .
Zerbe, S., Kreyer, D., 2007. Influence of different forest conversion strategies on ground vegetation and tree regeneration in pine (Pinus sylvestris L.) stands: a case study in NE Germany. Eur. J. For. Res. 126, 291–301. .
Table
1.
Characteristics of permanent plots used in this study. Intensity of Scots pine removal refers to total number (N) and total basal area (BA, m2) of Scots pine trees removed since 2007.

 DownLoad:


 Email Alerts
 RSS Feeds