A. Galibina Natalia, M. Nikerova Kseniya, A. Moshnikov Sergey, M. Kryshen Alexander. Assessment of the heartwood contribution to carbon accumulation in Pinus sylvestris L. trees under different forest site conditions[J]. Forest Ecosystems, 2025, 12(1): 100274. DOI: 10.1016/j.fecs.2024.100274
Citation:
A. Galibina Natalia, M. Nikerova Kseniya, A. Moshnikov Sergey, M. Kryshen Alexander. Assessment of the heartwood contribution to carbon accumulation in Pinus sylvestris L. trees under different forest site conditions[J]. Forest Ecosystems, 2025, 12(1): 100274. DOI: 10.1016/j.fecs.2024.100274
A. Galibina Natalia, M. Nikerova Kseniya, A. Moshnikov Sergey, M. Kryshen Alexander. Assessment of the heartwood contribution to carbon accumulation in Pinus sylvestris L. trees under different forest site conditions[J]. Forest Ecosystems, 2025, 12(1): 100274. DOI: 10.1016/j.fecs.2024.100274
Citation:
A. Galibina Natalia, M. Nikerova Kseniya, A. Moshnikov Sergey, M. Kryshen Alexander. Assessment of the heartwood contribution to carbon accumulation in Pinus sylvestris L. trees under different forest site conditions[J]. Forest Ecosystems, 2025, 12(1): 100274. DOI: 10.1016/j.fecs.2024.100274
Forest Research Institute of the Karelian Research Centre of the Russian Academy of Sciences, 11 Pushkinskaya St., 185910, Petrozavodsk, Karelia, Russia
Funds:
The framework of the most important innovative project of state importance “Development of a system of ground-based and remote monitoring of carbon pools and greenhouse gas fluxes on the territory of the Russian Federation, …”123030300031-6
The state assignment of the Forest Institute of the Karelian Research Center of the Russian Academy of SciencesFMEN-2021-0018
The heartwood (HW) proportion in the trunk of mature trees is an important characteristic not only for wood quality but also for assessing the role of forests in carbon sequestration. We have for the first time studied the proportion of HW in the trunk and the distribution of carbon and extractives in sapwood (SW) and HW of 70–80 year old Pinus sylvestris L. trees under different growing conditions in the pine forests of North-West Russia.
Method
We have examined the influence of conditions and tree position in stand (dominant, intermediate and suppressed trees) in the ecological series: blueberry pine forest (Blu) – lingonberry pine forest (Lin) – lichen pine forest (Lic). We have analyzed the influence of climate conditions in the biogeographical series of Lin: the middle taiga subzone – the northern taiga subzone – the transition area of the northern taiga subzone and tundra.
Results
We found that the carbon concentration in HW was 1.6%–3.4% higher than in SW, and the difference depended on growing conditions. Carbon concentration in HW increased with a decrease in stand productivity (Blu-Lin-Lic). In medium-productive stands, the carbon concentration in SW was higher in intermediate and supressed trees compared to dominant trees. In the series from south to north, carbon concentration in HW increased by up to 2%, while in SW, it rose by 2.7%–3.8%.
Conclusions
Our results once again emphasized the need for an empirical assessment of the accurate carbon content in aboveground wood biomass, including various forest growing conditions, to better understand the role of boreal forests in carbon storage.
Scots pine is one of the most important forest-forming conifers in Northern Europe, accounting for approximately 39% of forests in Sweden (Lerceteau et al., 2000), over 50% in Finland (Finnish Forest Research Institute, 2009), 64% of the forests of Russian Karelia (State Report on the Environment in Republic of Karelia, 2021). Because of the pronounced transition zone between HW and SW, pine is considered a model plant for studying the processes of HW formation (Saranpää and Höll, 1987, 1989; Fagerstedt et al., 1998; Hauch and Magel, 1998; Bergström et al., 1999; Magel et al., 2000; Bergstrom, 2003; Kennedy et al., 2013; Esteves et al., 2013; Lim et al., 2016). Scots pine patterns of HW formation were studied in the North-West of Russia under the conditions of the lingonberry, blueberry and lichen pine forests (Galibina et al., 2022a, Galibina et al., 2022b; Tarelkina et al., 2022). In this study, we estimated the HW proportion in the trunk of Scots pine depending on the position of the tree in the stand (biosocial class according to Fabisiak and Fabisiak, 2021; Zawieja et al., 2021) in the conditions of the middle taiga subzone and in the gradient of climatic conditions (middle taiga subzone – northern taiga subzone – transition area of the northern taiga subzone and tundra). We sought to ask: (ⅰ) Does the carbon concentration differ between SW and HW in different forest conditions and depending on the position of the tree in the stand? (ⅱ) Is the carbon concentration in SW and HW connected with extractive compound content? (ⅲ) Do the HW proportion in pine trees and the carbon concentration in SW and HW influence on carbon estimation under different forest site conditions? We hypothesized that stands with a high proportion of heartwood in the tree trunk store more carbon in the wood due to changes in the wood's chemical composition. Thus, when growing conditions deteriorate, cambial growth is reduced, leading to increased extractive components, which results in higher wood carbon content.
2.
Materials and methods
2.1
Plant material and sample plots characteristics
The studies were performed on sample plots (SPs) of Forest Research Institute of the Karelian Research Centre of the Russian Academy of Sciences, established in 2021–2022 as part of a project aimed at studying the patterns of heartwood formation in Scots pine. Pine trees aged 70–80 years were selected for the study, which corresponded to the middle age ontogenesis stage (Sannikov, 1992), as well as the age at which the wood quality was a significant indicator since pine stands were assigned for felling following forestry requirements in this period.
The influence of soil conditions on the share of HW, carbon and extractive compound content in SW and HW in Scots pine was studied in the ecological series: blueberry (Vaccinium myrtillus L.) pine forest (Blu) – lingonberry (V. vitis-idaea L.) pine forest (Lin) – lichen pine forest (Lic), located in the Kivach Nature Reserve (62°16′05″ N, 33°58′49″ E) and its vicinity (middle taiga subzone) (Supplemental Materials Fig. S1). The soils were classified as Albic Podzols Arenice (blueberry and lingonberry pine forest) and Entice Podzol (lichen pine forest) according to the soil classification IUSS Working Group WRB 2015 (Tarelkina et al., 2022). The forest type was determined based on the analysis of soil data, ground cover (ground vegetation) and stand productivity. Lingonberry pine forest is widely represented in various climatic conditions. In Karelia they occupy over 30%, in the Murmansk region 42%. Blueberry pine forests are a relatively highly productive type of forest, which is formed on soils with a fairly high level of fertility and a sufficient amount of soil moisture. They are the second most common forest type in the study area. Lichen pine forests are a low-productive type of forest that forms on poor and dry soils. The lichen forest type is quite rare in Karelia and relatively poorly studied, which is also because of its low exploitation value. Lichen pine forest is widely represented in northern Fennoscandia and Western Siberia; on the territory of the latter, lichen forests account for 30% of the area of pine forests (Rysin and Savelieva, 2008; Krylov, 1961).
To assess the influence of the position of the tree (social classes) on the studied parameters, three groups of trees were identified on SPs: dominant trees (D.t., approximately 30%–40% higher than average trees in terms of trunk diameter at a height of 1.3 m (DBH)), intermediate trees (I.t., trees that close in height and diameter to the average stand), and suppressed trees (S.t., 30%–35% below the average tree stand by DBH) (Table 1). Each group had 3–5 model trees.
Table
1.
Characterization of model trees on SPs 1, 2, 8, 9 (middle taiga subzone), SP 10 (northern taiga subzone) and SP 12 (transition area of the northern taiga subzone and tundra).
Forest typea (sample plot name)
Age (years)
Dominant trees
Intermediate trees
Suppressed trees
Number trees
DBH (cm)
Height (m)
Number trees
DBH (cm)
Height (m)
Number trees
DBH (cm)
Height (m)
Lic (8)
70
5
23.3 ± 2.2
14.2 ± 1.5
5
16.2 ± 0.5
12.7 ± 0.8
3
10.0 ± 0.7
9.8 ± 0.7
Lin (1)
80
4
21.1 ± 1.5
19.6 ± 0.9
3
13.5 ± 0.2
16.9 ± 0.6
3
9.4 ± 0.3
14.2 ± 0.6
Lin (9)
70
3
20.7 ± 1.9
21.8 ± 1.1
3
15.8 ± 1.1
19.8 ± 2.1
3
10.2 ± 1.1
14.5 ± 1.0
Blu (2)
80
5
32.4 ± 2.2
26.5 ± 1.2
3
23.4 ± 1.0
25.0 ± 1.1
3
16.7 ± 0.7
21.9 ± 2.0
Lin (10)
80
5
18.4 ± 2.0
15.5 ± 1.7
–
–
–
–
–
–
Lin (12)
80
5
12.6 ± 2.0
10.0 ± 0.4
–
–
–
–
–
a Forest types are: Lic – lichen pine forest, Lin – lingonberry pine forest, Blu – blueberry pine forest.
The influence of climatic factors on the studied indicators was studied using the example of Lin in different climatic conditions: (ⅰ) the middle taiga subzone (SPs 1, 9), (ⅱ) the northern taiga subzone (SP 10, 65°22′9″ N, 31°7′44″ E), and (ⅲ) the transition area of the northern taiga subzone and tundra (SP 12, 68°59′45″ N, 28°59′19″ E) (Supplemental Materials Fig. S1).
2.2
Establishment of sample plots
Sample plots were established according to the methods generally accepted in forest assessment. The age of the sampling cores was determined with the Pressler increment borer (Haglöf, Sweden) at the root collar in 15–20 trees. A continuous count of trees was carried out in 2-cm steps of diameter on the sample plots. The heights were measured for 20–25 trees for pine and 10–15 trees for other species (spruce and birch). At the SP, natural regeneration was assessed by size categories (up to 0.25, 0.26–0.50, 0.51–1.00, 1.01–1.50, 1.51–2.00 m, and more than 2.00 m), taking into account its viability. In addition, the nature of the distribution of undergrowth over the area was determined. The coarse woody debris was classified into three categories: windblow, windfall, deadwood. The following stand characteristics were determined: tree species composition, tree density, trunk volume of trees and others (Supplemental Materials Table S1).
2.3
Core sampling and determination of the SW and HW transition zone
To determine the HW proportion, cores, containing the pith, were taken from model trees at different trunk heights: 0.3, 1.5, 4.5, 7.5, 10.5, 13.5 m. For short model trees with a thin trunk, sampling was limited to 4.5 or 6–7 m; for some model trees, cores were additionally taken at a height of 3.0, 6.5, 9.0 m. Missing data at some heights are related to the morphological characteristics of the tree: tree height and the height of the lowest living branch. In all cases, trees were cored out from the south side of the trunk. Potassium nitrite (6% aqueous solution) and sulfanilic acid (1% aqueous solution) were used to determine the transition zone between SW and HW (Cummins, 1972; Fries et al., 2000). Initially, the mixture of reagents is transparent. As a result of this treatment, SW remains a light-yellow color, and HW is dyed an intense red color (Supplemental Materials Fig. S2). This qualitative reaction to pinosylvin, a phenolic substance from the stilbene class, is widely found in P. sylvestris heartwood (Bergström et al., 1999; Ekeberg et al., 2006).
To determine the carbon, cellulose, lignin and extractives contents in SW and HW, additional cores were taken at a height of 1.5 m. At SPs 1, 2, 8, 9, core sampling was carried out at the end of May 2021 (determination of cellulose, lignin and extractives contents) and at the beginning of October 2022 (determination of carbon and cellulose, lignin and extractives contents). At SPs 10, 12, core sampling was carried out in early October 2021 and in late June – early July 2022 (determination of carbon and cellulose, lignin and extractives contents). To study the effect of sampling height on carbon and extractive compound content in trees at SP 12 in late June – early July 2022, cores were taken at different stem heights (0.3, 1, 2, 3, 4, 5, 6, 7, 8 m). For chemical analysis, the cores were frozen in liquid nitrogen and stored in a low-temperature freezer at −70 ℃. Then, the samples were freeze-dried immediately before analysis.
2.4
Morphological studies
The cores were photographed using an ADF S645 stereomicroscope equipped with a 10-Mp camera (ADF OPTICS CO LTD, China), and the following parameters were determined on the resulting images using ImageJ image analysis software: number of annual rings in xylem (cambial age, C.A.), number of annual rings in heart- and sapwood (HW and SW), radial width (R(W)), radial width in heart- and sapwood (R(HW) and R(SW)). Based on the data obtained, the cross-sectional area of xylem (S(W)), heartwood area (S(HW)), sapwood area (S(SW)) and heartwood proportion (HW (%)) were calculated as follows:
S(W)=π×(R(W))2,
S(HW)=π×(R(HW))2,
S(S W)=S(W)-S(H W),
HW(%)=R(HW)×100/R(W)
2.5
Biochemical research
Mechanical trituration of the freeze-dried SW and HW samples to homogenous powder by laboratory mill was used. The carbon concentrations were estimated for freeze-dried material (1.5–2.5 mg) using the PerkinElmer 2400 Series Ⅱ CHNS/O Analyzer (USA), calibrated with the organic analytical standard acetanilide (PerkinElmer N 0204–1121).
For easier extraction, the SW and HW samples were transformed into sawdust by laboratory mill. The samples were prepared to a particle size 0.25–1.00 mm. The classified sawdust was stored in an air-conditioned room then it was used for the extraction (Rodrigue et al., 2016; Brocco et al., 2017; Warlo et al., 2023). Extractives content was made in absolute ethanol as recommended by the “Technical Association of the Pulp and Paper Industry” – TAPPI T 264 om-88 (1992) and determined gravimetrically and expressed as a percentage of the total mass of a sample (TAPPI, 1992, TAPPI, 2011).
Then this material that is free from resinous substances (Geles, 2001; Arisandi et al., 2019) was used for lignin determination. Lignin was isolated by acid hydrolysis in 72% sulfuric acid. The lignin content was determined gravimetrically (TAPPI protocol, 2011) and expressed as a percentage of the total mass of a sample.
Cellulose was isolated by the Kürschner-Hoffer method using a mixture of concentrated nitric acid and ethanol in a volume proportion of 1/4 (Kürschner and Hoffer, 1929; Ghavidel et al., 2020; Krutul et al., 2021). Cellulose content was determined gravimetrically. The cellulose content was expressed as a percentage of the total mass of a sample.
2.6
Experimental design
The research experiment design and description of the analyses of the selected plant material are summarized in Table 2.
Table
2.
Summary of the research experiment design and analysis of selected plant materials.
Factors
Core sampling from model trees at trunk heights (m)
Morphological studies (determination the HW proportion at trunk heights)
Biochemical research (at trunk heights 1.5 m)
The influence of climatic factorsa
The influence of soil conditions (forest typeb)
The influence of the position of the tree in the stand (social class
c
)
The C concentration (%)
Extractives content (%)
Cellulose content (%)
Lignin content (%)
MT
Blu
D.t.
0.3, 1.5, 4.5, 7.5, 10.5
+
+
+
+
+
I.t.
0.3, 1.5, 4.5, 7.5, 10.5, 13.5
+
S.t.
0.3, 1.5, 4.5, 7.5, 10.5
+
Lin
D.t.
0.3, 1.5, 4.5, 7.5, 10.5
+
+
+
+
+
I.t.
0.3, 1.5, 3, 4.5, 6, 7.5, 10.5
+
+
+
+
+
S.t.
0.3, 1.5, 3, 4.5, 6, 7.5, 9, 10.5, 13
+
+
+
+
+
Lic
D.t.
0.3, 1.5, 4.5, 5.5, 6.5, 7.5, 8.5
+
+
+
+
+
I.t.
0.3, 1.5, 3.0, 4.5
+
S.t.
0.3, 1.5, 3.0, 4.5, 6,5, 8.5
+
NT
Lin
D.t.
0.3, 1.5, 4.5, 7.5, 10.5
+
+
+
+
+
NT/T
Lin
D.t.
0.3, 1.5, 4.5, 7.5, 9 and 1, 2, 3, 4, 5, 6, 7, 8
+
+
+
+
+
a Different climatic condition are: MT – middle taiga subzone, NT – northern taiga subzone, NT/T – transition area of the northern taiga subzone and tundra. b Forest types are: Blu – blueberry pine forest, Lin – lingonberry pine forest, Lic – lichen pine forest. c Social class are: D.t. – dominant trees, I.t. – intermediate trees, S.t. – suppressed trees.
2.7
The evaluation of wood carbon content in different forest types
Based on the data obtained, including the height of the core sampling (h, m), the radial width (R(W), m) and the radial width in the heartwood (R(HW), m) of the cross section, the volume of the trunk section (V(t.s.), m3) and the volume of the heartwood (V(HWt.s.), m3) and sapwood (V(SWt.s.), m3) sections were calculated using the partial cone formula:
where h – length of the tree trunk section, m (distance between the heights of the core sampling); R(W)1, R(HW)1 – the radial width (R(W)) and radial width in heartwood (R(HW)) of the trunk section base; R(W)2, R(HW)2 – the radial width (R(W)) and radial width in heartwood (R(HW)) of the trunk section top.
Wood volume (V), HW and SW volums (V(HW) and V(SW)) were calculated as the sums of V(t.s.), V(HWt.s.), and V(SWt.s.), respectively. In order to assess the influence of soil conditions and tree position in the stand, the calculations were limited to a height of 7.5 m. This was done because cores at this height were taken from all trees, allowing comparison of trees from different forest conditions and different social classes. To assess the influence of climatic conditions, the calculations were to a height of 9.0–10.5 m. Trunk weight (m, kg), SW trunk weight (m(SW), kg), and HW trunk weight (m(HW), kg) were calculated using a wood density (WD) of 0.440 kg⋅m−3 - the average value for the lingonberry and blueberry pine forests in Karelia (calculated according to Kazimirov et al., 1977).
The tree biomass was converted to carbon (mС(trunk), kg⋅tree−1) by two ways: (1) using the coefficient of 0.5 (the generic assumption that aboveground biomass consists of 50% carbon); (2) using coefficients for conversion of SW and HW biomass to carbon (calculated as the average carbon concentration in SW or HW for Blu D.t., Blu I.t., Blu S.t., Lin D.t., Lin I.t., Lin S.t., Lic. D.t., Lic I.t., Lic S.t.., MT, NT, NT/T respectively).
The carbon content in trunk (mС(trunk), Mg⋅ha−1) was converted to carbon content in forest stand according to the formula:
mC=N×mC( trunk ),
where N – number of trees (trees⋅ha−1) on sample plots.
We took into account the proportion of suppressed trees, intermediate trees and dominant trees in the sample plots (SP 2 (Blu), SP 1, 9 (Lin), and SP 8(Lic)) (see Table 3). The suppressed group included trees whose DBH was 30% or more below the average DBH for the forest stand. Trees whose DBH was 30% or more above the average for the forest stand were classified as dominant. The remaining trees were classified as intermediate.
Table
3.
The estimates of wood carbon content in different forest types.
Forest type/social classa
m (pats of trunk) up to 7.5 m (kg)
The coefficient for conversion of SW and HW biomass to carbon
Carbon content in trunk up to 7.5 m (kg·tree−1)
Trees per ha
Carbon content, (Mg·ha−1)
Errors in forest carbon stock due to 50% assumption (%)
m (SW)
m (HW)
m (trunk)
SW
HW
Data set 1b
Data set 2b
Data set 1b
Data set 2b
Blueberry pine forest
45.59
42.09
7.7
D.t.
100.2
88.6
188.8
0.530
0.551
101.9
94.4
65
6.62
6.14
I.t.
60.1
45.7
105.8
0.540
0.545
57.3
52.9
625
35.81
33.05
S.t.
27.5
18.9
46.5
0.537
0.553
25.3
23.2
125
3.16
2.90
Lingonberry pine forest
35.60
33.14
6.9
D.t.
52.0
12.5
64.5
0.522
0.541
33.9
32.3
397
13.45
12.79
I.t.
32.5
9.4
41.9
0.546
0.550
22.9
21.0
693
15.88
14.52
S.t.
10.5
4.5
15.0
0.536
0.543
8.1
7.5
779
6.27
5.83
Lichen pine forest
30.45
28.17
4.8
D.t.
72.8
6.4
79.2
0.530
0.551
42.5
39.6
383
16.28
15.18
I.t.
25.4
3.7
29.0
0.540
0.545
16.0
14.5
525
8.42
7.63
S.t.
10.5
4.5
15.0
0.533
0.563
7.5
7.0
767
5.75
5.37
a Social class are: D.t. – dominant trees, I.t. – intermediate trees, S.t. – suppressed trees. b Data set 1 are: tree biomass was converted to carbon using the coefficient for HW and SW obtained in our studies. Data set 2 are: tree biomass was converted to carbon using a coefficient of 0.5.
The results were statistically processed with PAST (version 4.0). Before starting the statistical analysis, raw data was initially tested for normality using the Shapiro–Wilk test. The significance of differences between variants was estimated by Mann–Whitney U test. Differences were significant at p < 0.05. The data in the diagrams and tables are presented as mean (M) ± SE, where SE is the standard error. In the diagrams, different letters denote statistically significant differences between groups.
Principal component analysis (PCA) and analysis of similarities (ANOSIM) were carried out for different groups of data set according to climate, social class and tissue specificity. Before the calculations, the initial data were standardized. Correlation analysis was performed by Pearson correlation test.
All assays were performed at the Core Facility of the Karelian Research Centre RAS.
3.
Results
3.1
Heartwood proportion varies with tree height, social class, soil and climate condition
The influence of different soil conditions and social classes on heartwood proportion in pine trees was studied using the example of the middle taiga subzone. Previously, we studied the HW proportion in the trunk of 70–80 year old dominant trees (D.t.) in the ecological series: blueberry pine forest (SP 2) – lingonberry pine forest (SPs 1, 9) – lichen pine forest (SP 8) (Galibina et al., 2022a, b; Tarelkina et al., 2022). The datasets are in free-to-access public data repository (Dryad, dryad.prr4xgxnw.2022). Thus, in blueberry pine forest, the HW percentage was the highest and amounted to over 50% up to 1/3 of the height of the tree; in lingonberry pine forest conditions the HW proportion averaged 20%–30% up to half of the tree trunk, while in lichen pine forest HW proportion in the trunk was about 5%–6% up to 6.5 m (about 1/3 of the trunk), and in some models HW was not detected already at the height of 6.5 m (Fig. 1).
Figure
1.
Boxplot displaying the heartwood proportion (%) with tree height (m) in Scots pine trees depending on the social class (dominant (D.t.), intermediate (I.t.) and suppressed (S.t.) trees) in blueberry (Blu), lingonberry (Lin) and lichen (Lic) pine forest (middle taiga subzone). The ordinate axis shows the height (m) of stem tissue sampling.
In blueberry pine forest HW proportion in the trunk did not differ significantly in different social classes up to 7.5 m and was 45%–40% for dominant (Blu (D.t.)), intermediate (Blu (I.t.)) and suppressed (Blu (S.t.)) trees. At a height of 10.5 m, these values were lower for intermediate (40%–30%) and suppressed trees (30%–20%) compared to dominant trees (50%). In lingonberry pine forest we did not find significant differences in the HW proportion in the trunk between dominant (Lin (D.t.)) and intermediate trees (Lin (I.t.)). The suppressed trees (Lin (S.t.)) were distinguished by a higher HW proportion in the trunk section from 1.5 to 7.5 m (32%–36%). Unexpected results were obtained for the lichen pine forest. Both intermediate trees (Lic (I.t.)) and suppressed trees (Lic (S.t.)) contained a higher HW percentage in throughout the trunk compared to dominant trees (Lic (D.t.)) (Fig. 1, Supplemental Materials Table S2).
Thus, high soil fertility has a positive effect on HW formation, while deteriorating soil conditions lead to a decrease in the HW proportion in pine trunk. Social class affects HW formation only when soil conditions deteriorate, with the HW share increasing. The pine trees from different soil conditions and different social class are arranged in order of decreasing the HW proportion in trunk as follows: Blu D.t. (47%), Blu S.t. (39%), Blu I.t. (37%), Lin S.t. (28%), Lin I.t. (22%), Lin D.t. (18%), Lic S.t. (12%), Lic I.t. (11%), Lic. D.t. (8%) (Fig. 1).
To further compare heartwood proportion at the base of the trunk (0.3–10.5 m) in pine trees under different forest types and under different social class analysis of similarities (ANOSIM) was performed. The results showed that heartwood proportion in pine trees did not differ between dominant (D.t.), intermediate (I.t.) and suppressed (S.t.) ones (Fig. 2a) and differed between trees from Blu, Lin and Lic (middle taiga subzone) (Fig. 2b). So, forest type had a greater impact on the heartwood proportion compared with the social class (Fig. 2).
Figure
2.
ANOSIM analysis of heartwood proportion (%) in pine trees under different social class (a) (dominant (D.t.) intermediate (I.t.) and suppressed (S.t.)) and under different forest types (b) (blueberry (Blu), lingonberry (Lin) and lichen (Lic) pine forests (middle taiga subzone)). Ordination of 49 model pine trees (c) based on heartwood proportion (%) at the heights 0.3, and 1.5, and 4.5 m growing in different forest types (Blu, Lin and Lic) and with the different social class (D.t., I.t. and S.t.). Factor 1 (85.5% of the variance) correlated with the height 0.3 m (r = 0.55), 1.5 m (r = 0.60) and 4.5 m (r = 0.58). Factor 2 (11.6% of the variance) correlated with the height 0.3 m (r = 0.80). The red group represents trees from lichen pine forest. The green group represents trees from lingonberry pine forest. The blue group represents trees from blueberry pine forest. (For interpretation of the references to color in this figure legend, the reader is referred to the Web version of this article.)
Then principal component analysis (PCA) was carried out in a data set on the heartwood proportion in pine trees at the heights 0.3, 1.5, and 4.5 m under different forest types and under different social class. Its results confirmed that investigated trees were divided into separate groups based on growing in different forest conditions (Fig. 2c).
Heartwood proportion in pine trees under different climatic conditions was studied in 70–80-year-old Lin communities, using dominant trees as an example. In trees growing in the northern taiga subzone (NT) (SP 10) (Fig. 3) we did not find significant differences in the HW percentage in the trunk compared to those in pines from the middle taiga subzone (MT) (SPs 1, 9) (Dryad, dryad.prr4xgxnw.2022). A distinctive feature of these trees was a higher percentage of HW by 3–4.5 m compared to the trunk base. In pine trees from the middle taiga subzone, no such features were observed. Pine trees growing in the transition area of the northern taiga subzone and tundra (NT/T) (SP 12) had a lower stem HW percentage compared to SPs 1, 9 and 10, especially starting from the height of 3 m. On average, the HW percentage in the 0.3–5.0 m section of the trunk was 10%–12%. It should be noted that, in dominant trees with SP 12, HW formation was observed almost up to the trunk top (8–9 m) (see Table S3) (Fig. 3). ANOSIM showed that heartwood proportion in pine trees differed slightly between different climate conditions (R = 0.2576, p = 0.0417).
Figure
3.
Boxplot displaying the heartwood proportion (%) with tree height (m) in dominant Scots pine trees in lingonberry pine forest (middle taiga subzone (MT), northern taiga subzone (NT) and transition area of the northern taiga subzone and tundra (NT/T)). The ordinate axis shows the height (m) of stem tissue sampling.
3.2
Carbon concentration and related chemical composition in sapwood and heartwood vary with stem heights, social class, soil and climate conditions
In dominant trees in the forests of transition zone between the northern taiga subzone and tundra, chemical content in trunk tissues was studied as a function of height. Higher carbon concentration in HW compared to SW was observed at 3 m (by 2.7%), 4–5 m (by 1.7%) and 6–7 m (by 1.7%) (Fig. 4a). Differences in extractives content between SW and HW were found at all sampling heights and amounted to 5.7%, 2.5%, 2.6%, 6.6% and 8.3% for 0.3, 1–2, 3, 4–5 and 6–7 m, respectively (Fig. 4b). There were no differences in carbon concentration and extractives content between SW sampled at different stem heights. Whereas there was higher carbon concentration and extractives content in HW at 3, 4–5 and 6–7 m (Fig. 4a). HW had 5.2%, 5.6%, 7.4%, 7.4% and 12.1% less cellulose than SW for 0.3, 1–2, 3, 4–5 and 6–7 m (Fig. 4c). Lignin content was the same in HW and SW (Fig. 4d). ANOSIM showed significant differences for SW and HW (R = 0.1323, p = 0.0057) and did not differ in depending on height of stem tissue sampling (R = 0.0237, p = 0.0735). In addition, all SW and HW samples showed a decrease in cellulose content with increasing carbon concentration (R = −0.27; p = 0.02), while cellulose content was negatively correlated with extractive content (R = −0.59; p = 0.0002).
Figure
4.
Boxplot displaying the carbon concentration (a) and extractives (b), cellulose (c), lignin (d) contents with tree height (m) in heartwood (HW) and sapwood (SW) in dominant Scots pine trees in the transition area of the northern taiga subzone and tundra. The abscissa shows the height (m) of stem tissue sampling. Significant differences between SW and HW at p < 0.05 are marked by different letters.
Lingonberry pine forest was used to illustrate how the tree's position in the forest stand influences carbon, extractives, cellulose, and lignin content in SW or HW (Fig. 5). The cores were taken at a height of 1.5 m off the ground. Dominant trees carbon concentration in HW was 1.9% higher compared to SW. In intermediate and suppressed trees, we did not find significant differences in carbon concentration between SW and HW. We did not find significant differences in carbon concentration in HW between trees of different social class. However, carbon concentration in SW was higher in intermediate and suppressed trees, compared to dominant trees, by 2.4% and 1.4% (Fig. 5a). We found that extractives content in HW exceeded that in SW by 5% and 2.1% in dominant and suppressed trees respectively. No differences were between SW and HW in intermediate trees. We found that intermediate and suppressed trees had higher extractives content in SW and lower in HW compared to dominant trees (Fig. 5b). The dominant, intermediate and suppressed trees showed differences in cellulose content between SW and HW (Fig. 5c). Lignin content did not differ between SW and HW in all social class (Fig. 5d). We found a negative correlation between the extractives content and the cellulose content (R = −0.54; p = 0.002) in SW and HW on dominant, intermediate and suppressed trees growing in Lin (middle taiga subzone).
Figure
5.
Boxplot displaying the carbon concentration (a) and extractives (b), cellulose (c), lignin (d) contents in heartwood (HW) and sapwood (SW) in Scots pine trees depending on the social class (dominant (D.t.), intermediate (I.t.) and suppressed (S.t.) trees) in lingonberry pine forest (middle taiga subzone). Sampling of tissues was at a height of 1.5 m. Significant differences between SW and HW at p < 0.05 are marked by different letters.
ANOSIM was conducted to compare the carbon concentration, extractives and cellulose contents (chemical composition of wood) of pine trees in SW or HW depending on the social class of the tree (Fig. 6). The results showed that chemical composition of wood in pine trees differed depending on SW or HW affiliation (Fig. 6a) and did not differ between dominant (D.t.), intermediate (I.t.) and suppressed (S.t.) ones (Fig. 6b). We assessed the influence of the social class on carbon concentration, extractives and cellulose contents separately in each forest type (Fig. 6). Principal component analysis (PCA) confirmed that SW and HW were divided into separate groups based on chemical composition of wood (Fig. 6c).
Figure
6.
ANOSIM analysis of carbon concentration, extractives and cellulose contents (%) in pine trees (lingonberry pine forests, middle taiga subzone) depending on the sapwood (SW) or heartwood (HW) (a) and under different social class dominant (D.t.), intermediate (I.t.) and suppressed (S.t.) (b). Ordination of 90 model pine trees (c) based on carbon concentration, extractives and cellulose contents (%) in SW and HW at the heights 1.5 m, growing in lingonberry pine forests (middle taiga subzone) with the different social class (D.t., I.t. and S.t.). Factor 1 (52.2% of the variance) was correlated with the cellulose (r = −0.67) and extractives (0.71) contents. Factor 2 (34.0% of the variance) was correlated with the carbon (r = 0.94) concentration. The orange group represents indicators for SW. The brown group represents indicators for HW. (For interpretation of the references to color in this figure legend, the reader is referred to the Web version of this article.)
To assess the heartwood contribution to carbon accumulation in stem wood under different soil conditions and to investigate the relationship between accumulation of extractives in SW and HW and carbon concentration, cores were taken at a height of 1.5 m from the ground from dominant trees. The carbon concentration in HW was 2.2%, 1.9% and 3.4% higher compared to SW in Blu, Lin and Lic, respectively. It should be noted that in Lic, carbon concentration in SW and HW was the highest compared to other forest types (Fig. 7a). We found extractives content in HW exceeded that in SW by 4.2%, 5.0% and 9.6% in Blu, Lin and Lic respectively. The highest content of extractives was inherent in plants from lichen pine forest, where their intensive accumulation in HW was observed. The lowest content of extractives in SW was observed in the lingonberry pine forest (Fig. 7b). We showed that the cellulose content of HW compared to SW was 5.5%, 4.5% and 8.7% lower for blueberry, lingonberry and lichen pine forest, respectively (Fig. 7c). The lignin content did not differ between SW and HW in dominant trees under different soil conditions (Fig. 7d). We found a negative correlation between the carbon concentration and the cellulose content (R = −0.47; p = 0.001) in SW and HW on dominant Scots pine trees growing in Blu, Lin, and Lic (middle taiga subzone).
Figure
7.
Boxplot displaying the carbon (a), extractives (b), cellulose (c) and lignin (d) content in sapwood (SW) and heartwood (HW) in dominant Scots pine trees growing in blueberry (Blu) pine forest, lingonberry pine forest (Lin) and lichen pine forest (Lic) (middle taiga subzone). Sampling of tissues was at a height of 1.5 m. Significant differences between SW and HW at p < 0.05 are marked by different letters.
To compare carbon, extractives and cellulose content in pine trees depending on the SW or HW and under different forest types ANOSIM was performed (Fig. 8). The results showed that chemical composition of wood in pine trees differed depending on SW or HW affiliation (Fig. 8a) and differed slightly between trees from Blu, Lin and Lic (middle taiga subzone) (Fig. 8b). So, SW or HW affiliation had a greater impact on the carbon, extractives and cellulose content comparing with the forest type. Principal component analysis (PCA) confirmed that SW and HW were divided into separate groups based on the chemical composition of wood (Fig. 8c).
Figure
8.
ANOSIM analysis of carbon concentration, extractives and cellulose contents (%) in pine trees (dominant trees, middle taiga subzone) depending on the sapwood (SW) or heartwood (HW) (a) and under different forest types (blueberry (Blu), lingonberry (Lin) and lichen (Lic) pine forests) (b). Ordination of 96 model pine trees (c) based on carbon concentration, extractives and cellulose contents (%) in SW and HW, growing in different forest types (Blu, Lin and Lic pine forests). Factor 1 (48.4% of the variance) was correlated with the carbon concentration (r = 0.61) and cellulose (r = −0.64) content. Factor 2 (29.3% of the variance) was correlated with the extractives content (r = 0.88). The orange group represents indicators for SW. The brown group represents indicators for HW. (For interpretation of the references to color in this figure legend, the reader is referred to the Web version of this article.)
To assess the heartwood contribution to carbon accumulation in stem wood in different climate conditions and to investigate the relationship between accumulation of extractives in SW and HW and carbon concentration, cores were taken at a height of 1.5 m from the ground from dominant trees. The deterioration of climatic conditions was accompanied by an increase in carbon concentration in SW (by 3.8% and 2.7%) and in HW (by 2.0% and 2.1%) in trees from northern taiga subzone and transition area of the northern taiga subzone and tundra, respectively, compared with trees from middle taiga subzone. Probably for this reason, we did not find a difference in carbon concentration between SW and HW in trees growing in more northern regions (Fig. 9a). The increase in these plants in SW carbon concentration was accompanied by an increase in extractive compound content of 1.1%–2.0%, compared with plants from the middle taiga subzone. A difference in extractive compound content between SW and HW in northern pine plants was observed (Fig. 9b). We found that pine trees from the northern taiga subzone and transition area of the northern taiga subzone and tundra had 4.3% and 5.7% lower cellulose content in HW, respectively, compared to SW (Fig. 9c). However, lignin content did not differ (Fig. 9d). We found a positive correlation between the carbon concentration and the extractives content (R = 0.31; p = 0.007) and a negative correlation between the carbon concentration and the cellulose content (R = −0.28; p = 0.03) in SW and HW on trees growing under different climate conditional (MT, NT, and NT/T).
Figure
9.
Boxplot displaying the carbon concentration (a), extractives (b), cellulose (c), lignin (d) contents in heartwood (HW) and sapwood (SW) in dominant Scots pine trees (lingonberry pine forest) in the climate gradient (the middle taiga subzone (MT), northern taiga subzone (NT) and the transition area of the northern taiga subzone and tundra (NT/T)). Sampling of tissues was at a height of 1.5 m. Significant differences between SW and HW at p < 0.05 are marked by different letters.
Then ANOSIM was carried out in a data set on the carbon concentration, extractives and cellulose contents at the height of 1.5 m in dominant Scots pine trees in the gradient of climate conditional (the middle taiga subzone, the northern taiga subzone and the transition area of the northern taiga subzone and tundra). Lignin content was not used for the analysis because it did not differ between the studied variants. In studied climate conditions, significant differences were observed for SW and HW (Fig. 10a). Also, the results showed that chemical composition of wood in pine trees differed in the climate gradient (Fig. 10b). The greatest differences were between trees from the middle taiga subzone and trees from more northern regions (NT and NT/T). Results of principal component analysis (PCA) confirmed that investigated trees were divided into separate groups based on different carbon concentration, extractives and cellulose contents in SW and HW (Fig. 10c) and into two groups in depending on climate conditional (Fig. 10d).
Figure
10.
ANOSIM analysis of carbon concentration, extractives and cellulose contents (%) in pine trees (dominant trees, lingonberry pine forest) depending on the sapwood (SW) or heartwood (HW) (a) and under different climate conditional (the middle taiga subzone (MT), the northern taiga subzone (NT) and the transition area of the northern taiga subzone and tundra (NT/T)) (b). Ordination of 122 model pine trees based on carbon concentration, extractives and cellulose contents in SW and HW, growing in the gradient of climate conditional (MT, NT and NT/T) (c, d). Factor 1 (52.5% of the variance) correlated with the content of extractives (r = 0.63) and the content of cellulose (r = −0.11). Factor 2 (27.7% of the variance) correlated with the carbon concentration (r = 0.87). The orange group represents SW. The brown group represents HW. The red group represents trees from the middle taiga subzone. The green group represents trees from the northern taiga subzone. The blue group represents trees from the transition area of the northern taiga subzone and tundra. (For interpretation of the references to color in this figure legend, the reader is referred to the Web version of this article.)
3.3
Wood carbon content varies with social class, soil condition/forest type, climate conditions
We have attempted to estimate of aboveground trunk wood carbon stock using (ⅰ) the assumption that aboveground biomass consists of 50% C; and (ⅱ) the values of the carbon concentration in SW or HW in different soil conditions and depending on social class determined in this study. To calculate the mass of trunk wood and the mass of heartwood and sapwood in the trunk, the wood density of 0.440 kg·m−3 previously determined for lingonberry and blueberry pine forests in Karelia (
Kazimirov et al., 1977
) was used. The values of wood carbon content, calculated using the standard 50% conversion factor, represent underestimates of 7.7%, 6.9%, and 7.5% for Bly, Lin, and Lic, respectively (Table 3). To be able to compare different sample plots, calculations were carried out up to 7.5 m trunk, which is 48%, 59%, and 65% of the trunk volume for Bly, Lin, and Lic, respectively. The underestimation of wood carbon content on Blu reached 3.5 Mg C·ha−1 and occurred mainly due to intermediate trees (2.8 Mg C·ha−1), accounting for 77% of the total trees content. The underestimation of wood carbon content on Lin reached 2.5 Mg C·ha−1 and occurred due to intermediate trees (1.4 Mg C·ha−1), and dominant trees (0.7 Mg C·ha−1). The underestimation of wood carbon content on Lic reached 2.3 Mg C·ha−1 and occurred mainly due to dominant trees (1.1 Mg C·ha−1), and intermediate trees (0.8 Mg C·ha−1).
We estimated the wood carbon content in different climate conditions for only dominant trees (Table 4). Using a coefficient of 0.5, the values of wood carbon content are underestimated by 4.9%, 10.8% and 9.2% for the middle taiga subzone (MT), the northern taiga subzone (NT) and the transition zone between the northern taiga subzone and the tundra (NT/T), respectively (Table 4). The underestimation of wood carbon content reached 0.8, 3.3, and 0.2 Mg C·ha−1 for MT, NT, and NT/T, respectively. Calculations were carried out up to 10.5 m trunk, which is 66% and 85% of the trunk volume for MT and NT, respectively. For NT/T calculations were carried out up to 9 m trunk (97% of trunk volume). It should be noted that high values of the underestimation of wood carbon content on northern taiga subzone are associated, on the one hand, with a large number of trees (Table 4), and on the other hand, with high carbon concentration in SW and HW (Fig. 9a).
Table
4.
The estimates of wood carbon content in different climate conditions.
Different climatic condition a
m (pats of trunk) up to 9–10 m (kg)
The coefficient using conversion of SW and HW biomass to carbon
Carbon content in trunk up to 9–10 m (kg·tree−1)
Trees per ha
Carbon content (Mg·ha−1)
Errors in forest carbon stock due to 50% assumption (%)
m (SW)
m (HW)
m (trunk)
SW
HW
Data set 1 b
Data set 2 b
Data set 1 b
Data set 2 b
MT
62.8
14.6
77.5
0.522
0.541
40.7
38.7
397
16.14
15.36
4.8
NT
57.6
16.6
74.3
0.56
0.562
41.6
37.1
740
30.82
27.49
10.8
NT/T
24.8
3.1
27.9
0.55
0.56
15.4
14
150
2.31
2.09
9.5
a Different climatic condition are: MT – middle taiga subzone, NT – northern taiga subzone, NT/T – transition area of the northern taiga subzone and tundra. b Data set 1 are: tree biomass was converted to carbon using the coefficient for HW and SW obtained in our studies. Data set 2 are: tree biomass was converted to carbon using a coefficient of 0.5.
An assessment of the value of forest ecosystem services found that 65%–90% of their global value is due to their climate-regulating function (Boston Consulting Group Report, 2020). For Russia, it ranges from 81% to 96%. The distribution and long-term sequestration of carbon in woody biomass is one of its main pools in forest ecosystems (Law et al., 2001; Hoch and Körner, 2011; Kraenzel et al., 2003; Peri et al., 2010; Liu et al., 2016; Mvolo et al., 2021; Cabon et al., 2022). The precise knowledge of the variation in carbon content of living tree biomass is required to accurately quantify forest C stocks, validate forest C accounting models and support forest management strategies intended to maximize CO2 sequestration (Thomas and Martin, 2012; Gao et al., 2016; Zhou et al., 2019). To date, evaluating carbon content (mass of carbon per ha) in forest trees was mostly based on converting the biomass per ha into a carbon content per ha, using the carbon concentration in the biomass according to Kollmann (1959) and the Intergovernmental Panel on Climate Change (IPCC) recommendations (Penman et al., 2003). However, it was shown that the carbon concentration may range from 47% to 59%, as a function of tree compartment or species (Lamlom and Savidge, 2003; Bert and Danjon, 2006), and depends on the HW proportion in the tree trunk, where the carbon concentration significantly exceeds that in SW (Peri et al., 2010, Herrero de Aza et al., 2011). For the first time in the North-West of Russia, we obtained on a large array of data, including different soil conditions, climate and social class, and found that for 80-year-old pine trees the carbon concentration in SW and HW was 52%–55% and 54%–58%, respectively. We studied the relationships between carbon concentration and extractives, cellulose, and lignin contents in HW and SW of pine trees. We have shown that these relationships were ambiguous and varied in different soils, climate conditions, and the position of the tree in the stand (social class). In general, both the HW proportion on tree trunks, and the carbon concentration in SW and HW influence on carbon storage in pine stands.
4.1
Patterns of heartwood formation depending on growing conditions and the position of the tree in the stand
Attempts to evaluate the patterns of HW formation in plants of the genus Pinus L. have been made repeatedly (Wilkes, 1991; Björklund, 1999; Bergstrom, 2003; Climent et al., 2003; Gjerdrum, 2003; Flæte and Høibø, 2009; Pinto et al., 2004; Uusitalo, 2004; Knapic and Pereira, 2005). Björklund (1999), Uusitalo (2004), and Flæte and Høibø (2009) conducted studies of HW formation in P. sylvestris in Norway and Sweden. These studies proposed models that describe the relationship between the number of HW rings and cambial age (number of annual rings). Despite the fact that in the Leningrad region (Forest Plan of the Leningrad Region for 2019–2028) pine forests occupy almost 32% of the forest fund area, in the Arkhangelsk region 27% (Forest plan of the Arkhangelsk Region for 2019–2028), in the Murmansk region 43% (Forest Plan of the Murmansk Region for 2019–2028), and in the Republic of Karelia 65% (Anan'ev and Moshnikov, 2016), such large-scale studies in the North-West of Russia have not been carried out before. We have studied the intensity of the heartwood formation process depending on the tree age and the cambium age within the same tree in North-West Russia (middle taiga subzone) in Scots pine in different forest conditions for the first time (Galibina et al., 2022a, Galibina et al., 2022b; Tarelkina et al., 2022). Based on the large data set, models of the dependence of the number of annual rings in HW on the cambium age were proposed. In this work, we supplemented our data (Dryad, dryad.prr4xgxnw.2022) with a study of the HW proportion depending on the social class trees under different soil conditions (Supplemental Materials Table S2). In this study, we presented new data for the boreal forests of the North-West of Russia about the heartwood formation in Scots pine depending on cambium age within one tree in the gradient of climatic conditions (middle taiga subzone – northern taiga subzone – transition area of the northern taiga subzone and tundra) (Supplemental Materials Table S3).
We found that the deterioration of climatic conditions (transition area of the northern taiga subzone and tundra compared to the middle taiga subzone) was accompanied in dominant trees by a decrease in the HW proportion in the trunk. There is not much data on the influence of climate on the HW proportion in the trunk of trees, while in most cases they compare drier climate types and wet and high-altitude climate types (Climent et al., 2002; Pérez Cordero and Kanninen, 2003; Moreno Chan et al., 2012).
We found that the deterioration of soil conditions was reflected in dominant trees in a decrease in the HW proportion percentage in the trunk. Several works have shown the influence of soil conditions on the HW formation in various species of pines and other woody plants (Miranda et al., 2007; Bektaş et al., 2020; Almeida et al., 2020). Thus, in Scots pine, in more productive forest types, the HW proportion in the trunk was higher compared to less productive forest stands (Splawa-Neyman and Pazdrowskì, 2001; Jakubowski et al., 2015). On the other hand, in pine stand fertilization did not increase the area or number of HW rings in the stem compared to control (Mörling and Valinger, 1999; Pikk et al., 2006).
In blueberry pine forest, we did not find any differences in the HW proportion in the trunk depending on the social class trees. Suppressed trees in lingonberry pine forest, and especially intermediate and suppressed trees in lichen pine forest had the higher HW proportion in the trunk. So, deterioration in growing conditions activated the HW formation in intermediate and suppressed trees. We were unable to find any data about the relationship between HW and SW in pine trees depending on tree position in the stand. Previously, differences in the anatomical parameters of Scots pine wood in trees of different positions in the forest stand have shown by Fabisiak E. and Fabisiak B. (2021), and Pikiński et al. (2021).
So, HW proportion regulation is an important adaptive trait. Several works have concluded that in water-limiting environments pine HW formation is an adaptation mechanism that regulates stem conductance capacity and thus water use in the tree (Rigling et al., 2002; Sterck et al., 2008; Moreno Chan et al., 2012). We showed that the strategies for HW formation under changing conditions differed in plants of different social classes.
4.2
Carbon concentration and wood chemical composition depending on growing conditions
In tree tissues, carbon is bound in organic compounds, mainly cellulose, hemicelluloses, lignin, extractable components and low molecular weight volatile compounds such as alcohols, phenols, terpenoids and aldehyde (Bārdule et al., 2021). We found that lignin content did not differ between SW and HW, while cellulose content in HW was lower by 4.5%–8.7% compared to SW for dominant trees in different soil and climate conditions. A decrease in the proportion of cellulose in HW compared to SW was observed in different pine species (Campbell et al., 2007; Atac and Eroğlu, 2013; Benouadah et al., 2018), Norway spruce (Bertaud and Holmbom, 2004) and other woody plants (Bahmani et al., 2020; Xiao et al., 2020).
Extractives include carbon-rich polymers: aliphatic (waxes, fatty acids, terpenes, triglycerides) and phenolic compounds (simple phenols, stilbenes, lignans, tannins) (Gutiérrez et al., 2009). In general, HW and SW differ in the qualitative composition of extractives. Whereas SW is dominated by resin acids and triglycerides (Saranpää and Höll, 1987; Maga, 1989; Metsämuuronen and Sirén, 2019), HW is dominated by free fatty acids and phenolic compounds, especially lignans and stilbenes (Maga, 1989; Fengel and Wegener, 1989; Metsämuuronen and Sirén, 2019) that make HW resistant to biodegradation. The higher carbon concentration in the HW compared to the SW may be attributed to higher concentrations of lignin (Scheffer, 1966; Bertaud and Holmbom, 2004; Benouadah et al., 2018), resin acids (Bergstrom, 2003), and various kinds of lipophilic and hydrophilic extractives (Bertaud and Holmbom, 2004; Benouadah et al., 2018). We have extracted extractive substances with ethyl alcohol, so waxes, resinous and fatty acids, essential oils, terpenes, triglycerides, simple phenols, stilbenes, lignans, hydrolysable tannins are extracted. We found that in 80-year-old pine trees, regarless of soil conditions, and climate, and social class, extractives content in SW and HW was 2.9%–5.2% and 5.4%–14.2%, respectively.
Based on all the data for the middle taiga subzone, we were unable to establish correlations between the carbon concentration and extractive compound content in SW and HW. The different soil condition and the position of trees in stand had different effects on the carbon concentration in both SW and HW. We have shown that, under conditions of highly productive blueberry pine forest, the carbon concentration of pine trees in HW (55.0%) was higher than in SW (53.5%). The higher carbon concentration in HW was accompanied by more extractives (4.9% versus 9.1% in SW). Poor soil conditions affected the carbon concentration in SW and HW. In low productive lichen pine forest in HW, both carbon (56.5%) and extractives (14.2%) were higher. In the medium productive lingonberry pine forest, the difference in carbon concentration between HW and SW was observed only for dominant trees. We concluded that the tree position in the stand had no effect on HW chemical composition. However, the carbon concentration and extractive content in SW increased in intermediate and suppressed trees.
There are not many works on the influence of soil fertility on the content of extractives in wood, and the effect of soil condition is not obvious. So, Siwale (2015) showed for Scots pine in southern Finland site soil fertility has a significant effect on the concentrations of pinosylvin, its glycoside and one of the neolignans, but the exact effect was not the same for all compounds. Site soil fertility affected the concentration of some phenolic compounds in Scots pine stemwood, but the exact effect was inconsistent. Latva-Mäenpää et al. (2013) compared stilbene glucosides in Norway spruce roots and stumps grown on either peatland or mineral soil sites, observing that the isorhapontin concentration was especially higher in extracts obtained from the mineral soil than in those from peatland. There are more works on studying the effect of fertilizers on wood quality and the content of extractives in it, however, the data provided in them is contradictory (Viiri et al., 2001; Turtola et al., 2002; Kostiainen et al., 2004; Kaakinen et al., 2007). We believe that soil conditions has a greater impact on HW proportion in the trunk and on the different extractives content in SW.
The deterioration of climatic conditions was accompanied by an increase in carbon concentration in SW against the background of an increase in extractive compound content. We found a positive correlation between the carbon concentration and the extractives content (R = 0.31; p = 0.007) and a negative correlation between the carbon concentration and the cellulose content (R = −0.28; p = 0.03) in SW and HW on trees growing under different climate conditional. The fact of an increase in extractives in wood with a deterioration in growing conditions was noted earlier (Walker, 2006; Gutiérrez et al., 2009; Verkasalo et al., 2022). For example, an increase in total extractive contents in coniferous species as one moves north has been observed in northern Europe (Hovelstad et al., 2006; Stolter et al., 2010; Verkasalo et al., 2022), Canada (Royer et al., 2013). It was previously shown that unfavorable environmental conditions in northern Finland, compared with southern Finland, could cause higher lignan production in spruce trees, which might be useful for the trees during occasional periods of environmental stresses, such as when the trees could be under microbial attack (Piispanen et al., 2008). Spruce trees in northern Finland have been observed to contain more than twice as many lignans in their knots than in southern Finland (Holmbom, 2011). Kaakinen et al. (2007) confirmed this by finding that the stemwood of Norway spruce had 54% higher concentrations of extractives in a northern site than in a southern site. Hakkila and Verkasalo (2009) reported higher amounts of acetone extractives in pine and spruce stem heartwood and sapwood in northern Finland than in southern Finland. Hakkila (1968) also found a higher total quantity of extractives in pine and spruce stemwood in northern Finland. Siwale (2015) indicated strongly that the formation of vanillic acid in both young and mature Scots pine stem woods is affected by different climatic conditions due to the geographic location, and concluded that poor conditions favor the formation of vanillic acid. The concentrations of pinosylvin and pinosylvin monomethyl ester were also significantly affected by geographic location, and samples from middle Finland clearly had the lowest concentrations with the means being significantly lower than those in the samples from other locations.
We found that the difference in carbon concentration between SW and HW varied with the cambium age (the height of the core sampling) within the same tree. These differences (2.7%) were highest at 3 m. It was showed for P. pinaster (Bert and Danjon, 2006) that the carbon concentration in HW was about 1%–4% higher than in SW, and this difference depended on the sampling height (Widagdo et al., 2021). We noticed that the literature data on the change in the content of extractive substances from the height of the tree, the selection date, the climatic gradient, the category of the state of the forest stand are few and contradictory (Hillis, 1971; Climent et al., 1998; Verkasalo et al., 2022). Additional studies are required to interpret the result.
4.3
Possible reasons for the underestimation of wood carbon content under different forest site conditions
In general, the HW proportion on tree's trunks, and the carbon concentration in SW and HW influence on carbon storage in pine stands in middle taiga subzone. So, according to our tentative estimate, the underestimation of wood carbon content, when the usual 50% conversion factor was used, represents 3.5, 2.5, and 1.4 Mg C·ha−1 for blueberry lingonberry, and lichen pine forests, respectively.
We estimated, that the underestimation of wood carbon content, with using a coefficient of 0.5, reached 0.8, 3.3, and 0.2 Mg C·ha−1 for middle taiga subzone, northern taiga subzone, and transition area of the northern taiga subzone and tundra respectively. The high underestimation of wood carbon content in the northern taiga subzone (10.8%) is of particular interest. The formation of vegetation cover in Fennoscandia occurred as it was freed from the glacier 12,000 years ago, and subsequently the structure and species composition of natural forests was determined mainly by climate (Yurkovskaya and Elina, 2009). All three study areas are similar in relief and composition of the underlying rocks. Their choice is not accidental – it allows us to model the long-term consequences of climate warming. The average temperature in May is 9.0°С, 4.9°С and 3.7°С; June 17.1°С, 14.4°С and 12.1°С; July 17.4°С, 15.3°С and 14.5°С for the middle taiga subzone (SPs 1, 2, 8, 9), the northern taiga subzone (SP 10) and the transition area of the northern taiga subzone and tundra (SP 12) respectively (Supplemental Materials Fig. S3, according to the resource https://weatherarchive.ru). So, differences between study areas were 2–5°С. In the context of the assessment of projected climate change on carbon storage in pine stands, the continuation of this study is particularly relevant.
We assume that the reason for the increase of extractives in SW and HW may be a decrease and/or temporary inhibition of cambial activity with the deterioration of growth conditions. It is known that cambial activity (tree growth) is typically more sensitive than photosynthesis (carbon assimilation) to a range of environmental conditions, including low water availability, temperature, and nutrient availability (Cabon et al., 2020, 2022). It is known that carbon sink limitations may be important in cold, dry, and late-successional forests (Cabon et al., 2022). Under these conditions, to maintain the donor-acceptor relationship, the processes associated with the synthesis of reserve components begin to predominate, and the participation of secondary exchange reactions also increases. For example, increased concentrations of non-structural carbohydrates (such as starch and sugars) were often observed in colder conditions or during times of drought (Muller et al., 2011; Hoch and Körner, 2011).
So, we found that the contribution of heartwood to carbon accumulation depends on growing conditions: (1) in the series (deterioration of soil condition and social class) Blu(D.t.), Blu(S.t.), Lin(D.t.), Lic(D.t.), Lic(S.t.) carbon concentration in HW higher than in SW by 2.2%, 1.6%, 1.9%, 3.4%, 3.1%; (2) in the series (deterioration of climate conditions) MT(D.t.), NT(D.t.), NT/T(D.t.) carbon concentration increases in SW by 3.8% and 2.7% (52.2%, 56.0%, 55.0%), in HW by 2.1% and 2.0% (54.1%, 56.2%, 56.0%) (Fig. 11).
Figure
11.
Scheme, showing the change of heartwood (HW) proportion and carbon concentration in HW and SW in Scots pine trunks depends on growing conditions.
We focused on the fact that the obtained values for the carbon concentration (52%–60%) were somewhat higher than those available in the literature (45%–53%). Most published stem wood carbon concentration values are based on dried wood samples (for example Herrero de Aza et al., 2011; Peri et al., 2010) and so neglect volatile carbon constituents (Thomas and Martin, 2012). First identified by Lamlom and Savidge (2003), studies had shown that the traditional method of oven-drying wood prior to elemental analysis significantly underestimates observed wood carbon concentration. The volatile carbon fraction (Cvol.) included low molecular weight compounds such as phenolics, alcohols and terpenoids (Lamlom and Savidge, 2003; Thomas and Malczewski, 2007; Martin and Thomas, 2011). The authors showed that the Cvol variation in tropical species is 2.5% ± 0.3%, in temperate/boreal conifers it is 2.1% ± 1.4%, and in temperate/boreal angiosperms it was 1.3% ± 0.6% (Martin and Thomas, 2011). On the example of White spruce (Picea glauca (Moench) Voss) in the Petawawa Research Forest, Ontario, Canada it was shown, that the average freeze-dried carbon in wood was 51.8% ± 1.33% while the average oven-dried carbon was 49.1% ± 0.92%, and the average Cvol was 2.7% ± 1.71% (Mvolo et al., 2021). Increased attention is being paid to freeze-dried carbon as the preferred standard for carbon accounting protocols (Thomas and Martin, 2012; Mvolo et al., 2021).
5.
Conclusions
This study contributes to our understanding of the relationship between HW and carbon storage, which is dependent on growing conditions. Our preliminary estimates suggest that the carbon concentration in pine heartwood may be 3% higher than in sapwood, and this variation is due to carbon conservation in phenolic polymeric components which are abundant in heartwood. The decomposition of a tree's heartwood is a longer process due to the presence of extractives that resist biodegradation. Our research has demonstrated that at 70–80 years of age the proportion of heartwood in the stem biomass is 20%–30% for lingnoberry pine forests and exceeds 50% for blueberry pine forests. An increase in heartwood in the trunk can be attributed to deteriorating growing conditions. According to our data (Galibina et al., 2022a, b), the heartwood area in 180-year-old lingonberry pine forests reaches 50% at a height of up to 10.5 m. We believe that all the above data point to a specific involvement of heartwood (as opposed to sapwood) in long-term carbon sequestration (higher content, longer natural decay time), which has not yet been fully assessed.
CRediT authorship contribution statement
Natalia A. Galibina: Writing – original draft, Visualization, Validation, Supervision, Resources, Project administration, Methodology, Investigation, Funding acquisition, Formal analysis, Data curation, Conceptualization. Kseniya M. Nikerova: Writing – review & editing, Validation, Methodology, Investigation, Formal analysis, Data curation. Sergey A. Moshnikov: Writing – review & editing, Validation, Methodology, Formal analysis, Data curation. Alexander M. Kryshen: Writing – review & editing, Supervision, Investigation, Funding acquisition.
Availability of data and materials
Available on request.
Ethics approval and consent to participate
Not applicable.
Declaration of competing interest
The authors declare the absence of competitive interest.
Acknowledgements
The authors acknowledge researchers of Forest Research Institute KarRC RAS N.V. Afoshin, M.A. Korzhenevkii, I.V. Romashkin and D.V. Teslya for their assistance for conducting cores morphological measurements. The authors appreciate leading chemists of Analytic laboratory Forest Research Institute KarRC RAS A.A. Gologyuk and M.A. Korzhova for wood chemical analysis. The authors thank the Kivach State Nature Reserve and the Pasvik Nature Reserve for assistance in the fieldwork.
Appendix A. Supplementary data
Additional file 1. Fig. S1. Sample-plot location plan (SPs) 1, 2, 8, 9 (middle taiga subzone), SP 10 (northern taiga subzone) and SP 12 (transition area of the northern taiga subzone and tundra)
Additional file 2. Fig. S2. Transition zone identification (see the red arrows) between sapwood (SW) and heartwood (HW). Potassium nitrite (6% aqueous solution) and sulfanilic acid (1% aqueous solution) were used to determine the transition zone between SW and HW. As a result of treatment, SW remains a light-yellow color, and HW is dyed an intense red color (qualitative reaction to pinosylvin in P. sylvestris HW)
Additional file 3. Fig. S3. Average monthly air temperature from April to October (2019–2022) in the study areas (MT – middle taiga subzone, NT – northern taiga subzone, NT/T – transition area of the northern taiga subzone and tundra)
Additional file 4. Table S1 A summary of the sample plots (SP) 1, 2, 8, 9 (middle taiga subzone), SP 10 (northern taiga subzone) and SP 12 (transition area of the northern taiga subzone and tundra)
Additional file 5. Table S2 Morphological indicators of cores taken at different trunk heights from model trees, depending on soil conditions and trees social class.
Additional file 6. Table S3 Morphological indicators of cores taken at different trunk heights from model trees, depending on climate conditions.
Almeida, M.N.F. de, Vidaurre, G.B., Pezzopane, J.E.M., Lousada, J.L.P.C., Silva, M.E.C.M., Câmara, P., Rocha, S.M.G., Oliveira, J.C.L. de, Campoe, O.C., Carneiro, R.L., Alvares, C.A., Tomazzelo-Filho, M., Figueiredo, F. de M. de, Oliveira, R.F., 2020. Heartwood variation of Eucalyptus urophylla is influenced by climatic conditions. For. Ecol. Manag. 458, 117743. .
Anan'ev, V.A., Moshnikov, S.A., 2016. Structure and dynamics of the forest reserves of Republic of Karelia. Lesn. Zhurnal 4 (352), 19–29.
Arisandi, R., Marsoem, S.N., Lukmandaru, G., Ashitani, T., Takahashi, K., 2019. The contents of phenolics and cell wall component of Eucalyptus pellita F. Muell stemwood and bark. Wood Res. 64 (3), 411–422.
Atac, Y., Eroğlu, H., 2013. The effects of heartwood and sapwood on kraft pulp properties of Pinus nigra JF Arnold and Abies bornmuelleriana Mattf. Turk. J. Agric. For. 37 (2), 243–248. .
Bahmani, M., Fathi, L., Koch, G., Kool, F., Aghajani, H., Humar, M., 2020. Heartwood and sapwood features of Sorbus torminalis grown in Iranian forests. Wood Res. 65 (2), 195–204. .
Bamber, R.K., Fukazawa, K., 1985. Sapwood and heartwood: a review. For. Prod. Abstr. 8, 265–278.
Bārdule, A., Liepiņš, J., Liepiņš, K., Stola, J., Butlers, A., Lazdiņš, A., 2021. Variation in carbon content among the major tree species in Hemiboreal Forests in Latvia. Forests 12 (9), 1292. .
Bektaş, İ., Tutuş, A., Gültekin, G., 2020. The effect of sapwood and heartwood differences on mechanical properties of fast-growing tree species. Drv. Ind. 71 (3), 261–269. .
Benouadah, N., Aliouche, D., Pranovich, A., Willför, S., 2018. Chemical characterization of Pinus halepensis sapwood and heartwood. Wood Mater. Sci. Eng. 14 (3), 157–164. .
Bergstrom, B., 2003. Chemical and structural changes during heartwood formation in Pinus sylvestris. Forestry 76 (1), 45–53. .
Bergström, B., Gustafsson, G., Gref, R., Ericsson, A., 1999. Seasonal changes of pinosylvin distribution in the sapwood/heartwood boundary of Pinus sylvestris. Trees (Berl.) 14 (2), 65–71. .
Bert, D., Danjon, F., 2006. Carbon concentration variations in the roots, stem and crown of mature Pinus pinaster (Ait.). For. Ecol. Manag. 222 (1–3), 279–295. .
Bertaud, F., Holmbom, B., 2004. Chemical composition of earlywood and latewood in Norway spruce heartwood, sapwood and transition zone wood. Wood Sci. Technol. 38 (4), 245–256. .
Bieker, D., Rust, S., 2010. Non-destructive estimation of sapwood and heartwood width in Scots pine (Pinus sylvestris L.). Silva Fenn. 44 (2), 267–273. .
Björklund, L., 1999. Identifying heartwood-rich stands or stems of Pinus sylvestris by using inventory data. Silva Fenn. 33 (2), 119–129. .
Brocco, V.F., Paes, J.B., Costa, L.G da, Brazolin, S., Arantes, M.D.C., 2017. Potential of teak heartwood extracts as a natural wood preservative. J. Clean. Prod. 142, 2093–2099. .
Cabon, A., Kannenberg, S.A., Arain, A., Babst, F., Baldocchi, D., Belmecheri, S., Delpierre, N., Guerrieri, R., Maxwell, J.T., McKenzie, S., Meinzer, F.C., Moore, D.J.P., Pappas, C., Rocha, A.V., Szejner, P., Ueyama, M., Ulrich, D., Vincke, C., Voelker, S.L., Wei, J.S., Woodruff, D., Anderegg, W.R.L., 2022. Cross-biome synthesis of source versus sink limits to tree growth. Science 376 (6594), 758–761. .
Cabon, A., Peters, R.L., Fonti, P., Martínez-Vilalta, J., De Cáceres, M., 2020. Temperature and water potential co-limit stem cambial activity along a steep elevational gradient. New Phytol. 226 (5), 1325–1340. .
Campbell, A.G., Kim, W.J., Koch, P., 2007. Chemical variation in lodgepole pine with sapwood/heartwood, stem height, and variety. Wood Fiber Sci. 22, 22–30.
Climent, J., Chambel, M.R., Gil, L., Pardos, J.A., 2003. Vertical heartwood variation patterns and prediction of heartwood volume in Pinus canariensis Sm. For. Ecol. Manag. 174 (1–3), 203–211. .
Climent, J., Chambel, M.R., Pérez, E., Gil, L., Pardos, J., 2002. Relationship between heartwood radius and early radial growth, tree age, and climate in Pinus canariensis. Can. J. For. Res. 32 (1), 103–111. .
Climent, J., Gil, L., Pardos, J.A., 1998. Xylem anatomical traits related to resinous heartwood formation in Pinus canariensis Sm. Trees (Berl.) 12 (3), 139–145. .
Cummins, N.H.O., 1972. Heartwood Differentiation in Pinus Species: a Modified Azo-Dye Test, 2. New Zealand Forest Service, pp. 188–191.
Dalimova, G.N., Burkhanova, N.D., Nikonovich, G.V., 1998. Separation of the lignocellulose of nonwoody plants into its main components and study of their properties. Chem. Nat. Compd. 34 (1), 92–95. .
Daube, W., 1883. Chemische Analysen des Kern- und Splintholzes wichtiger Waldbäume. Forstl. Blätter 20, 177–192.
de Paula Protásio, T., Lima, M.D.R., Teixeira, R.A.C., do Rosário, F.S., de Araújo, A.C.C., de Assis, M.R., Hein, P.R.G., Trugilho, P.F., 2020. Influnce of extractives content and lignin quality of eucalyptus wood in the mass balance of pyrolysis process. BioEnergy Res. 14 (1), 175–189. .
Ekeberg, D., Flæte, P.-O., Eikenes, M., Fongen, M., Naess-Andresen, C.F., 2006. Qualitative and quantitative determination of extractives in heartwood of Scots pine (Pinus sylvestris L.) by gas chromatography. J. Chromatogr. A 1109 (2), 267–272. .
Esteves, B., Nunes, L., Domingos, I., Pereira, H., 2013. Comparison between heat treated sapwood and heartwood from Pinus pinaster. Eur. J. Wood Wood Prod. 72 (1), 53–60. .
Fabisiak, E., Fabisiak, B., 2021. Relationship of tracheid length, annual ring width, and wood density in Scots pine (Pinus sylvestris L.) trees from different social classes of tree position in the stand. Bioresources 16 (4), 7492–7508. .
Fagerstedt, K., Saranpää, P., Piispanen, R., 1998. Peroxidase activity, isoenzymes and histological localisation in sapwood and heartwood of Scots Pine (Pinus sylvestris L.). J. For. Res. 3 (1), 43–47. .
Fengel, D., Wegener, G., 1989. Wood: Chemistry, Ultrastructure, Reactions. Walter de Gruyter, Berlin, New York.
Finnish Forest Research Institute, 2009. Finnish statistical yearbook of forestry. SVT Agriculture, Forestry and Fishery 452. . (Accessed 20 January 2024).
Flæte, P.O., Høibø, O., 2009. Models for predicting vertical profiles of heartwood diameter in mature Scots pine. Can. J. For. Res. 39 (3), 527–536. .
Forest plan of the Arkhangelsk Forest Plan of the Arkhangelsk Region for 2019-2028. . (Accessed 15 May 2022).
Forrester, D.I., Theiveyanathan, S., Collopy, J.J., Marcar, N.E., 2010. Enhanced water use efficiency in a mixed Eucalyptus globulus and Acacia mearnsii plantation. For. Ecol. Manag. 259 (9), 1761–1770. .
Fries, A., Ericsson, T., Gref, R., 2000. High heritability of wood extractives in Pinus sylvestris progeny tests. Can. J. For. Res. 30 (11), 1707–1713. .
Galibina, N.A., Moshnikov, S.A., Nikerova, K.M., Afoshin, N.V., Ershova, M.A., Ivanova, D.S., Kharitonov, V.A., Romashkin, I.V., Semenova, L.I., Serkova, A.A., Tarelkina, T.V., 2022a. Changes in the intensity of heartwood formation in Scots pine (Pinus sylvestris L.) ontogenesis. IAWA 43 (3), 299–321. .
Galibina, N.A., Moshnikov, S.A., Nikerova, K.M., Romashkin, I.V., Afoshin, N.V., Semenova, L.I., Serkova, A.A., Tarelkina, T.V., 2022b. Changes in the intensity of heartwood formation in Scots pine (Pinus sylvestris L.) ontogenesis in three forest types in the middle taiga subzone. Dryad. .
Gao, B., Taylor, A.R., Chen, H.Y.H., Wang, J., 2016. Variation in total and volatile carbon concentration among the major tree species of the boreal forest. For. Ecol. Manag. 375, 191–199. .
Geles, I.S., 2001. Woody Biomass and Backbone Environmentally Friendly Technologies over Chemical-Mechanical Processing. KarNTS RAS, Petrozavodsk.
Ghavidel, A., Hofmann, T., Bak, M., Sandu, I., Vasilache, V., 2020. Comparative archaeometric characterization of recent and historical oak (Quercus spp.) wood. Wood Sci. Technol. 54 (5), 1121–1137. .
Gjerdrum, P., 2003. Heartwood in relation to age and growth rate in Pinus sylvestris L. Scandinavia. Forestry 76 (4), 413–424. .
Gutiérrez, A., del Río, J.C., Martínez, A.T., 2009. Microbial and enzymatic control of pitch in the pulp and paper industry. Appl. Microbiol. Biotechnol. 82 (6), 1005–1018. .
Hakkila, P., Verkasalo, E., 2009. Structure and properties of wood and woody biomass. Structure and properties of wood and woody biomass. In: Kellomäki, S. (Ed.), Forest Resources and Sustainable Management, 2nd Updated Edition., Papermaking Science and Technology, pp. 133–215. Suomen Paperiinsinöörien Yhdistys ry.
Hakkila, P., 1968. Geographical variation of some properties of pine and spruce pulpwood in Finland. Commun. Inst. For. Fenn. 66, 1–59.
Hauch, S., Magel, E., 1998. Extractable activities and protein content of sucrose-phosphate synthase, sucrose synthase and neutral invertase in trunk tissues of Robinia pseudoacacia L. are related to cambial wood production and heartwood formation. Planta 207 (2), 266–274. .
Hazenberg, G., Yang, K.C., 1991. The relationship of tree age with sapwood and heartwood. Width in Black Spruce, Picea mariana (Mill) B.S.P. Holzforschung 45 (5), 317–320. .
Herrero de Aza, C., Turrión, M.B., Pando, V., Bravo, F., 2011. Carbon in heartwood, sapwood and bark along the stem profile in three Mediterranean Pinus species. Ann. For. Sci. 68 (6), 1067–1076. .
Hillis, W.E., 1971. Distribution, properties and formation of some wood extractives. Wood Sci. Technol. 5 (4), 272–289.
Hoch, G., Körner, C., 2011. Global patterns of mobile carbon stores in trees at the high-elevation tree line. Global Ecol. Biogeogr. 21 (8), 861–871. .
Holmbom, B., 2011. Extraction and utilization of non-structural wood and bark components. In: Alén, R. (Ed.), Biorefining of Forest resources. Helsinki, Finland, Paperi Ja Puu Oy, pp. 178–224.
Hovelstad, H., Leirset, I., Oyaas, K., Fiksdahl, A., 2006. Screening analyses of pinosylvin stilbenes, resin acids and lignans in Norwegian conifers. Molecules 11 (1), 103–114. .
IAWA, 1964. Multilingual Glossary of Terms Used in Wood Anatomy, Committee on Nomenclature. Verlagsanstalt Buchdruckerei Konkordia.
Jakubowski, M., Kaluzinski, D., Tomczak, A., Jelonek, T., 2015. Proportion of heartwood and sapwood in Scots pine (Pinus sylvestris L.) stems grown in different site conditions. Ann. Wars Univ. Life Sci.-SGGW. For. Wood Technol. 92, 122–126.
Kaakinen, S., Saranpää, P., Vapaavuori, E., 2007. Effects of growth differences due to geographic location and N-fertilization on wood chemistry of Norway spruce. Trees (Berl.) 21 (2), 131–139. .
Kazimirov, N.I., Volkov, A.D., Zjabchenko, S.S., Ivanchikov, A.A., Morozova, R.M., 1977. Exchange of Substance and Energy in Scotch Pine Forests of the European North. Nauka, Leningrad, p. 303 (in Russian).
Kennedy, S.G., Yanchuk, A.D., Jefferson, P.A., 2013. Relationship of heartwood traits with diameter growth, implications for genetic selection in Pinus radiata. Tree Genet. Genomes 9 (5), 1313–1319. .
Knapic, S., Pereira, H., 2005. Within-tree variation of heartwood and ring width in maritime pine (Pinus pinaster Ait.). For. Ecol. Manag. 210 (1–3), 81–89. .
Kollmann, F., 1959. Tecnología de la madera y sus aplicaciones. Ministerio de Agricultura, IFIE, Madrid.
Kostiainen, K., Kaakinen, S., Saranpää, P., Sigurdsson, B.D., Linder, S., Vapaavuori, E., 2004. Effect of elevated [CO2] on stem wood properties of mature Norway spruce grown at different soil nutrient availability. Global Change Biol. 10 (9), 1526–1538. .
Kraenzel, M., Castillo, A., Moore, T., Potvin, C., 2003. Carbon storage of harvest-age teak (Tectona grandis) plantations, Panama. For. Ecol. Manag. 173 (1–3), 213–225. .
Krutul, D., Radomski, A., Antczak, A., Drożdżek, M., Kłosińska, T., Szadkowska, D., Zawadzki, J., 2021. Influence of the environmental pollution on the distribution and polymerization degree of cellulose in bark and wood from Scots pine (Pinus sylvestris L.) stem. Wood Res. 66 (2), 203–210. .
Krylov, G.V., 1961. Forests of western Siberia. History of Study, Types of Forests, Zoning, Ways of Use and Improvement. Publishing House of the Academy of Sciences of the USSR, Moscow.
Kürschner, K., Hoffer, A., 1929. Ein neues verfahren zur bestimmung der cellulose in hölzern und zellstoffen. Tech Chem Pap Zellst Fabr 26, 125–129.
Lamlom, S.H., Savidge, R.A., 2003. A reassessment of carbon content in wood: variation within and between 41 North American species. Biomass Bioenergy 25 (4), 381–388. .
Lamlom, S.H., Savidge, R.A., 2006. Carbon content variation in boles of mature sugar maple and giant sequoia. Tree Physiol. 26 (4), 459–468. .
Latva-Mäenpää, H., Laakso, T., Sarjala, T., Wähälä, K., Saranpää, P., 2013. Variation of stilbene glucosides in bark extracts obtained from roots and stumps of Norway spruce (Picea abies [L.] Karst. Trees (Berl.) 27 (1), 131–139. .
Law, B.E., Thornton, P.E., Irvine, J., Anthoni, P.M., Van Tuyl, S., 2001. Carbon storage and fluxes in ponderosa pine forests at different developmental stages. Global Change Biol. 7 (7), 755–777. .
Lerceteau, E., Plomion, C., Andersson, B., 2000. AFLP mapping and detection of quantitative trait loci (QTLs) for economically important traits in Pinus sylvestris: a preliminary study. Mol. Breed. 6 (5), 451–458. .
Lim, K.-J., Paasela, T., Harju, A., Venäläinen, M., Paulin, L., Auvinen, P., Kärkkäinen, K., Teeri, T.H., 2016. Developmental changes in Scots pine transcriptome during heartwood formation. Plant Physiol. 172 (3), 1403–1417. .
Liu, C., Liu, Y., Guo, K., Wang, S., Liu, H., Zhao, H., Qiao, X., Hou, D., Li, S., 2016. Aboveground carbon stock, allocation and sequestration potential during vegetation recovery in the karst region of southwestern China: a case study at a watershed scale. Agric. Ecosyst. Environ. 235, 91–100. .
Macfarlane, C., Bond, C., White, D.A., Grigg, A.H., Ogden, G.N., Silberstein, R., 2010. Transpiration and hydraulic traits of old and regrowth eucalypt forest in southwestern Australia. For. Ecol. Manag. 260 (1), 96–105. .
Mackay, D.M., Roberts, P.V., 1982. The dependence of char and carbon yield on lignocellulosic precursor composition. Carbon 20 (2), 87–94. .
Maga, J.A., 1989. The contribution of wood to the flavor of alcoholic beverages. Food Rev. Int. 5 (1), 39–99. .
Magel, E., Einig, W., Hampp, R., 2000. Carbohydrates in trees. Carbohydrate Reserves in Plants - Synthesis and Regulation, 317–336. .
Martin, A.R., Thomas, S.C., 2011. A reassessment of carbon content in tropical trees. PLoS One 6 (8), e23533. .
Melson, S.L., Harmon, M.E., Fried, J.S., Domingo, J.B., 2011. Estimates of live-tree carbon stores in the Pacific Northwest are sensitive to model selection. Carbon Bal. Manag. 6, 1–16. .
Metsämuuronen, S., Sirén, H., 2019. Bioactive phenolic compounds, metabolism and properties: a review on valuable chemical compounds in Scots pine and Norway spruce. Phytochemistry Rev. 18 (3), 623–664. .
Miranda, I., Gominho, J., Lourenço, A., Pereira, H., 2007. Heartwood, extractives and pulp yield of three Eucalyptus globulus clones grown in two sites. Appita J. 60, 485–488.
Moreno Chan, J., Raymond, C.A., Walker, J.C.F., 2012. Development of heartwood in response to water stress for radiata pine in Southern New South Wales, Australia. Trees (Berl.) 27 (3), 607–617. .
Mörling, T., Valinger, E., 1999. Effects of fertilization and thinning on heartwood area, sapwood area and growth in Scots pine. Scand. J. For. Res. 14 (5), 462–469. .
Muller, B., Pantin, F., Génard, M., Turc, O., Freixes, S., Piques, M., Gibon, Y., 2011. Water deficits uncouple growth from photosynthesis, increase C content, and modify the relationships between C and growth in sink organs. J. Exp. Bot. 62 (6), 1715–1729. .
Mvolo, C.S., Stewart, J.D., Helmeste, C., Koubaa, A., 2021. Variation of white spruce carbon content with age, height, social classes and silvicultural management. Energies 14 (23), 8015. .
Myneni, R.B., Dong, J., Tucker, C.J., Kaufmann, R.K., Kauppi, P.E., Liski, J., Zhou, L., Alexeyev, V., Hughes, M.K., 2001. A large carbon sink in the woody biomass of Northern forests. Proc. Natl. Acad. Sci. USA 98 (26), 14784–14789. .
Nawrot, M., Pazdrowski, W., Szymański, M., 2008. Dynamics of heartwood formation and axial and radial distribution of sapwood and heartwood in stems of European larch (Larix decidua Mill.). J. For. 54 (9), 409–417. .
Pang, C.H., Lester, E., Wu, T., 2018. Influence of lignocellulose and plant cell walls on biomass char morphology and combustion reactivity. Biomass Bioenergy 119, 480–491. .
Penman, J., Gytarsky, M., Hiraishi, T., Krug, T., Kruger, D., Pipatti, R., Buendia, L., Miwa, K., Ngara, T., Tanabe, K., Wagner, F., 2003. Good Practice Guidance for Land Use, Land-Use Change and Forestry.
Pérez Cordero, L., Kanninen, M., 2003. Heartwood, sapwood and bark content, and wood dry density of young and mature teak (Tectona grandis) trees grown in Costa Rica. Silva Fenn. 37 (1), 45–54. .
Peri, P.L., Gargaglione, V., Martínez Pastur, G., Lencinas, M.V., 2010. Carbon accumulation along a stand development sequence of Nothofagus antarctica forests across a gradient in site quality in Southern Patagonia. For. Ecol. Manag. 260 (2), 229–237. .
Pfautsch, S., Keitel, C., Turnbull, T.L., Braimbridge, M.J., Wright, T.E., Simpson, R.R., et al., 2011. Diurnal patterns of water use in Eucalyptus victrix indicate pronounced desiccation–rehydration cycles despite unlimited water supply. Tree Physiol. 31 (10), 1041–1051. .
Pfautsch, S., Macfarlane, C., Ebdon, N., Meder, R., 2012. Assessing sapwood depth and wood properties in Eucalyptus and Corymbia spp. using visual methods and near infrared spectroscopy (NIR). Trees (Berl.) 26, 963–974. .
Piispanen, R., Willför, S., Saranpää, P., Holmbom, B., 2008. Variation of lignans in Norway spruce (Picea abies [L.] Karst.) knotwood: within-stem variation and the effect of fertilisation at two experimental sites in Finland. Trees Struct. Funct. 22 (3), 317–328. .
Pikiński, P.M., Szaban, J., Šilingienė, G., Korzeniewicz, R., Pazdrowski, W., 2021. Selected physical and mechanical properties of Scots pine (Pinus sylvestris L.) wood from stands of younger age classes as criteria for rational utilization of timber. Balt. For. 27 (1), 363–370. .
Pikk, J., Kask, R., Peterson, P., 2006. The wood quality of fertilized Scots pine (Pinus sylvestris L.) stands on Vaccinium vitis-idaea and Cladonia site type. Metsanduslikud Uurim. 44, 9–19.
Pinto, I., Pereira, H., Usenius, A., 2004. Heartwood and sapwood development within maritime pine (Pinus pinaster Ait.) stems. Trees Struct. Funct. 18 (3), 284–294. .
Rigling, A., Bräker, O., Schneiter, G., Schweingruber, F., 2002. Intra-annual tree-ring parameters indicating differences in drought stress of Pinus sylvestris forests within the Erico-Pinion in the Valais (Switzerland). Plant Ecol. 163 (1), 105–121. .
Roach, M., Arrivault, S., Mahboubi, A., Krohn, N., Sulpice, R., Stitt, M., Niittylä, T., 2018. Corrigendum, Spatially resolved metabolic analysis reveals a central role for transcriptional control in carbon allocation to wood. J. Exp. Bot. 69 (16), 4143–4144. .
Rodrigue, S.-T., Sébastien, N.O., Nicolas, B., Patrice, S., Timoléon, A.B., 2016. Investigating the potential of Aucoumea klaineana Pierre sapwood and heartwood wastes to produce cellulosic ethanol. Afr. J. Biotechnol. 15 (46), 2587–2595. .
Saitoh, T., Ohtani, J., Fukazawa, K., 1993. The occurrence and morphology of tyloses and gums in the vessels of Japanese hardwoods. IAWA 14 (4), 359–371. .
Saner, P., Loh, Y.Y., Ong, R.C., Hector, A., 2012. Carbon stocks and fluxes in tropical lowland dipterocarp rainforests in sabah, Malaysian borneo. PLoS One 7 (1), e29642. .
Sannikov, S.N., 1992. Ecology and Geography of Natural Regeneration of Scots Pine Russian Academy of Sciences, Ural Branch, Forest Institute. Nauka, Moscow.
Saranpää, P., Höll, W., 1987. Steryl glycosides and acylated steryl glycosides of Pinus sylvestris L. sapwood and heartwood. Trees (Berl.) 1 (4), 215–218. .
Saranpää, P., Höll, W., 1989. Soluble carbohydrates of Pinus sylvestris L. sapwood and heartwood. Trees (Berl.) 3 (3), 138–143. .
Scheffer, T.C., 1966. Natural resistance of wood to microbial deterioration. Annu. Rev. Phytopathol. 4 (1), 147–168. .
Sellin, A., 1996. Sapwood amount in Picea abies (L.) karst. Determined by tree age and radial growth rate. Hfsg 50 (4), 291–296. .
Siwale, W., 2015. Phenolic compounds in stem wood of Scots pine (Pinus sylvestris L.) grown in different north-south locations in Finland. Department of Biology/School of Forest Science. Master’s thesis in wood material science 45.
Spicer, R., 2005. Senescence in secondary xylem. Vascular Transport in Plants 457-475. .
Splawa-Neyman, S., Pazdrowskì, W., 2001. Effect of site fertility upon formation of heartwood in timber of Scots pine [Pinus sylvestris L.]. Folia For Polonica Ser B-Drzew 32, 83–87.
State Report on the Environment in Republic of Karelia in 2021, 2022. The Ministry of Environmental Protection of Republic of Karelia. Petrozavodsk.
Sterck, F.J., Zweifel, R., Sass-Klaassen, U., Chowdhury, Q., 2008. Persisting soil drought reduces leaf specific conductivity in Scots pine (Pinus sylvestris) and pubescent oak (Quercus pubescens). Tree Physiol. 28 (4), 529–536. .
Stolter, C., Ball, J.P., Niemelä, P., Julkunen-Tiitto, R., 2010. Herbivores and variation in the composition of specific phenolics of boreal coniferous trees: a search for patterns. Chemoecology 20 (4), 229–242. .
TAPPI (T222 om-11), 2011. Acid-insoluble Lignin in Wood and Pulp. TAPPI Press, Atlanta.
TAPPI, 1992. Preparation of wood for chemical analysis. T-264 om-88. TAPPI Test Methods. TAPPI Press, Atlanta.
Tarelkina, T.V., Galibina, N.A., Moshnikov, S.A., Nikerova, K.M., Moshkina, E.V., Genikova, N.V., 2022. Anatomical and morphological features of Scots pine heartwood formation in two forest types in the middle taiga subzone. Forests 13 (1), 91. .
Telmo, C., Lousada, J., 2011. The explained variation by lignin and extractive contents on higher heating value of wood. Biomass Bioenergy 35 (5), 1663–1667. .
Thomas, S.C., Malczewski, G., 2007. Wood carbon content of tree species in Eastern China: interspecific variability and the importance of the volatile fraction. J. Environ. Manag. 85 (3), 659–662. .
Thomas, S.C., Martin, A.R., 2012. Carbon content of tree tissues: a synthesis. Forests 3 (2), 332–352. .
Turtola, S., Manninen, A.-M., Holopainen, J.K., Levula, T., Raitio, H., Kainulainen, P., 2002. Secondary metabolite concentrations and terpene emissions of Scots pine xylem after long-term forest fertilization. J. Environ. Qual. 31 (5), 1694–1701. .
Ugolev, B.N., 1975. Wood Science with the Basics of Forest Commodity Science. Forestry industry, Moscow.
Uusitalo, J., 2004. Heartwood and extractive content of Scots pine in southern Finland: models to apply at harvest. Wood Fiber Sci. 36, 3–8.
Verkasalo, E., Roitto, M., Möttönen, V., Tanner, J., Kumar, A., Kilpeläinen, P., Sikanen, L., Ilvesniemi, H., 2022. Extractives of tree biomass of Scots pine (Pinus sylvestris L.) for biorefining in four climatic regions in Finland – lipophilic compounds, stilbenes, and lignans. Forests 13 (5), 779. .
Viiri, H., Annila, E., Kitunen, V., Niemelä, P., 2001. Induced responses in stilbenes and terpenes in fertilized Norway spruce after inoculation with blue-stain fungus, Ceratocystis polonica. Trees (Berl.) 15 (2), 112–122. .
Vos, M.A.E., de Boer, D., de Vries, W., den Ouden, J., Sterck, F.J., 2023. Aboveground carbon and nutrient distributions are hardly associated with canopy position for trees in temperate forests on poor and acidified sandy soils. For. Ecol. Manag. 529, 120731. .
Wang, L., Li, X.-R., Lian, H., Ni, D.-A., He, Y., Chen, X.-Y., Ruan, Y.-L., 2010. Evidence that high activity of vacuolar invertase is required for cotton fiber and arabidopsis root elongation through osmotic dependent and independent pathways. Respectively. Plant Physiol. 154 (2), 744–756. .
Warlo, H., Windeisen-Holzhauser, E., Brüchert, F., Sauter, U.H., Richter, K., 2023. Extractives in Douglas firs (Pseudotsuga menziesii (Mirb.) Franco) from three sites in south-west Germany and potential opportunities for valorization. Eur. J. Wood Wood Prod. 1-16. .
Widagdo, F.R.A., Dong, L., Li, F., 2021. Biomass functions and carbon content variabilities of natural and planted Pinus koraiensis in northeast China. Plants 10 (2), 201. .
Wilkes, J., 1991. Heartwood development and its relationship to growth in Pinus radiata. Wood Sci. Technol. 25 (2), 85–90. .
Xiao, M.-Z., Chen, W.-J., Cao, X.-F., Chen, Y.-Y., Zhao, B.-C., Jiang, Z.-H., Yuan, T.-Q., Sun, R.-C., 2020. Unmasking the heterogeneity of carbohydrates in heartwood, sapwood, and bark of Eucalyptus. Carbohydr. Polym. 238, 116212. .
Yurkovskaya, T.K., Elina, G.A., 2009. Restored Vegetation of Karelia on Geobotanical and Paleo Maps. Petrozavodsk.
Zawieja, B., Turczański, K., Najgrakowski, T., Kaźmierczak, K., 2021. The use of measurable traits of trunk and crown to assess the biosocial classes of oak trees, Quercus robur L.. Baltic Forest 27 (1), 542. .
Zhou, L., Li, S., Liu, B., Wu, P., Heal, K.V., Ma, X., 2019. Tissue-specific carbon concentration, carbon stock, and distribution in Cunninghamia lanceolata (Lamb.) Hook plantations at various developmental stages in subtropical China. Ann. For. Sci. 76 (3). .
Table
1.
Characterization of model trees on SPs 1, 2, 8, 9 (middle taiga subzone), SP 10 (northern taiga subzone) and SP 12 (transition area of the northern taiga subzone and tundra).
Forest typea (sample plot name)
Age (years)
Dominant trees
Intermediate trees
Suppressed trees
Number trees
DBH (cm)
Height (m)
Number trees
DBH (cm)
Height (m)
Number trees
DBH (cm)
Height (m)
Lic (8)
70
5
23.3 ± 2.2
14.2 ± 1.5
5
16.2 ± 0.5
12.7 ± 0.8
3
10.0 ± 0.7
9.8 ± 0.7
Lin (1)
80
4
21.1 ± 1.5
19.6 ± 0.9
3
13.5 ± 0.2
16.9 ± 0.6
3
9.4 ± 0.3
14.2 ± 0.6
Lin (9)
70
3
20.7 ± 1.9
21.8 ± 1.1
3
15.8 ± 1.1
19.8 ± 2.1
3
10.2 ± 1.1
14.5 ± 1.0
Blu (2)
80
5
32.4 ± 2.2
26.5 ± 1.2
3
23.4 ± 1.0
25.0 ± 1.1
3
16.7 ± 0.7
21.9 ± 2.0
Lin (10)
80
5
18.4 ± 2.0
15.5 ± 1.7
–
–
–
–
–
–
Lin (12)
80
5
12.6 ± 2.0
10.0 ± 0.4
–
–
–
–
–
a Forest types are: Lic – lichen pine forest, Lin – lingonberry pine forest, Blu – blueberry pine forest.
Table
2.
Summary of the research experiment design and analysis of selected plant materials.
Factors
Core sampling from model trees at trunk heights (m)
Morphological studies (determination the HW proportion at trunk heights)
Biochemical research (at trunk heights 1.5 m)
The influence of climatic factorsa
The influence of soil conditions (forest typeb)
The influence of the position of the tree in the stand (social class
c
)
The C concentration (%)
Extractives content (%)
Cellulose content (%)
Lignin content (%)
MT
Blu
D.t.
0.3, 1.5, 4.5, 7.5, 10.5
+
+
+
+
+
I.t.
0.3, 1.5, 4.5, 7.5, 10.5, 13.5
+
S.t.
0.3, 1.5, 4.5, 7.5, 10.5
+
Lin
D.t.
0.3, 1.5, 4.5, 7.5, 10.5
+
+
+
+
+
I.t.
0.3, 1.5, 3, 4.5, 6, 7.5, 10.5
+
+
+
+
+
S.t.
0.3, 1.5, 3, 4.5, 6, 7.5, 9, 10.5, 13
+
+
+
+
+
Lic
D.t.
0.3, 1.5, 4.5, 5.5, 6.5, 7.5, 8.5
+
+
+
+
+
I.t.
0.3, 1.5, 3.0, 4.5
+
S.t.
0.3, 1.5, 3.0, 4.5, 6,5, 8.5
+
NT
Lin
D.t.
0.3, 1.5, 4.5, 7.5, 10.5
+
+
+
+
+
NT/T
Lin
D.t.
0.3, 1.5, 4.5, 7.5, 9 and 1, 2, 3, 4, 5, 6, 7, 8
+
+
+
+
+
a Different climatic condition are: MT – middle taiga subzone, NT – northern taiga subzone, NT/T – transition area of the northern taiga subzone and tundra. b Forest types are: Blu – blueberry pine forest, Lin – lingonberry pine forest, Lic – lichen pine forest. c Social class are: D.t. – dominant trees, I.t. – intermediate trees, S.t. – suppressed trees.
Table
3.
The estimates of wood carbon content in different forest types.
Forest type/social classa
m (pats of trunk) up to 7.5 m (kg)
The coefficient for conversion of SW and HW biomass to carbon
Carbon content in trunk up to 7.5 m (kg·tree−1)
Trees per ha
Carbon content, (Mg·ha−1)
Errors in forest carbon stock due to 50% assumption (%)
m (SW)
m (HW)
m (trunk)
SW
HW
Data set 1b
Data set 2b
Data set 1b
Data set 2b
Blueberry pine forest
45.59
42.09
7.7
D.t.
100.2
88.6
188.8
0.530
0.551
101.9
94.4
65
6.62
6.14
I.t.
60.1
45.7
105.8
0.540
0.545
57.3
52.9
625
35.81
33.05
S.t.
27.5
18.9
46.5
0.537
0.553
25.3
23.2
125
3.16
2.90
Lingonberry pine forest
35.60
33.14
6.9
D.t.
52.0
12.5
64.5
0.522
0.541
33.9
32.3
397
13.45
12.79
I.t.
32.5
9.4
41.9
0.546
0.550
22.9
21.0
693
15.88
14.52
S.t.
10.5
4.5
15.0
0.536
0.543
8.1
7.5
779
6.27
5.83
Lichen pine forest
30.45
28.17
4.8
D.t.
72.8
6.4
79.2
0.530
0.551
42.5
39.6
383
16.28
15.18
I.t.
25.4
3.7
29.0
0.540
0.545
16.0
14.5
525
8.42
7.63
S.t.
10.5
4.5
15.0
0.533
0.563
7.5
7.0
767
5.75
5.37
a Social class are: D.t. – dominant trees, I.t. – intermediate trees, S.t. – suppressed trees. b Data set 1 are: tree biomass was converted to carbon using the coefficient for HW and SW obtained in our studies. Data set 2 are: tree biomass was converted to carbon using a coefficient of 0.5.
Table
4.
The estimates of wood carbon content in different climate conditions.
Different climatic condition a
m (pats of trunk) up to 9–10 m (kg)
The coefficient using conversion of SW and HW biomass to carbon
Carbon content in trunk up to 9–10 m (kg·tree−1)
Trees per ha
Carbon content (Mg·ha−1)
Errors in forest carbon stock due to 50% assumption (%)
m (SW)
m (HW)
m (trunk)
SW
HW
Data set 1 b
Data set 2 b
Data set 1 b
Data set 2 b
MT
62.8
14.6
77.5
0.522
0.541
40.7
38.7
397
16.14
15.36
4.8
NT
57.6
16.6
74.3
0.56
0.562
41.6
37.1
740
30.82
27.49
10.8
NT/T
24.8
3.1
27.9
0.55
0.56
15.4
14
150
2.31
2.09
9.5
a Different climatic condition are: MT – middle taiga subzone, NT – northern taiga subzone, NT/T – transition area of the northern taiga subzone and tundra. b Data set 1 are: tree biomass was converted to carbon using the coefficient for HW and SW obtained in our studies. Data set 2 are: tree biomass was converted to carbon using a coefficient of 0.5.

 DownLoad:
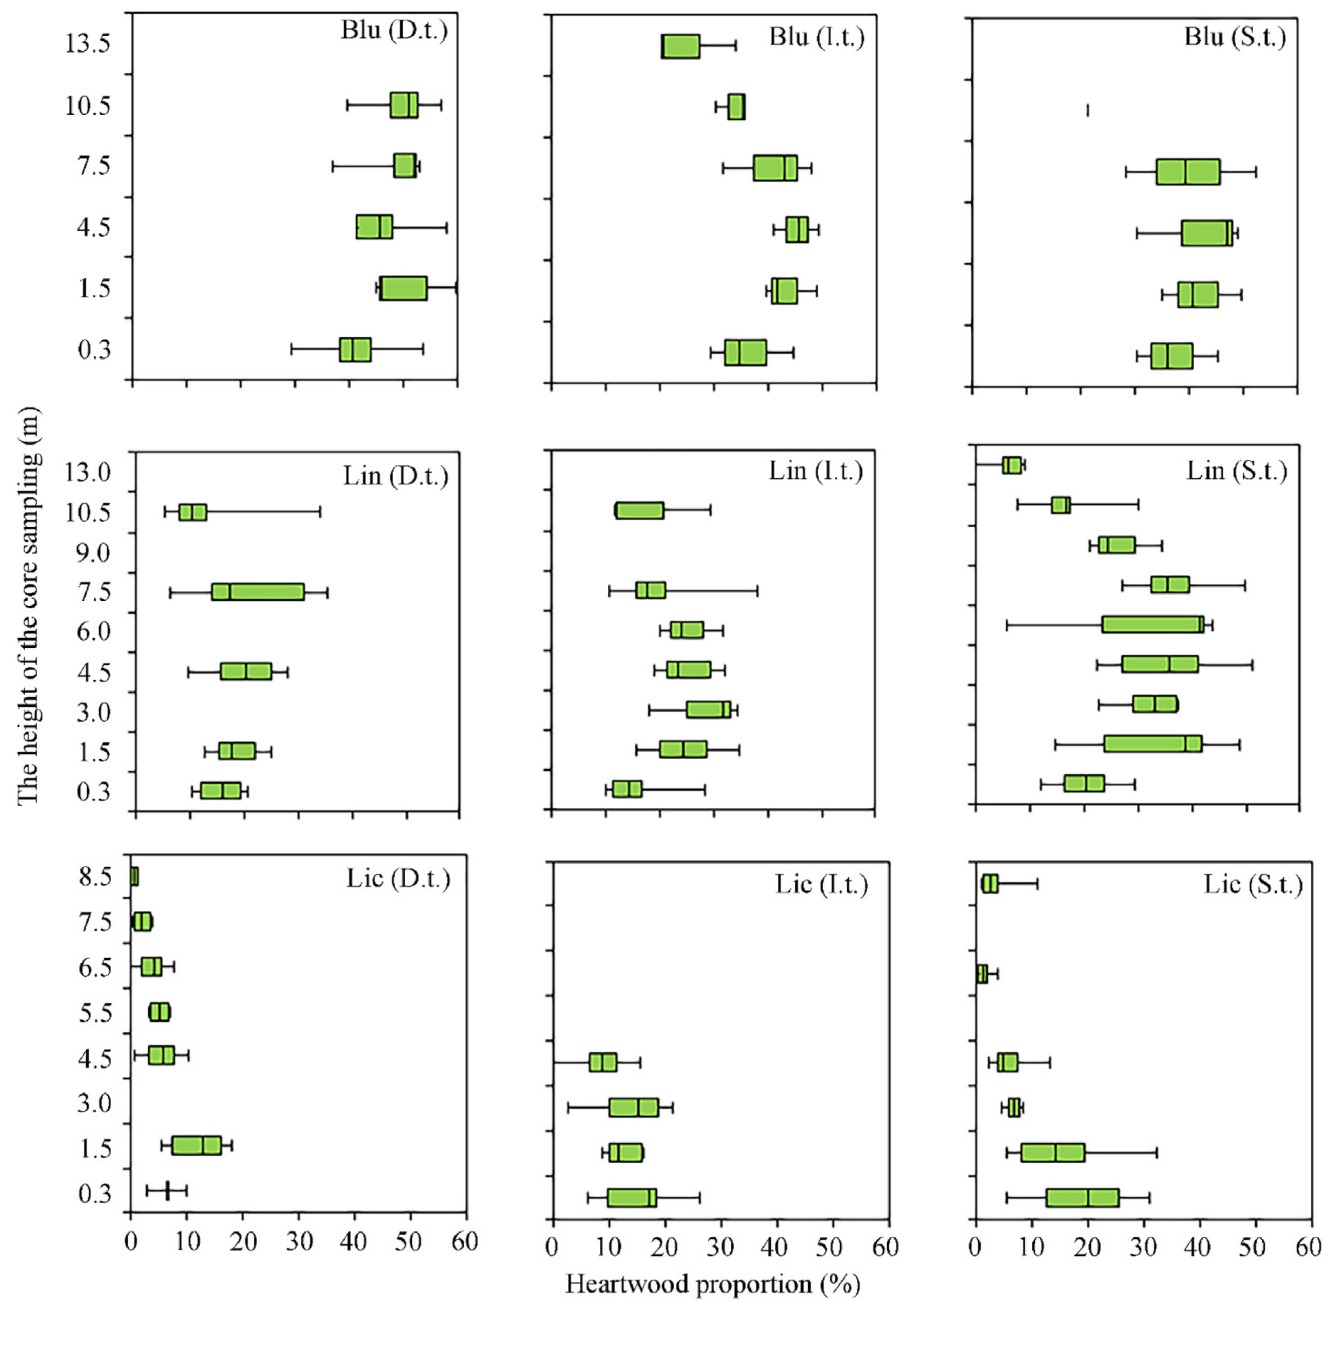
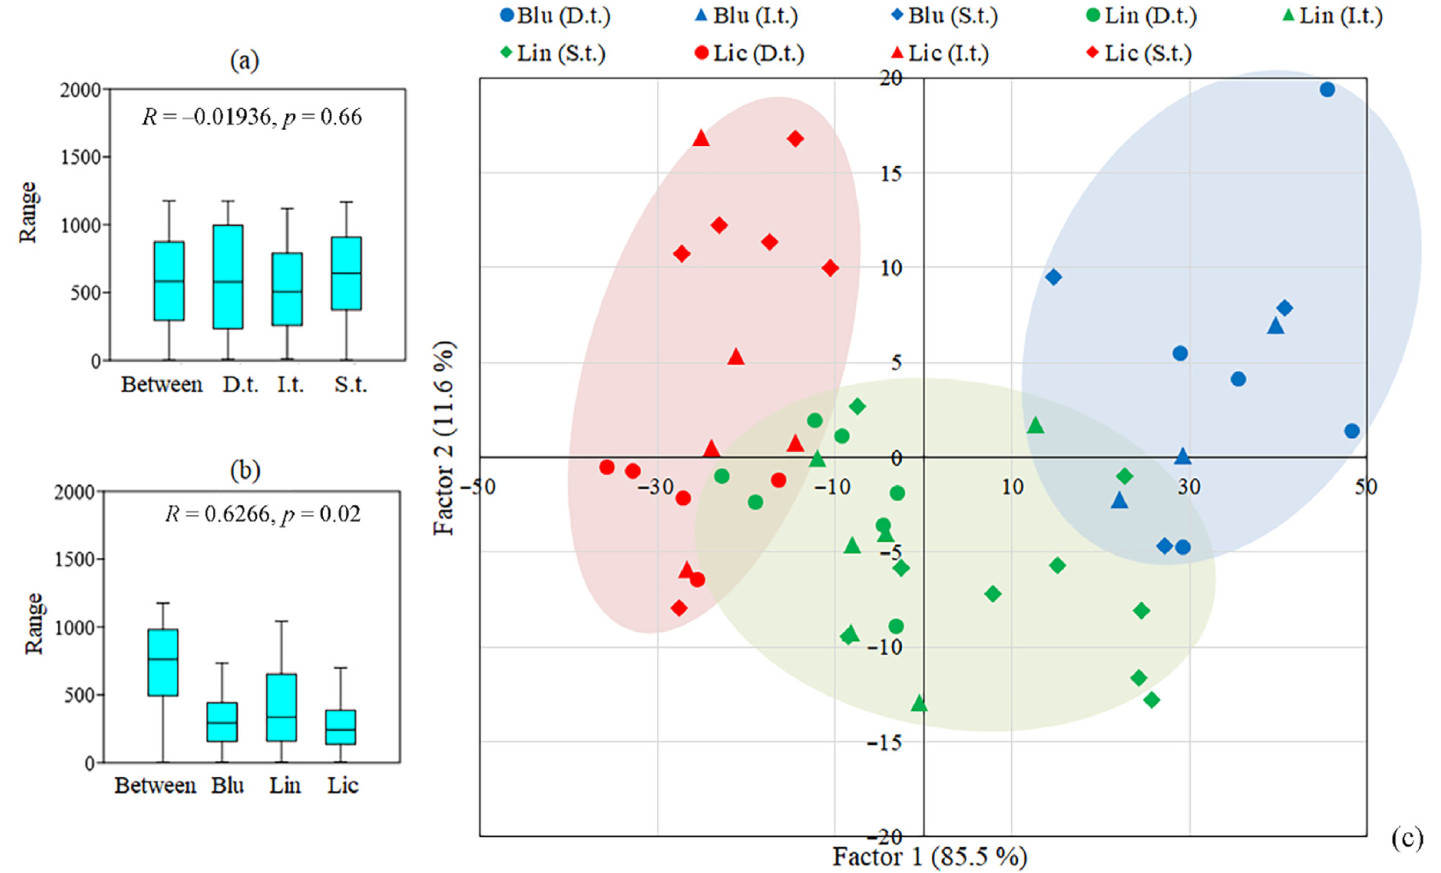
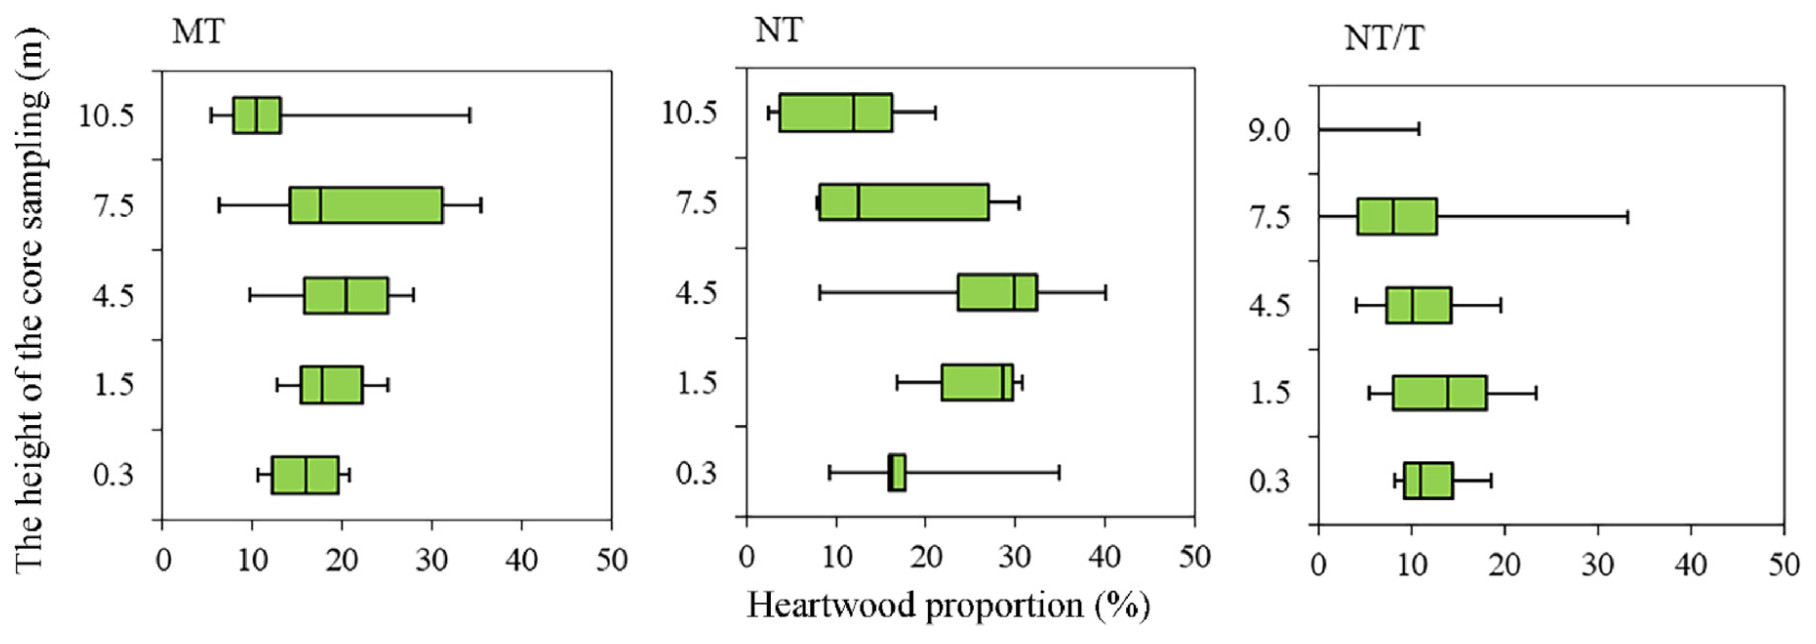
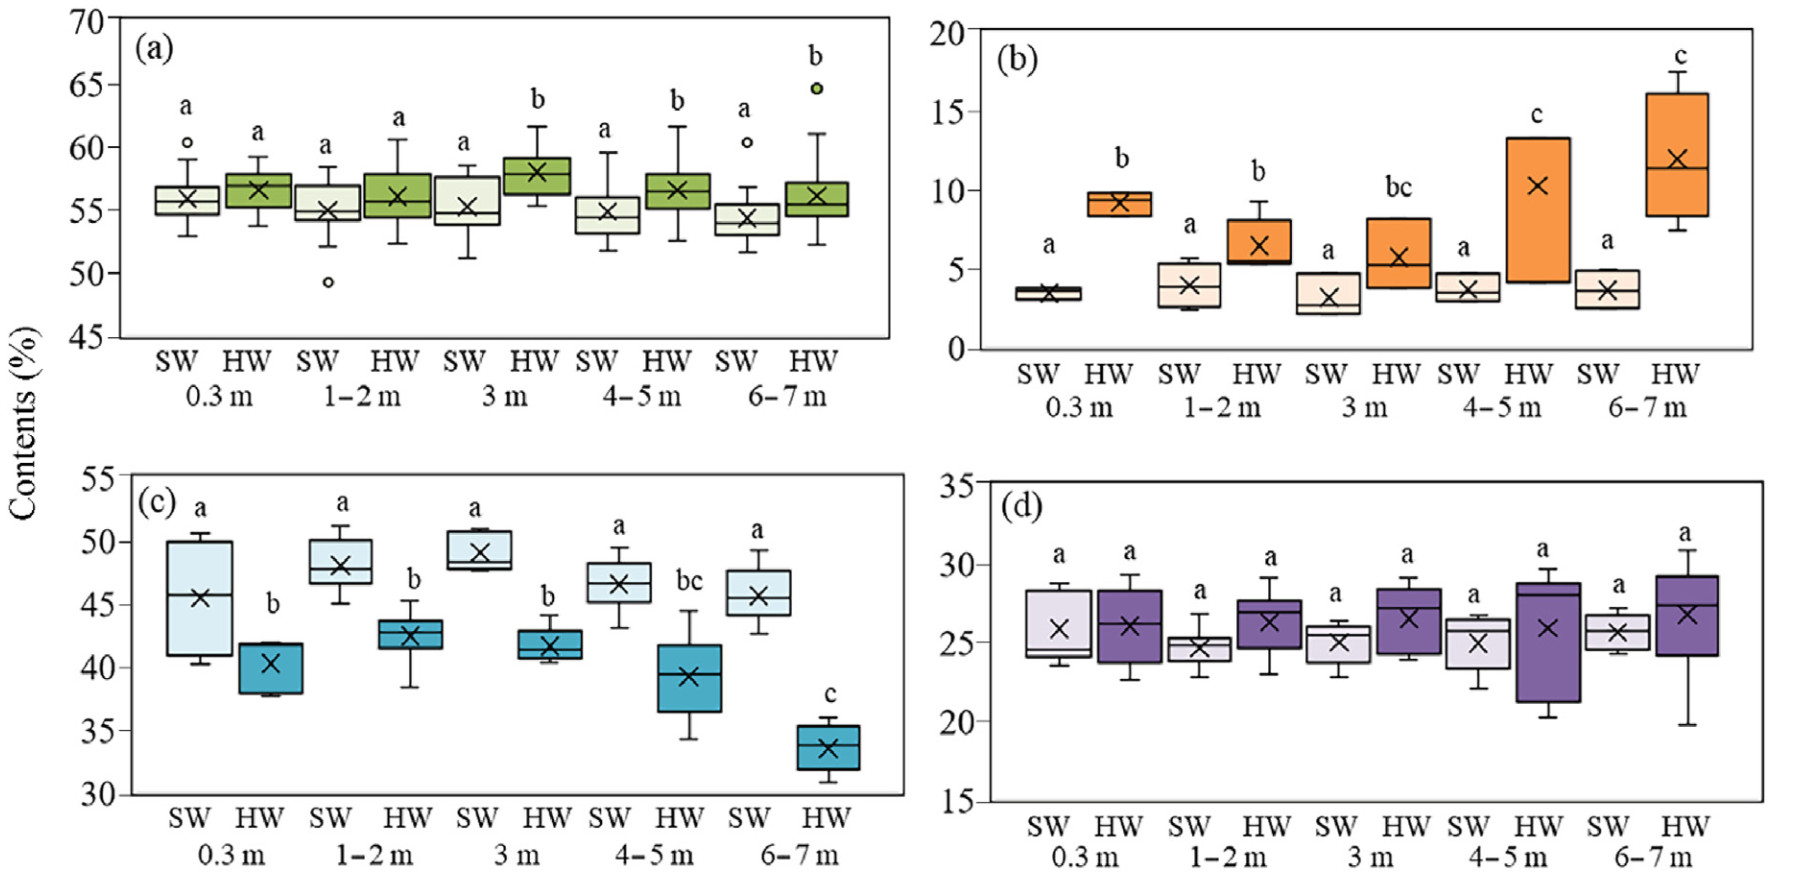
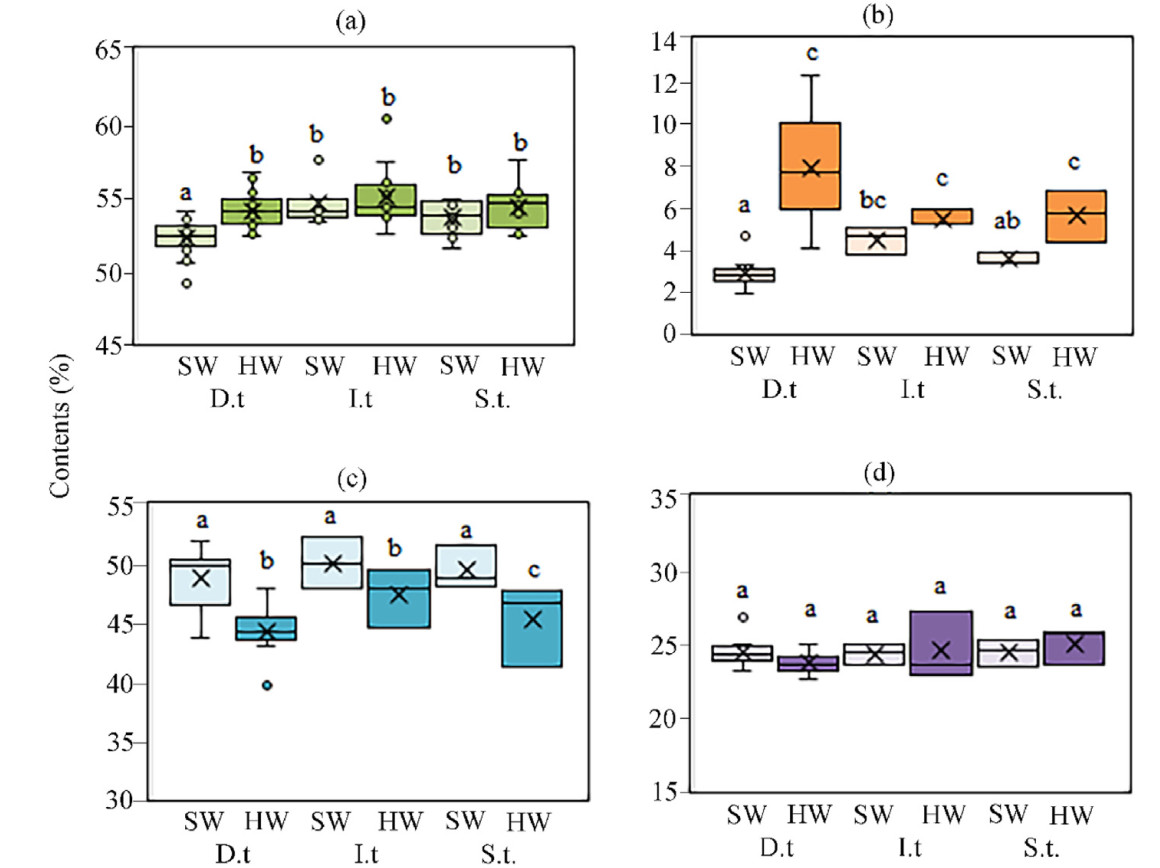
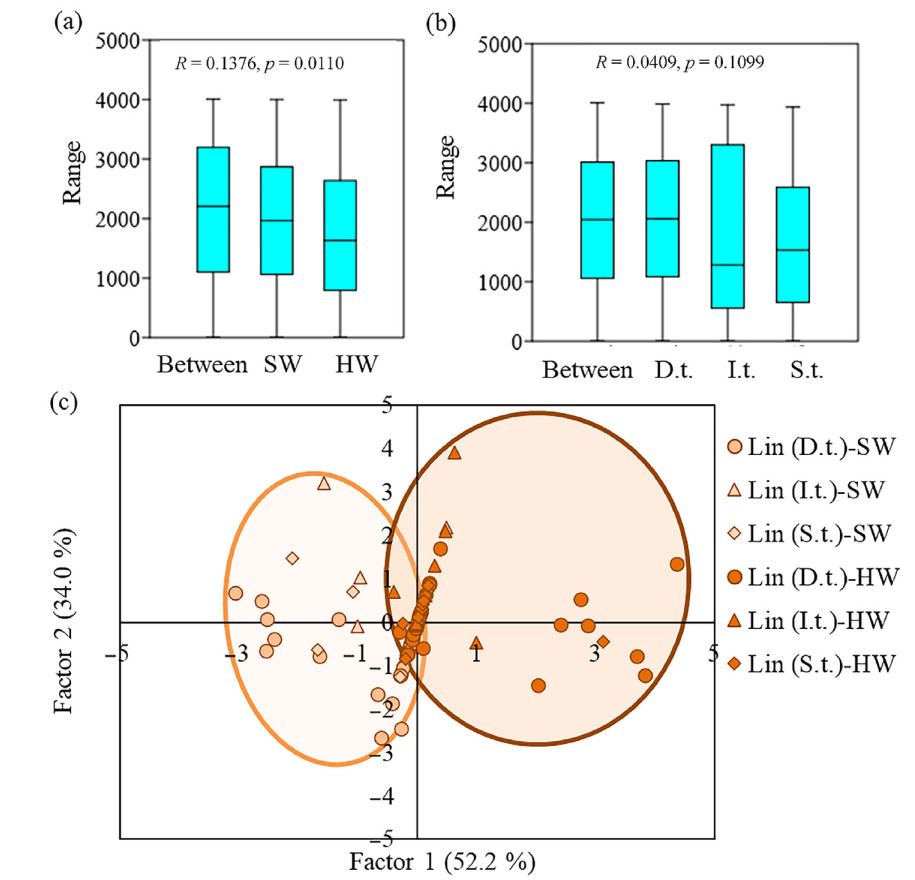
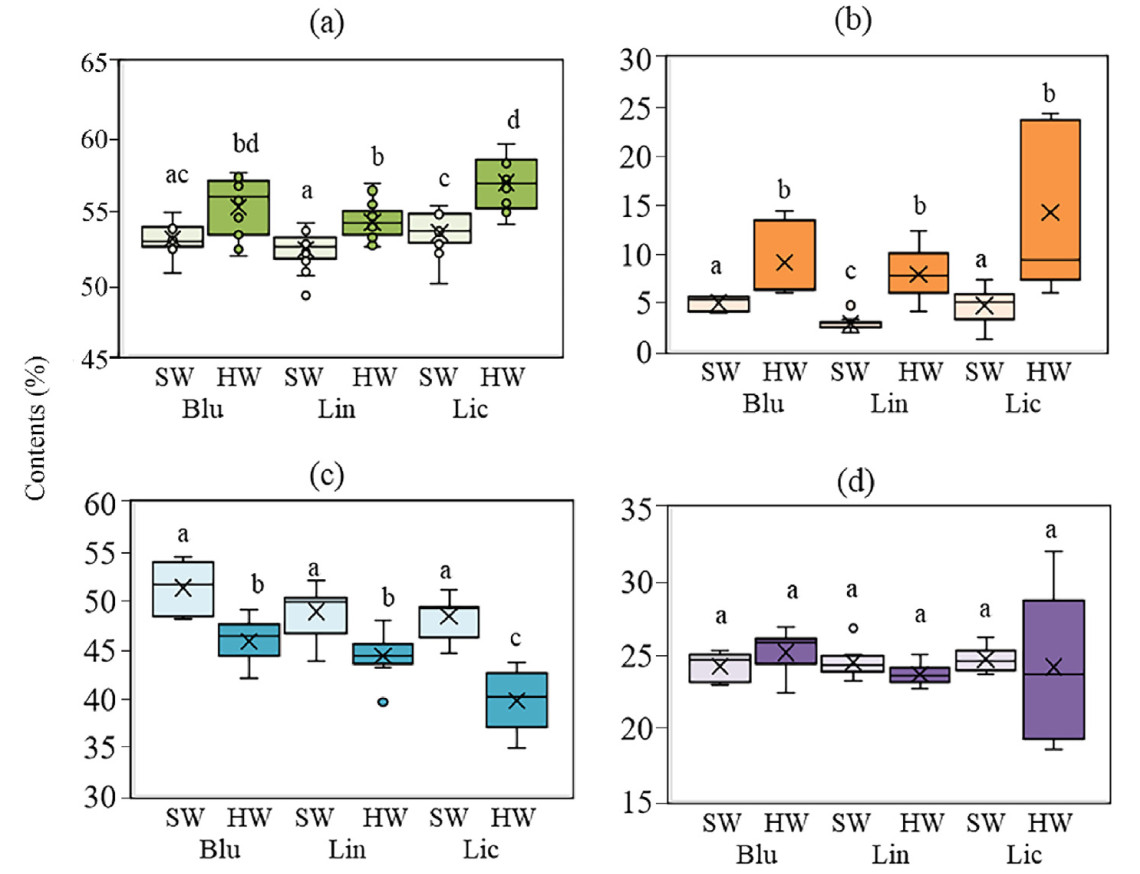
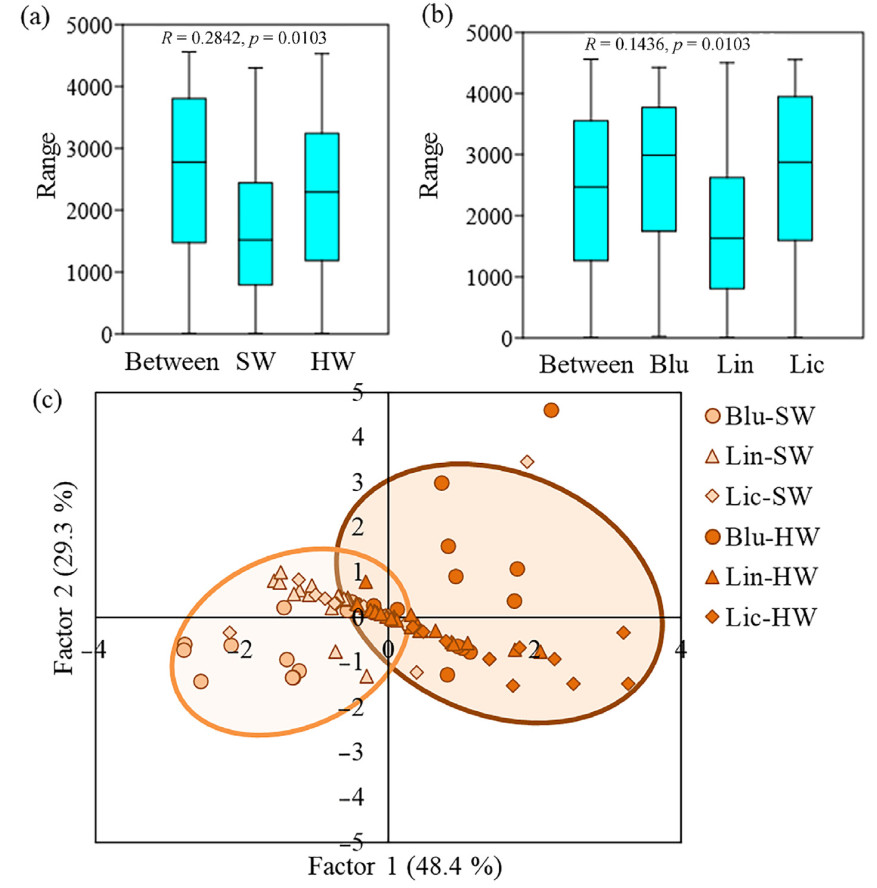
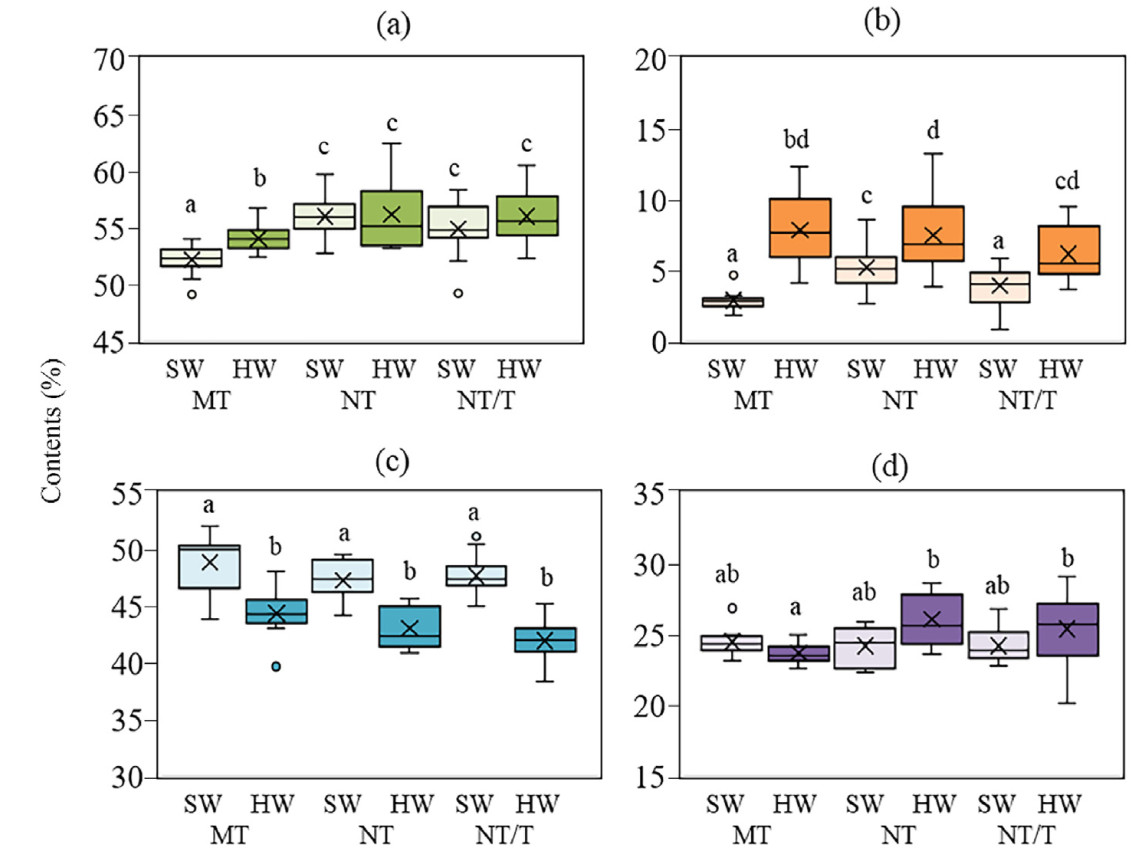
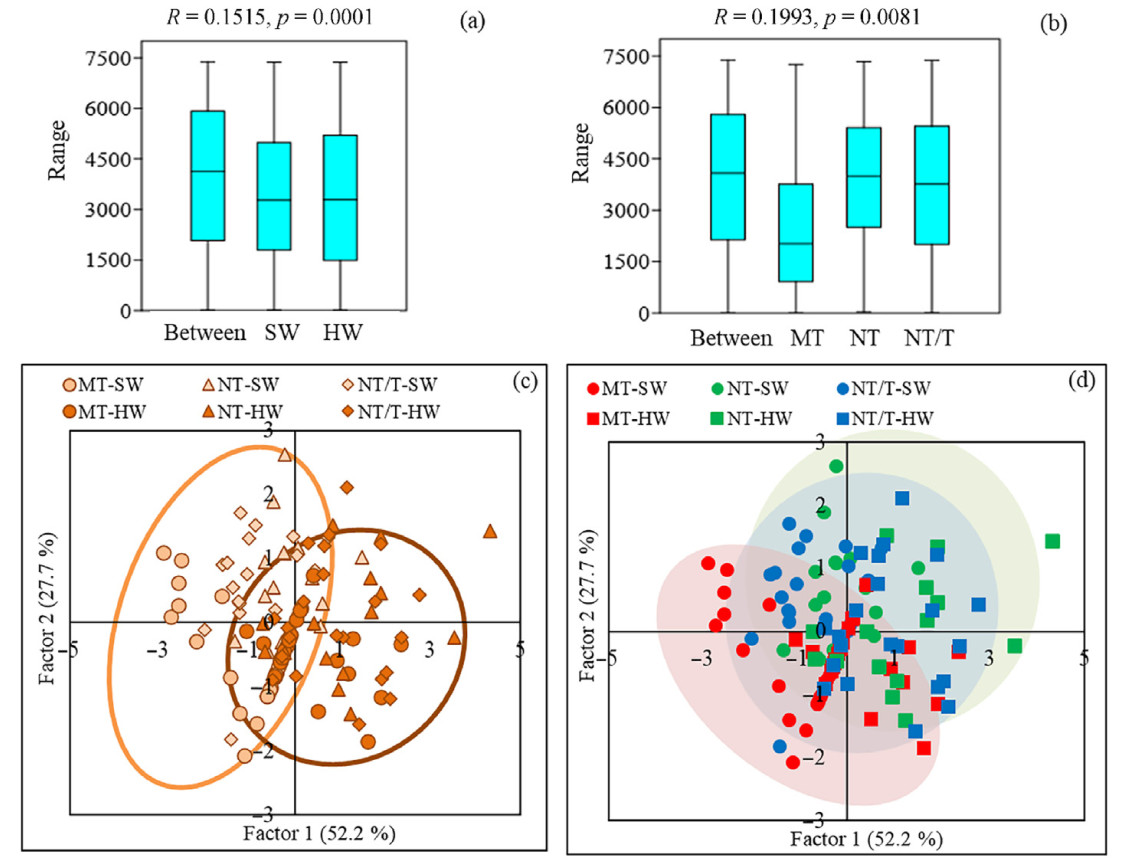
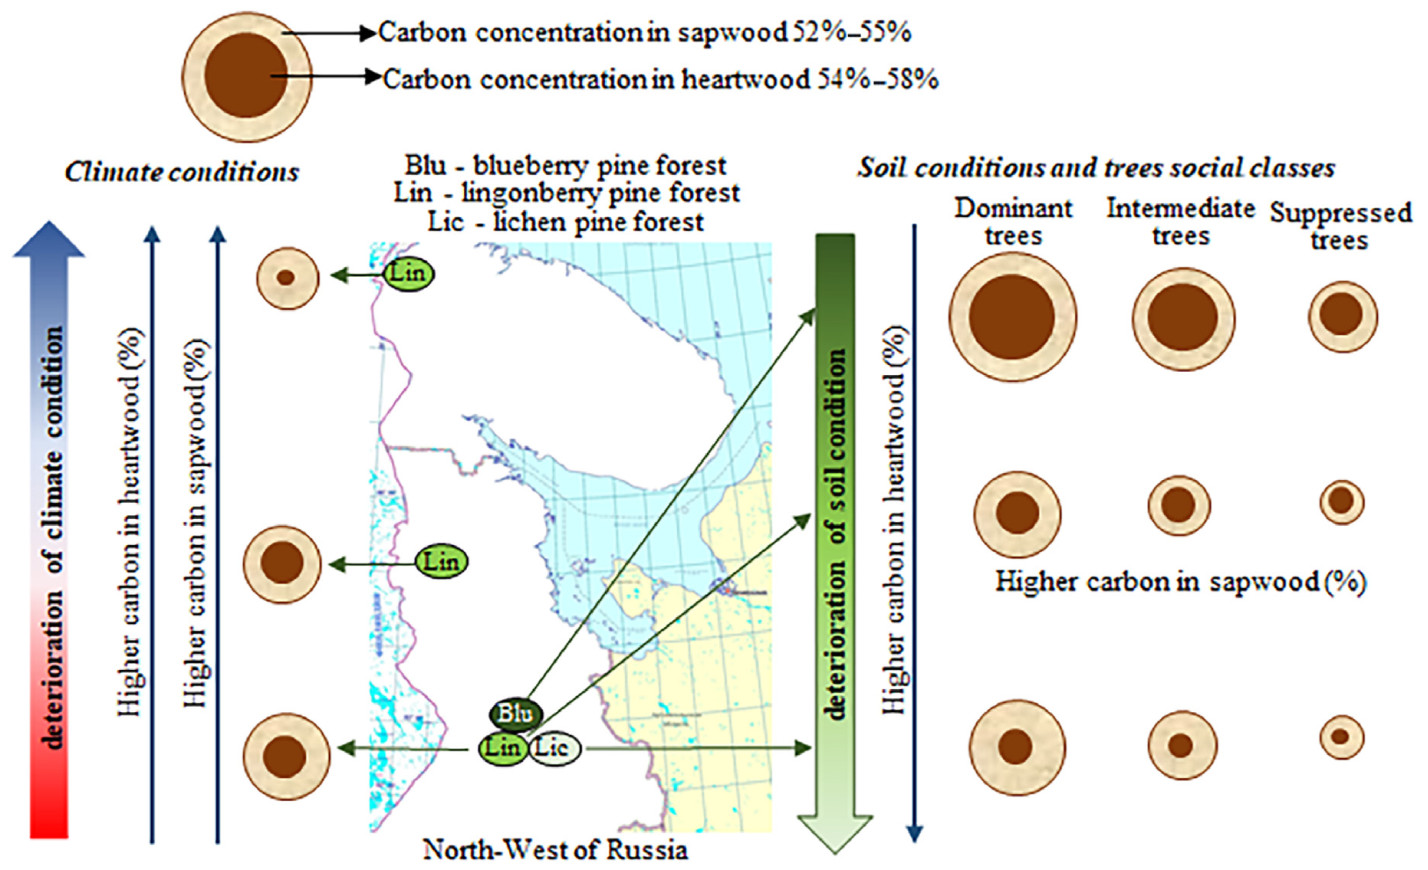


 Email Alerts
 RSS Feeds