Serajis Salekin, Mark Bloomberg, Benye Xi, Jinqiang Liu, Yang Liu, Doudou Li, G. Mason Euan. Hybrid ecophysiological growth model for deciduous Populus tomentosa plantation in northern China[J]. Forest Ecosystems, 2025, 12(1): 100270. DOI: 10.1016/j.fecs.2024.100270
Citation:
Serajis Salekin, Mark Bloomberg, Benye Xi, Jinqiang Liu, Yang Liu, Doudou Li, G. Mason Euan. Hybrid ecophysiological growth model for deciduous Populus tomentosa plantation in northern China[J]. Forest Ecosystems, 2025, 12(1): 100270. DOI: 10.1016/j.fecs.2024.100270
Serajis Salekin, Mark Bloomberg, Benye Xi, Jinqiang Liu, Yang Liu, Doudou Li, G. Mason Euan. Hybrid ecophysiological growth model for deciduous Populus tomentosa plantation in northern China[J]. Forest Ecosystems, 2025, 12(1): 100270. DOI: 10.1016/j.fecs.2024.100270
Citation:
Serajis Salekin, Mark Bloomberg, Benye Xi, Jinqiang Liu, Yang Liu, Doudou Li, G. Mason Euan. Hybrid ecophysiological growth model for deciduous Populus tomentosa plantation in northern China[J]. Forest Ecosystems, 2025, 12(1): 100270. DOI: 10.1016/j.fecs.2024.100270
Scion Research (New Zealand Forest Research Institute Ltd.), Rotorua, 3046, New Zealand
b.
New Zealand School of Forestry, University of Canterbury, Christchurch, 8140, New Zealand
c.
State Key Laboratory of Efficient Production of Forest Resources, Beijing Forestry University, Beijing, 100083, China
d.
Key Laboratory for Silviculture and Forest Ecosystem Research in Arid- and Semi-Arid Region of National Forestry and Grassland Administration, Beijing Forestry University, Beijing, 100083, China
e.
Key Laboratory for Silviculture and Conservation of Ministry of Education, Beijing Forestry University, Beijing, 100083, China
f.
Institute of Medicinal Plant Development, Chinese Academy of Medical Sciences, Peking Union Medical College, Beijing, 100193, China
Funds:
The National Key Research and Development Program of China2021YFD2201203
The 5·5 Engineering Research & Innovation Team Project of Beijing Forestry UniversityBLRC2023C05
The Key Research and Development Program of Shandong Province2021SFGC02050102
Short rotation plantation forestry (SRF) is being widely adopted to increase wood production, in order to meet global demand for wood products. However, to ensure maximum gains from SRF, optimised management regimes need to be established by integrating robust predictions and an understanding of mechanisms underlying tree growth. Hybrid ecophysiological models, such as potentially useable light sum equation (PULSE) models, are useful tools requiring minimal input data that meet the requirements of SRF. PULSE models have been tested and calibrated for different evergreen conifers and broadleaves at both juvenile and mature stages of tree growth with coarse soil and climate data. Therefore, it is prudent to question: can adding detailed soil and climatic data reduce errors in this type of model? In addition, PULSE techniques have not been used to model deciduous species, which are a challenge for ecophysiological models due to their phenology. This study developed a PULSE model for a clonal Populus tomentosa plantation in northern China using detailed edaphic and climatic data. The results showed high precision and low bias in height (m) and basal area (m2·ha−1) predictions. While detailed edaphoclimatic data produce highly precise predictions and a good mechanistic understanding, the study suggested that local climatic data could also be employed. The study showed that PULSE modelling in combination with coarse level of edaphic and local climate data resulted in reasonably precise tree growth prediction and minimal bias.
An anticipated rise in demand for forest products, including wood-based products and energy (Karp and Shield, 2008; Zhou et al., 2011), is expected to create a significant increase in demand for forest production (Nepal et al., 2019; Korhonen et al., 2021). Short-rotation forestry (SRF), with intensive and innovative silvicultural practices, may help meet this demand (Mitchell et al., 1999; Tullus et al., 2013; Schulze et al., 2017). Fast-growing species such as poplar and willow are frequently recommended for SRF, employing various planting materials such as wands, poles and bare-rooted cuttings (Jug et al., 1999; Dickmann, 2001). Clonal poplars are among the most widely cultivated hardwood trees, being extensively planted in semi-humid temperate regions like north China (Wang et al., 2013; He et al., 2021). However, reported variation in poplar yield due to site characteristics and silvicultural practices (Mead, 2005) highlights the need for models of production that are sensitive to site and silvicultural variation.
Optimisation of forest management regimes and forestry investment can be facilitated through precise prediction of stand yield (Corona and Scotti, 1998). Consequently, understanding and predicting forest growth is crucial for production forestry. Stand growth and yield are determined by complex processes influenced by a forest stand's edaphic and climatic conditions (Yang et al., 2005; Toledo et al., 2011). Forest growth and yield modelling can be used to extrapolate stand measurements from forest inventory and remote sensing. Many growth and yield models have been developed, calibrated and tested for different tree species. These models account for a stand's growth phases and silviculture (Weiskittel et al., 2011; Burkhart and Tomé, 2012).
Broadly, growth and yield modelling approaches fall into two categories: 1) mensurational/empirical approaches, which rely on observed data and statistical descriptions of past forest growth, and 2) ecophysiological/process-based approaches, describing and explaining tree growth by representing processes underlying forest production. These two categories have advantages and disadvantages, often outweighing each other in specific contexts. For instance, mensurational models offer superior predictive precision but do not provide physiological understanding (Mason et al., 2011; Weiskittel et al., 2011). On the other hand, ecophysiological models can deliver that physiological understanding, but at the cost of model path invariance and consistency, as they often represent poorly known processes with independent variables that are difficult to access (Corona and Scotti, 1998; Mason et al., 2007). Besides, such model structures tend to compound errors at a greater rate than their empirical counterparts. These shortcomings can be resolved through a hybrid approach by carefully choosing and combining the best features of both approaches to enhance precision and physiological understanding while maintaining path-invariance (Mäkelä et al., 2000; Mason et al., 2007; Weiskittel et al., 2010). Moreover, hybrid models can flexibly incorporate changing growing conditions to accommodate climate change effects. Therefore, they can offer both an understanding of forest growth processes and reliable long-term predictions.
Potentially useable light sum equations (PULSE) represent a hybrid modelling approach that integrates light use efficiency (LUE) principles with mensurational equations (Mason et al., 2007). A PULSE model replaces the time variable in mensurational equations with accumulated interception of potentially used radiation over time or growth intervals measured in permanent sample plots (PSPs). The hybrid equations are then refitted using data from those PSPs (Mason et al., 2011; Rachid-Casnati et al., 2020; Salekin et al., 2021). This approach provides flexibility by introducing key factors regulating potentially used radiation by a stand and avoiding poorly measured processes that are difficult to predict, such as carbon allocation, canopy development and light interception. Importantly, it retains essential mensurational growth and yield properties, such as path invariance and consistency (Clutter, 1963). Since their introduction by Mason et al. (2007), PULSE models have been calibrated for evergreen conifers (e.g., Pinus radiata D. Don) and broadleaves (e.g., Eucalyptus spp.) across different growth phases and differences in silvicultural practices such as weed control (Mason et al., 2018; Rachid-Casnati et al., 2020; Salekin et al., 2021; Goude et al., 2022). Currently, PULSE models have not been calibrated and tested for any deciduous tree species, which are challenging due to their different phenological characteristics compared with evergreen tree species (Arend et al., 2023). For example, the growth period in deciduous species is defined by canopy leaf-out and leaf-fall, leading to differences in radiation interception compared with evergreen trees.
Interestingly, there are a handful of physiologically based growth prediction studies for mature clonal poplar plantations with full canopy closure. They are reported with limitations in predictions at the local scale in terms of precision and bias (Headlee et al., 2012; Hart et al., 2015) and do not allow predictions during the period immediately following crop establishment (Potithep and Yasuoka, 2011). Also, these studies reported weaknesses in the models when water was limited (Amichev et al., 2010; Potithep and Yasuoka, 2011) and sensitivity to variation in leaf-fall (Headlee et al., 2012). This presented an avenue for future research and model development to broaden the applicability of the PULSE modelling across diverse tree species and forest management scenarios.
Furthermore, unlike many ecophysiologically based approaches, PULSE models operate with a combination of sub-models to constrain LUE. Most of the LUE components and their modifiers are formulated using radiation-use modifiers similar to those in the Physiological Predictors for Plant Growth (3-PG) model (Landsberg and Waring, 1997). These sub-models or modifiers include a monthly water balance model to describe available plant root water (ASW), vapour pressure deficit (VPD) to characterise canopy conductance and a temperature modifier to define environmental limits for net photosynthetic production (detailed descriptions of these modifiers are presented in Section 2.4). These modifiers such as ASW and VPD require local site- and species-specific data to produce good predictions. Hitherto, most of the PULSE model studies have been undertaken with very coarse site data, especially with respect to soil variables such as rooting depth and soil moisture at different profile depths. Thus, for many of the studies, temperature and VPD-modified PULSE models are reported as the most parsimonious (Rachid-Casnati et al., 2020; Goude et al., 2022) even when considering topographically controlled variations in soil properties (Salekin et al., 2021). However, Salekin et al. (2021) found that a better soil description improved PULSE model predictions and explained the influence of below-ground site characteristics, and Amichev et al. (2010) reported on the shortcomings of not incorporating detailed soil information in clonal poplar growth simulations in Saskatchewan, Canada.
Hence, it is desirable to incorporate detailed soil information in developing modifiers for PULSE modelling. This study aimed to build a hybrid ecophysiological model (PULSE) for clonal Populus tomentosa with detailed soil and meteorological data. The specific objectives of this study were twofold: ⅰ) to parameterise and evaluate a site- and species-specific PULSE model, and ⅱ) to investigate different PULSE modifiers in order to enhance precision in prediction. Thus, this study sought to advance the current understanding of growth and yield dynamics of clonal poplar plantations, leveraging a hybrid ecophysiological model that accounted for specific site conditions and species characteristics, with a particular emphasis on detailed soil information.
2.
Materials and methods
2.1
Experimental site
The experiment was carried out in a research field close to Qingping town, Gaotang County, Shandong Province, China (36°48′46″ N, 116°05′24″ E). The site had a warm temperate monsoon climate, with mean annual temperature, free water surface evaporation and a frost-free period of 13.2 ℃, 1,880 mm and 204 d, respectively. Total annual average precipitation was 545 mm, concentrated between June and August (about 78% of total annual precipitation). The soil was mostly sandy loam with variable macronutrient (N, P and K) availability from shallow to deeper soil (He et al., 2020).
2.2
Plantation establishment and experimental design
The plantation was established with two-year-old trimmed rooted saplings of triploid P. tomentosa clone (Clone S86) in April 2015. The average diameter at breast height (DBH at 1.3 m) and height (H) of planting materials were 2.7 cm and 3.3 m, respectively. They were planted in a 3 m × 2 m grid with a density of 1,667 trees·ha−1. Initially, 70 g of compound fertiliser with N + P2O5 + K2O ≥ 31% (14–12–5) and organic matter (OM) ≥ 15% was applied to each cutting, and they were regularly weeded during the experimental period using herbicide.
The experimental setup followed an augmented factorial design (Piepho et al., 2006). Treatments were comprised of no irrigation control-NI, drip irrigation full-DIF and drip irrigation by control-DIC, and border irrigation full-BIF and border irrigation by control-BIC treatments. Each treatment was replicated five times. The irrigation regime was based on the P. tomentosa growth and soil water relationships established by Xi et al. (2016) and the experimental site's soil characteristics (He et al., 2021). Each tree row was installed with two drip laterals, each sitting on either side of the tree line and about 30 cm away from the tree trunks. The laterals (Dripnet PC 16250, Netafim Ltd, Tel Aviv, Israel) had an inside diameter of 1.55 cm with in-line pressure-compensating drippers at a spacing of 50 cm. The dripper flow was 1.6 L·h−1 at a pressure of 100 kPa. Irrigation was applied to all treatments at time of bud burst, around April; after that, the experimental irrigation treatments commenced. In 2016 and 2017, irrigation was initiated when the average soil matric potential at 0.2-m depth below the drippers reached −20 and −45 kPa for DIF and DIC treatments, respectively. In 2018 and 2019, the irrigation threshold for DIF treatment was increased to −18 kPa, while the threshold for the DIC treatment was left unchanged. At the same time, each BIF treatment was irrigated every five to seven days, with around 49 mm of water, and BIC was irrigated about every 30 days with 58 mm of water on average. More details about irrigation setup can be found in Zhao et al. (2023) and Supplementary Materials Table S5.
2.3
Measurements and data preparation
Every tree in the measurement plots was tagged and measured for diameter outside bark (DBH at 1.3 m) and height (H) for the growth period from April to October each year after establishment. The measurements were taken at regular intervals, either fortnightly or every month. In addition, leaf area index was calibrated and measured with a Li-Cor plant canopy analyser (Li-COR 2200C, Lincoln, US) for the same period.
Soil water content (SWC) was measured around three sample trees of average DBH in the third replicated plot for all treatments. Four access tubes 3 m in length were installed for each sample tree at 25, 50, 100 and 150 cm distances from tree trunks. The SWC of the 0–300 cm soil depth was measured using a time-domain reflectometry (TDR) tube probe (TRIME-IPH, IMKO, Germany) after calibrating it by using the oven drying method (Zou et al., 2022). SWC was measured at every 10 cm from 0 to 60 cm depth, 20 cm from 60 to 140 cm, and 40 cm from 140 to 300 cm for a similar period of tree measurement. More details of SWC measurement in this experiment were described by Yang et al. (2019). In addition, rooting depth (RD) was obtained by core sampling, as presented by Zou et al. (2022). The experimental site had a meteorological station to collect precipitation, air temperature and radiation every 10 min (Delta-T Devices Ltd, Cambridge, UK).
For this study, the average tree height (H, m) per treatment and replicate were calculated. Basal area (BA, m2·ha−1) was calculated using DBH and stem density. Leaf area index (LAI, m2·m−2), and soil water content (SWC, mm) were measured every month during the growing period, from bud burst to final leaf fall. Besides, rooting depth (RD, cm) was measured through repeated soil core sampling, details of this sampling procedure can be found in Zou et al. (2022). Minimum, maximum, and mean monthly temperature (℃), total average monthly precipitation (PERC, mm) and daily total radiation (RAD, MJ·m−2) were all summarised and organised. The compiled dataset is summarised in Table 1, and detail tree measurements by treatments are provided in Table 2. Finally, the whole dataset was divided into independent fitting and validation datasets. Two out of five replications from each treatment were randomly set aside for validation.
Table
1.
Descriptive statistics of tree, soil and climatic variables.
Potentially useable light sum equations (PULSE) are combined with mensurational models (Mason et al., 2007). In this case, a two-parameter Schumacher (1939) equation (Eq. 1) was parameterised before potential light sum (R) calculation (Eq. 2, as an example with all modifiers).
Y=eα−βR
(1)
R=M∑m=1Rmmin
(2)
where Y is the yield, R indicates potentially useable light sum since time of planting and α and β are the model's coefficients. In Eq. 2, R is the potentially useable light sum, Rm is the total radiation in month m, fCI is the light competition modifier, fθ is the available soil water modifier, fT is the temperature modifier (using estimates of mean day-time temperature, instead of mean daily temperature as in 3-PG) and fD is the vapour pressure deficit (VPD) modifier. These modifiers are described in detail in previous studies (e.g., Mason et al., 2007; Mason et al., 2011) and are outlined below. This study used measured stand-level LAI, adjusted monthly by Eq. S1 when necessary.
where is the coefficient, and is the exponent of the water modifier. These values change with soil physical properties. The moisture ratio is calculated as follows: , where is the soil water balance, and PAW is the potentially available soil water. The monthly soil water balance was estimated through Eq. (4).
\theta_T=\theta_{T-1}+R-I-E-D
(4)
where is root zone water balance in the previous month, R is rainfall, I is canopy interception, E is evapotranspiration, and D is drainage. When , excess water is assumed to be lost as drainage. Evapotranspiration was estimated through the Penman-Monteith “big leaf” model (Allen, 2005).
VPD was calculated as the mean of saturated vapour pressures when temperatures were at the daily maximum and daily minimum, respectively (Mason et al., 2007). A VPD modifier was calculated using Eq. 5 (Landsberg and Waring, 1997).
f_{\mathrm{D}}=e^{-0.05(\mathrm{VPD})}
(5)
Furthermore, a temperature modifier was based on the minimum, optimum and maximum temperatures for photosynthesis (Eq. 6).
where f_T
= 0 if or ; , and are the minimum, maximum and optimum temperatures for net photosynthetic production respectively, and is the mean temperature for each month (Landsberg and Waring, 1997).
Potentially useable light was calculated monthly by applying four different combinations of modifiers based on ⅰ) LAI (RLAI), ⅱ) temperature and LAI (RTLAI), ⅲ) vapour pressure deficit and LAI (RVPDLAI), and ⅳ) temperature, available soil water and LAI (RTASWLAI). Parameters used in modifiers are presented in Table 3, and any additional constants and coefficients used are provided in Supplementary Materials. Finally, Eq. 1 was fitted using the data from all five treatments with all four modifiers.
A full set of quantitative and qualitative residual analyses were conducted to evaluate models with fitting and validation datasets. Goodness-of-fit statistics, including the root mean square error (RMSE), mean absolute error (MAE), bias, coefficient of determination (R2) (Sargent, 2013), relative root mean square error (rRMSE) and Akaike Information Criterion (AIC) (Akaike, 1974) of both time-based and PULSE models were compared with fitting dataset. Then, the final PULSE model was tested using a k-fold (k = 5) cross-validation approach (Fushiki, 2011), and the evaluation statistics included RMSE, MAE, rRMSE and R2.
Furthermore, PULSE models' modifier-specific residuals were separated to test the performance of individual modifiers. Residuals were compared using a one-way analysis of variance (ANOVA at p < 0.05), followed by a Tukey's post-hoc analysis for different modifiers with Kenward-Roger approximation for degrees of freedom. As trees within each replication and treatment were repeatedly measured, a mixed-effect model was built to test the variation of modifier-specific residuals among different treatments. This was done by assigning “treatment” as a random effect and “modifiers” as a fixed effect.
All statistical analyses, model building and simulations were carried out in the R statistical environment (Version 4.3.1 for Windows) (R core team, 2022) through RStudio as an integrated development environment (IDE) (RStudio team, 2021). The “Anova” function from the “rstatix” package (Kassambra, 2021), the “emmeans” function of the “emmeans” package (Lenth, 2021), and the “cld” function from the “multcomp” package (Hothorn et al., 2008) were used to conduct ANOVA and multiple comparisons using the Tukey's post-hoc method. Finally, functions “rmse”, “mae”, “bias”, “rsquare” and “RRMSE” from the “Metrics” and “metrica” packages (Hammer and Frasco, 2018; Adrian et al., 2022) were used for model evaluation during fitting and validation. Besides this, residuals were visually inspected for their normality and variance homogeneity. Graphical analyses and presentations were performed with the “ggplot2” package (Wickham et al., 2019).
3.
Results
3.1
Time based versus PULSE models
Stand-level height and basal area growth models are presented by Eqs. 7 and 8, where Ht and BAt are average stand-level height and basal area per hectare at time t, respectively. RTASWLAI is the potentially accumulated useable radiation modified by temperature (T, ℃), available soil water (ASW, mm) and leaf area index (LAI), and α and β are model coefficients.
In both cases, PULSE models were superior in performance for precision and bias, compared with the time-based models, which had time in the denominator instead of R (Table 5). Time-based model performance was improved with individual model fitting and parametrising for each treatment (Supplementary Materials Table S3), whereas one PULSE model was sufficient to model all treatments.
Table
4.
Time based and PULSE models’ fitting goodness-of-fit statistics. R2 = coefficient of determination, RMSE = root mean square error, rRMSE = relative root mean square error, and MAE = mean absolute error. Bold font indicates better results.
Both final height and basal area PULSE models (Eqs. 7 and 8, parameters at Table 5) represented a mathematically and biologically rational framework. For all treatments 1) models marginally under-predicted height and basal area at the beginning of plantation establishment and 2) model growth responses to potentially useable light sum (PULS) were similar (Fig. 1). Evaluation of models through validation goodness-of-fit statistics showed high precision and low bias through minimal RMSE, MAE, and a high coefficient of determination (Table 6).
Figure
1.
PULSE model prediction (black lines) of a) average stand height (m) and b) basal area (m2·ha−1). Different coloured points showed observed data.
Table
6.
Height and basal area model validation goodness-of-fit statistics for PULSE modelling approach based on overall k-fold means (k=5). Fold wise values can be found in Table S4. See Table 4 for abbreviations.
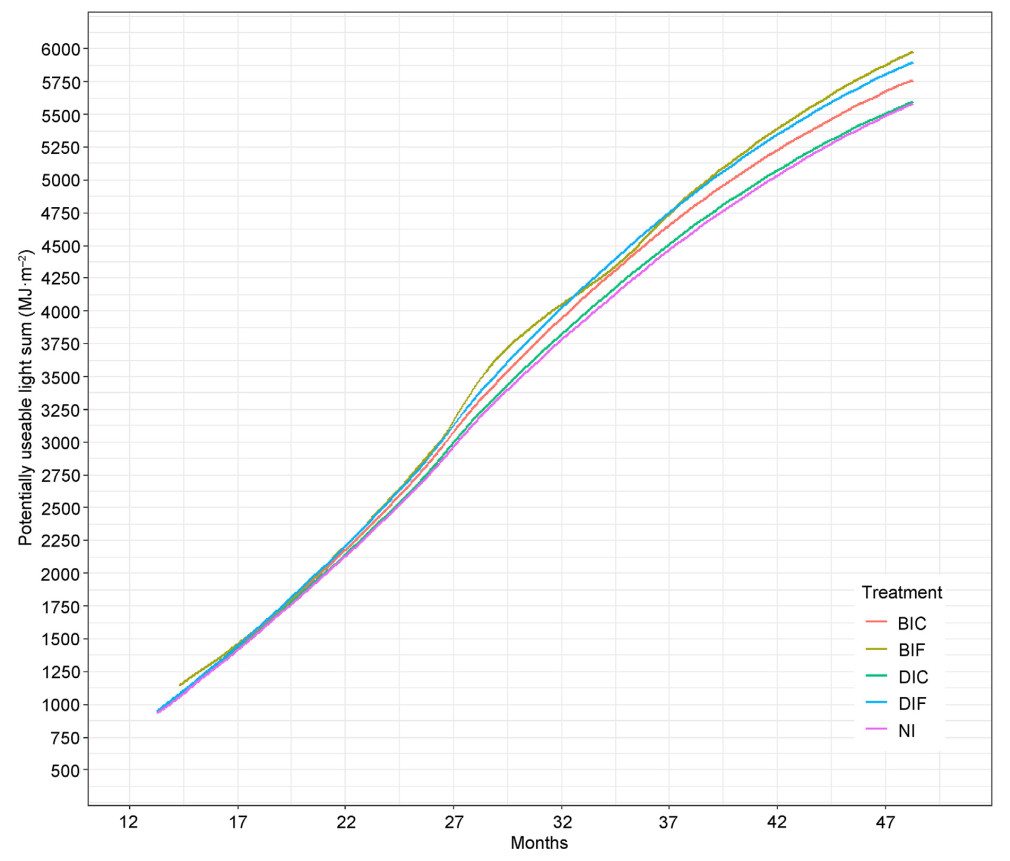
Differences between irrigation treatments in PULS followed expected trends, with the full irrigation treatments (BIF and DIF) having the highest values after four years and the control (NI) treatment having the lowest values, along with drip irrigation by deficit treatment (DIC) (Fig. 2). Thus, while growth responses to PULS were similar for all irrigation treatments (Fig. 1), differences in PULS amongst treatments would result in differences in height and basal area growth.
Figure
2.
Potentially useable light sum (PULS) versus time for all irrigation treatments.
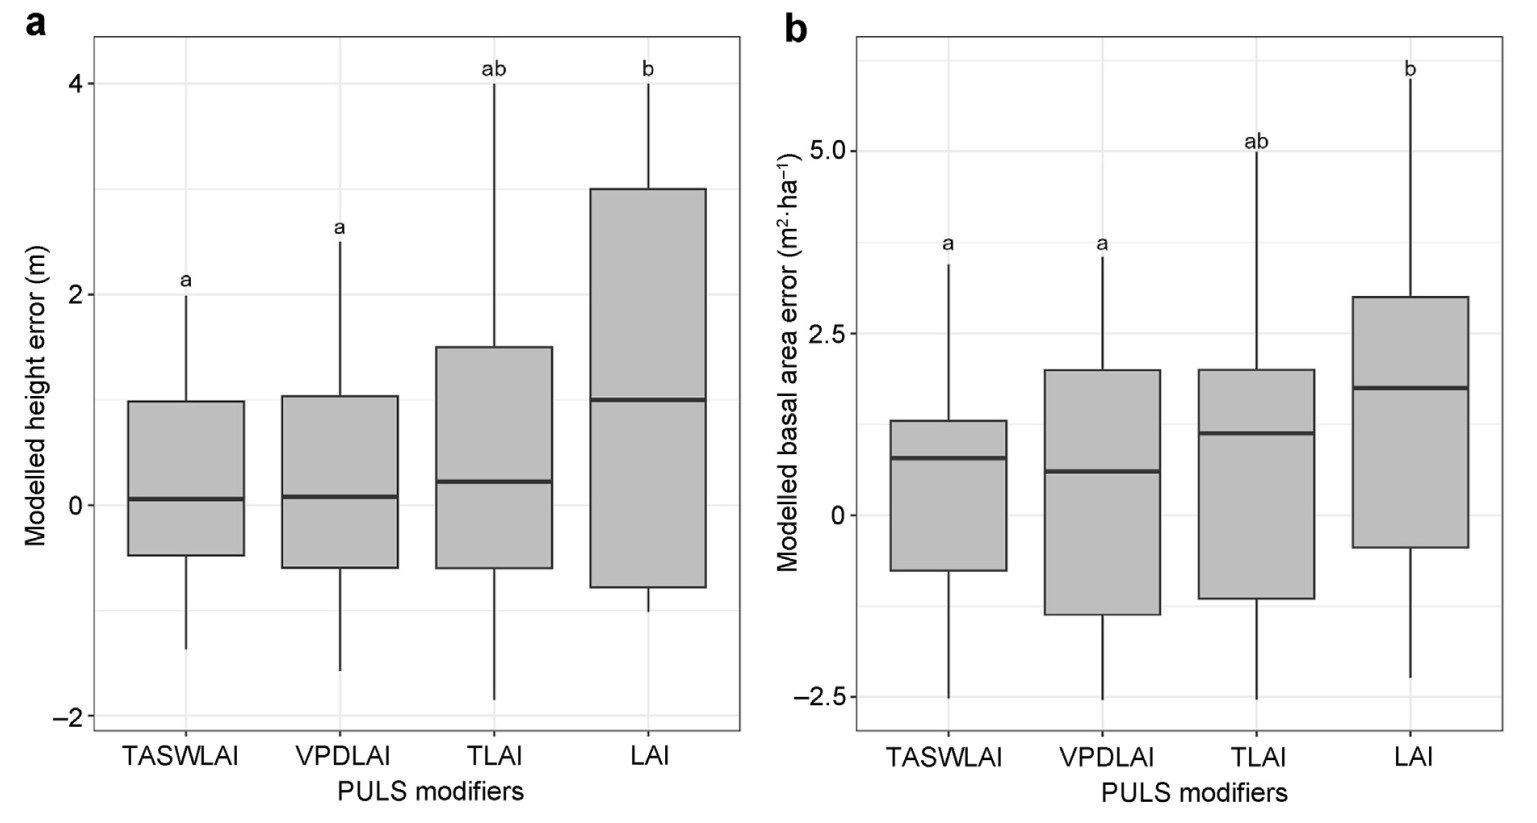
Of the final potentially useable sum of light (PULS) modifiers, the one based on temperature, available soil water and leaf area index (RTASWLAI) performed the best. Variation in modelled errors amongst modifiers was found for both height (F3,132 = 4.59, p < 0.05) and basal area (F3,132 = 3.72, p < 0.05). RLAI and RTLAI showed the poorest performance, whereas RVPDLAI showed less variation in modelled errors, and modelled errors were not significantly different from those for RTASWLAI (Fig. 3).
Figure
3.
Comparison of prediction errors of different PULS modifiers: a) average stand height (m) and b) stand-level basal area (m2·ha−1). The different letters indicate their differences at p<0.05. TASWLAI=temperature and available soil water with LAI; VPDLAI=vapour pressure deficit with LAI; TLAI=temperature with LAI and LAI=LAI only modifiers.
Time-based mensurational statistical growth and yield modelling approaches are widely used but are inevitably site-specific (Clutter, 1963; Weiskittel et al., 2011). Hence, these models are affected by local variations in climate and management practices, such as control of competitive vegetation or site modification (Mason et al., 2007). The influence of local site modification treatments was shown in this study, where individual time-based models were required for each irrigation treatment, and if one time-based model was fitted across all treatments, then errors were comparatively large. On the other hand, complex biophysically based models can represent detailed processes of tree response to variations in climate and/or management (Constable and Friend, 2000). However, such overly complex models have limitations, such as compounding recursive errors and the inability to model the effects of silvicultural management regimes. Therefore, complex biophysically based models are often considered research-grade tools to be cautiously used by experts. Hence, hybrid models like PULSE, by carefully incorporating the strengths of each approach, are likely to be more useful for satisfying practical as well as research needs (Mason et al., 2011; Weiskittel et al., 2011). In this study, PULSE enabled one model that covered all treatments that had much smaller errors than fitting a single time-based empirical model.
The PULSE models reported in this study demonstrated a simple hybrid ecophysiological modelling approach for deciduous Populus tomentosa. Various combinations of modifiers were derived and tested by incorporating detailed sets of edaphic and climatic data. The models showed parsimonious and plausible outcomes. However, relatively small inconsistencies arose and were reported through goodness-of-fit statistics. Previous studies with PULSE models showed similar patterns of goodness-of-fit statistics from fitting to validation datasets and from juvenile to mature plantation species (Mason et al., 2018; Rachid-Casnati et al., 2020; Salekin et al., 2021; Goude et al., 2022). In this study, most inconsistencies were reported with positive numbers, such as RMSE, MAE and Bias, which may indicate a slight overprediction. This overprediction may have happened at establishment, indicating a period when planting materials may have invested more in root development rather than stem height and DBH growth (McKay and Morgan, 2001) and roots may have occupied only a small volume of soil, thereby enabling slower plant growth than growth predicted by the models. Similar responses were reported by Gould and Harrington (2009) for Quercus alba in Oregon, USA, and by Severino et al. (2011) for Jatropha curcas in Paraiba, Brazil. In addition, the use of planting materials with trimmed roots is also reported to affect initial root development and growth (Zadworny et al., 2021).
Among different models, potentially useable light sum (PULS) modified by temperature, available soil water and LAI (RTASWLAI) was the best combination with minimal and less variation prediction errors for height and basal area predictions of Populus tomentosa. This result differed from most previous studies with the PULSE approach, where temperature and VPD-modified PULS (RVPDLAI) models exhibited minimal errors. The difference may be caused by the coarse level of edaphic data used previously (Salekin et al., 2021), whereas this study used comparatively detailed soil moisture and rooting depth profile data. The result confirms the finding that tree growth is mechanistically modulated by a coupled effect of edaphic and climatic variables (Zweifel et al., 2006; Li et al., 2017), which reinforces the importance of considering soil-plant-atmosphere interactions in order to understand current and anticipated future productivity changes (Silva et al., 2016). In addition, RVPDLAI in this study resulted in a prediction error that was not significantly different from RTASWLAI, which indicates that, with local climatic data, RVPDLAI can produce reasonably accurate predictions. Again, all treatments were subjected to essentially the same temperatures, so unsurprisingly, temperature was not required to distinguish between treatments. Flo et al. (2022) and Zweifel et al. (2021) reported that vapour pressure deficit (VPD) is the main global driver of tree canopy conductance and drives/limits tree growth. Hence, bringing that factor into the modelling framework should adequately explain and predict growth in the absence of detailed edaphic data.
The dataset used in this study was small in terms of the number of trees and only came from one experimental site. However, it comprised a rigorously measured and orthogonal set of soil, local climate and tree data. In addition, this dataset appropriately captured seasonal stem and foliage growth of deciduous Populus tomentosa, which was crucial. It was not possible to replicate this level of detail over multiple sites. However, one of the authors (B.Y. Xi) is currently assembling a China-wide network of poplar growth studies that will include detailed edaphic and climate measurements. In time, the data from this network would allow the PULSE model to be tested over a wide range of sites and climates. Apart from the limitation of this study to just one site, the only other deficiency was the lack of measurements of root development over time. So, in future, consideration should be given to incorporating the type of planting material and root development into the modelling framework. Currently incorporation of root development into the modelling framework remains outside the scope of this study.
5.
Conclusions
This study presented a hybrid ecophysiological modelling approach and framework for clonal deciduous Populus tomentosa plantations, incorporating high-resolution edaphic and climatic data. The stand-level height and basal area prediction demonstrated high precision and low bias for the single study site. Besides, this study provides insight into the importance of detailed soil data that could be coupled with climatic data for predicting and explaining productivity changes.
Furthermore, this study demonstrated that including trees’ hydrological sensitivity in the modelling framework yielded better model predictions. Finally, where no detailed soil information exists, local climatic data can be used with coarse-level soil data to obtain reasonable growth predictions and explanations.
CRediT authorship contribution statement
Serajis Salekin: Writing – review & editing, Writing – original draft, Visualization, Validation, Project administration, Methodology, Investigation, Formal analysis, Data curation, Conceptualization. Mark Bloomberg: Writing – review & editing, Project administration, Methodology, Investigation, Data curation, Conceptualization. Benye Xi: Writing – review & editing, Resources, Methodology, Funding acquisition, Data curation, Conceptualization. Jinqiang Liu: Writing – review & editing, Data curation. Yang Liu: Writing – review & editing, Data curation. Doudou Li: Writing – review & editing, Data curation. Euan G. Mason: Writing – review & editing, Software, Formal analysis.
Data availability
The underlying data and potentially useable light sum equations (PULSEs) code are available on reasonable request for research purposes. They are not publicly available due to privacy and/or ethical restrictions.
Declaration of interests
The authors declare that they have no known competing financial interests or personal relationships that could have appeared to influence the work reported in this paper.
Acknowledgements
The authors would like to thank all the Key Laboratory of Silviculture and Conservation members, specifically Xin Li, for assisting with the experimental setup and measurements. Additionally, authors would also like to thank the two anonymous reviewers for their comments to improve this manuscript.
Adrian, A.C., Rosso, L.H.M., Hernandez, C.H., Bastos, L.M., Nieto, L., Holzworth, D., Ciampitti, I.A., 2022. metrica: an R package to evaluate prediction performance of regression and classification point-forecast models. J. Open Source Softw. 7, 4655.
Akaike, H., 1974. A new look at the statistical model identification. IEEE Trans. Automat. Control 19, 716–723.
Allen, R., 2005. Penman-Monteith equation. In: Hillel, D. (Ed.), Encyclopedia of Soils in the Environment. Elsevier, Oxford, pp. 180-188.
Amichev, B.Y., Johnston, M., Van Rees, K.C.J., 2010. Hybrid poplar growth in bioenergy production systems: biomass prediction with a simple process-based model (3PG). Biomass Bioenergy 34, 687–702.
Arend, M., Hoch, G., Kahmen, A., 2023. Stem growth phenology, not canopy greening constrains deciduous tree growth. Tree Physiol. 44 (2).
Burkhart, H.E., Tomé, M., 2012. Modeling forest stand development. In: Burkhart, H.E., Tome, M. (Eds.), Modeling Forest Trees and Stands. Springer, Netherlands, Dordrecht, pp. 233-244.
Clutter, J.L., 1963. Compatible growth and yield models for Loblolly pine. For. Sci. 9, 354–371.
Constable, J.V.H., Friend, A.L., 2000. Suitability of process-based tree growth models for addressing tree response to climate change. Environ. Pollut. 110, 47–59.
Coops, N.C., Waring, R.H., 2001. Estimating forest productivity in the eastern Siskiyou Mountains of southwestern Oregon using a satellite driven process model, 3-PGS. Can. J. For. Res. 31, 143–154.
Corona, P., Scotti, R., 1998. Forest growth and yield modelling. J. Sustain. For. 7, 131–143.
Dickmann, D., 2001. Poplar Culture in North America. NRC Research Press, Canada.
Flo, V., Martínez-Vilalta, J., Granda, V., Mencuccini, M., Poyatos, R., 2022. Vapour pressure deficit is the main driver of tree canopy conductance across biomes. Agric. For. Meteorol. 322, 109029.
Fushiki, T., 2011. Estimation of prediction error by using K-fold cross-validation. Stat. Comput. 21, 137–146.
Goude, M., Nilsson, U., Mason, E., Vico, G., 2022. Using hybrid modelling to predict basal area and evaluate effects of climate change on growth of Norway spruce and Scots pine stands. Scand. J. For. Res. 37, 59–73.
Gould, P.J., Harrington, C.A., 2009. Root morphology and growth of bare-root seedlings of Oregon white Oak. Tree Planters’ Notes, U.S. Dep. Agric. For. Serv., 53.
Hammer, R., Frasco, M., 2018. Metrics: evaluation metrics for machine learning. R package version 0.1.4.
Hart, Q.J., Tittmann, P.W., Bandaru, V., Jenkins, B.M., 2015. Modeling poplar growth as a short rotation woody crop for biofuels in the Pacific Northwest. Biomass Bioenergy 79, 12–27.
He, Y., Xi, B., Bloomberg, M., Jia, L., Zhao, D., 2020. Effects of drip irrigation and nitrogen fertigation on stand growth and biomass allocation in young triploid Populus tomentosa plantations. For. Ecol. Manag. 461.
He, Y., Xi, B., Li, G., Wang, Y., Jia, L., Zhao, D., 2021. Influence of drip irrigation, nitrogen fertigation, and precipitation on soil water and nitrogen distribution, tree seasonal growth and nitrogen uptake in young triploid poplar (Populus tomentosa) plantations. Agric. Water Manag. 243.
Headlee, W.L., Zalesny, R.S., Donner, D.M., Hall, R.B., 2012. Using a process-based model (3-PG) to predict and map hybrid poplar biomass productivity in Minnesota and Wisconsin, USA. Bio-Energy Res. 6, 196–210.
Hothorn, T., Bretz, F., Westfall, P., 2008. Simultaneous inference in general parametric models. Biom. J. 50, 346–363.
Jug, A., Hofmann-Schielle, C., Makeschin, F., Rehfuess, K.E., 1999. Short-rotation plantations of balsam poplars, aspen and willows on former arable land in the Federal Republic of Germany. II. Nutritional status and bioelement export by harvested shoot axes. For. Ecol. Manag. 121, 67–83.
Karp, A., Shield, I., 2008. Bioenergy from plants and the sustainable yield challenge. New Phytol. 179, 15–32.
Kassambra, A., 2021. rstatix: pipe-friendly framework for basic statistical tests. R package version 0.7.2.
Korhonen, J., Nepal, P., Prestemon, J.P., Cubbage, F.W., 2021. Projecting global and regional outlooks for planted forests under the shared socio-economic pathways. N. For. 52, 197–216.
Landsberg, J.J., Waring, R.H., 1997. A generalised model of forest productivity using simplified concepts of radiation-use efficiency, carbon balance and partitioning. For. Ecol. Manag. 95, 209–228.
Lenth, R.V., 2021. emmeans: estimated marginal means, aka least-square means. R package version 1 (10.5).
Li, Z., Yu, P., Wang, Y., Webb, A.A., He, C., Wang, Y., Yang, L., 2017. A model coupling the effects of soil moisture and potential evaporation on the tree transpiration of a semi-arid larch plantation. Ecohydrology 10, e1764.
Mäkelä, A., Landsberg, J., Ek, A.R., Burk, T.E., Ter-Mikaelian, M., Ågren, G.I., Oliver, C.D., Puttonen, P., 2000. Process-based models for forest ecosystem management: current state of the art and challenges for practical implementation. Tree Physiol. 20, 289–298.
Mason, E.G., Holmström, E., Nilsson, U., 2018. Using hybrid physiological/mensurational modelling to predict site index of Pinus sylvestris L. in Sweden: a pilot study. Scand. J. For. Res. 33, 147–154.
Mason, E.G., Methol, R., Cochrane, H., 2011. Hybrid mensurational and physiological modelling of growth and yield of Pinus radiata D.Don. using potentially useable radiation sums. Forestry 84, 99–108.
Mason, E.G., Rose, R.W., Rosner, L.S., 2007. Time vs. light: a potentially useable light sum hybrid model to represent the juvenile growth of Douglas-fir subject to varying levels of competition. Can. J. For. Res. 37, 795–805.
McKay, H.M., Morgan, J.L., 2001. The physiological basis for the establishment of bare-root larch seedlings. For. Ecol. Manag. 142, 1–18.
McNaughton, K., Jarvis, P., 1983. Predicting effects of vegetation changes on transpiration and evaporation. Water Defic. Plant Growth 7, 1–47.
Mead, D.J., 2005. Opportunities for improving plantation productivity. How much? How quickly? How realistic? Biomass Bioenergy 28, 249–266.
Mitchell, C.P., Stevens, E.A., Watters, M.P., 1999. Short-rotation forestry – operations, productivity and costs based on experience gained in the UK. For. Ecol. Manag. 121, 123–136.
Nepal, P., Korhonen, J., Prestemon, J.P., Cubbage, F.W., 2019. Projecting global planted forest area developments and the associated impacts on global forest product markets. J. Environ. Manag. 240, 421–430.
Piepho, H.P., Williams, E.R., Fleck, M., 2006. A note on the analysis of designed experiments with complex treatment structure. Hortscience 41, 446–452.
Potithep, S., Yasuoka, Y., 2011. Application of the 3-PG model for gross primary productivity estimation in deciduous broadleaf forests: a study area in Japan. Forests 2, 590–609.
R core team, 2022. R: A Language and Environment for Statistical Computing. R Foundation for Statistical Computing, Vienna, Austria.
Rachid-Casnati, C., Mason, E.G., Woollons, R.C., Landsberg, J.J., 2020. Modelling growth of Pinus taeda and Eucalyptus grandis as a function of light sums modified by air temperature, vapour pressure deficit, and water balance. New Zealand J. For. Sci. 50.
Richardson, B., Kimberley, M.O., Ray, J.W., Coker, G.W., 1999. Indices of interspecific plant competition for Pinus radiata in the central north island of New Zealand. Can. J. For. Res. 29, 898–905.
RStudio team, 2021. RStudio: Integrated Development Environment for R. RStudio. PBC, Boston, MA.
Salekin, S., Mason, E.G., Morgenroth, J., Bloomberg, M., Meason, D.F., 2021. Hybrid height growth and survival model for juvenile Eucalyptus globoidea (Blakely) and E. bosistoana (F. Muell) in New Zealand. For. Ecol. Manag. 490, 119074.
Sands, P., 2004. Adaptation of 3-PG to Novel Species: Guidelines for Data Collection and Parameter Assignment. CRC Sustainable Production Forestry, Hobart, p. 34.
Sargent, R.G., 2013. Verification and validation of simulation models. J. Simulat. 7, 12–24.
Schulze, J., Gawel, E., Nolzen, H., Weise, H., Frank, K., 2017. The expansion of short rotation forestry: characterization of determinants with an agent-based land use model. GCB Bioenergy 9, 1042–1056.
Schumacher, F.X., 1939. A new growth curve and its application to timber yield studies. J. Fr. 37, 819–820.
Severino, L.S., Lima, R.L.S., Lucena, A.M.A., Freire, M.A.O., Sampaio, L.R., Veras, R.P., Medeiros, K.A.A.L., Sofiatti, V., Arriel, N.H.C., 2011. Propagation by stem cuttings and root system structure of Jatropha curcas. Biomass Bioenergy 35, 3160–3166.
Silva, L.C.R., Sun, G., Zhu-Barker, X., Liang, Q., Wu, N., Horwath, W.R., 2016. Tree growth acceleration and expansion of alpine forests: the synergistic effect of atmospheric and edaphic change. Sci. Adv. 2, e1501302.
Toledo, M., Poorter, L., Peña-Claros, M., Alarcón, A., Balcázar, J., Leaño, C., Licona, J.C., Llanque, O., Vroomans, V., Zuidema, P., Bongers, F., 2011. Climate is a stronger driver of tree and forest growth rates than soil and disturbance. J. Ecol. 99, 254–264.
Tullus, H., Tullus, A., Rytter, L., 2013. Short-rotation forestry for supplying biomass for energy production. In: Kellomäki, S., Kilpeläinen, A., Alam, A. (Eds.), Forest BioEnergy Production: Management, Carbon Sequestration and Adaptation. Springer, New York, New York, pp. 39-56.
Wang, D., LeBauer, D., Dietze, M., 2013. Predicting yields of short-rotation hybrid poplar (Populus spp.) for the United States through model–data synthesis. Ecol. Appl. 23, 944–958.
Weiskittel, A.R., Hann, D.W., Kershaw, J.A., Vanclay, J.K., 2011. Forest Growth and Yield Modeling. John Wiley & Sons Ltd.
Weiskittel, A.R., Maguire, D.A., Monserud, R.A., Johnson, G.P., 2010. A hybrid model for intensively managed Douglas-fir plantations in the Pacific Northwest, USA. Eur. J. For. Res. 129, 325–338.
Wickham, H., Averick, M., Bryan, J., Chang, W., McGowan, L.D., François, R., Grolemund, G., Hayes, A., Henry, L., Hester, J., Kuhn, M., Pederse, T.L., Miller, E., Bache, S.M., Müller, K., Ooms, J., Robinson, D., Seidel, D.P.S.V., Takahashi, K., Vaughan, D., Wilke, C., Woo, K., Yutani, H., 2019. Welcome to the tidyverse. J. Open Source Softw. 4, 1686.
Xi, B., Bloomberg, M., Watt, M.S., Wang, Y., Jia, L., 2016. Modeling growth response to soil water availability simulated by HYDRUS for a mature triploid Populus tomentosa plantation located on the North China Plain. Agric. Water Manag. 176, 243–254.
Yang, T., Li, D., Clothier, B., Wang, Y., Duan, J., Di, N., Li, G., Li, X., Jia, L., Xi, B., Hu, W., 2019. Where to monitor the soil-water potential for scheduling drip irrigation in Populus tomentosa plantations located on the North China Plain? For. Ecol. Manag. 437, 99–112.
Yang, Y., Watanabe, M., Li, F., Zhang, J., Zhang, W., Zhai, J., 2005. Factors affecting forest growth and possible effects of climate change in the Taihang Mountains, northern China. Forestry 79, 135–147.
Zadworny, M., Mucha, J., Jagodziński, A.M., Kościelniak, P., Łakomy, P., Modrzejewski, M., Ufnalski, K., Żytkowiak, R., Comas, L.H., Rodríguez-Calcerrada, J., 2021. Seedling regeneration techniques affect root systems and the response of Quercus robur seedlings to water shortages. For. Ecol. Manag. 479, 118552.
Zhao, X., Li, X., Hu, W., Liu, J., Di, N., Duan, J., Li, D., Liu, Y., Guo, Y., Wang, A., Deng, T., Xi, B., 2023. Long-term variation of the sap flow to tree diameter relation in a temperate poplar forest. J. Hydrol. 618.
Zhou, X., Wang, F., Hu, H., Yang, L., Guo, P., Xiao, B., 2011. Assessment of sustainable biomass resource for energy use in China. Biomass Bioenergy 35, 1–11.
Zou, S., Li, D., Di, N., Liu, J., Li, L., Liu, Y., Xi, B., Coleman, M., 2022. Stand development modifies effects of soil water availability on poplar fine-root traits: evidence from a six-year experiment. Plant Soil 480, 165–184.
Zweifel, R., Sterck, F., Braun, S., Buchmann, N., Eugster, W., Gessler, A., Häni, M., Peters, R.L., Walthert, L., Wilhelm, M., Ziemińska, K., Etzold, S., 2021. Why trees grow at night. New Phytol. 231, 2174–2185.
Zweifel, R., Zimmermann, L., Zeugin, F., Newbery, D.M., 2006. Intra-annual radial growth and water relations of trees: implications towards a growth mechanism. J. Exp. Bot. 57, 1445–1459.
Table
4.
Time based and PULSE models’ fitting goodness-of-fit statistics. R2 = coefficient of determination, RMSE = root mean square error, rRMSE = relative root mean square error, and MAE = mean absolute error. Bold font indicates better results.
Table
6.
Height and basal area model validation goodness-of-fit statistics for PULSE modelling approach based on overall k-fold means (k=5). Fold wise values can be found in Table S4. See Table 4 for abbreviations.

 DownLoad:


 Email Alerts
 RSS Feeds