Unai Sertutxa, Unai Ortega-Barrueta, Ibone Ametzaga-Arregi, Lorena Peña. Effect of the rotation frequency in the eucalypt plantations[J]. Forest Ecosystems, 2024, 11(1): 100251. DOI: 10.1016/j.fecs.2024.100251
Citation:
Unai Sertutxa, Unai Ortega-Barrueta, Ibone Ametzaga-Arregi, Lorena Peña. Effect of the rotation frequency in the eucalypt plantations[J]. Forest Ecosystems, 2024, 11(1): 100251. DOI: 10.1016/j.fecs.2024.100251
Unai Sertutxa, Unai Ortega-Barrueta, Ibone Ametzaga-Arregi, Lorena Peña. Effect of the rotation frequency in the eucalypt plantations[J]. Forest Ecosystems, 2024, 11(1): 100251. DOI: 10.1016/j.fecs.2024.100251
Citation:
Unai Sertutxa, Unai Ortega-Barrueta, Ibone Ametzaga-Arregi, Lorena Peña. Effect of the rotation frequency in the eucalypt plantations[J]. Forest Ecosystems, 2024, 11(1): 100251. DOI: 10.1016/j.fecs.2024.100251
Plant Biology and Ecology Department, Faculty of Science and Technology, University of the Basque Country (UPV/EHU), Barrio Sarriena, s/n, 48940, Leioa, Biscay, Spain
In the last century, eucalypt plantations are increasing all over the world. Concretely, in the Basque Country (northern Iberian Peninsula), 7% of pine plantations have been recently substituted by eucalypt plantations, where little is known about their ecological impact on soil and plant diversity. However, the most relevant impact is due to forest management, as Eucalyptus globulus Labill. plantations have a short harvesting cycle, 12–15 years rotations. In fact, the species is able to regenerate from stumps; therefore, those plantations are replanted after 3–4 rotations. This type of invasive and frequent management could lead to further adverse effects on the ecosystem. The aim of this study was to characterise and compare the eucalypt plantations newly established (New: never been harvested) with older ones (Old: several times harvested and grown from stumps), having been established for at least 35 years, and to identify the primary factors that could influence the richness and diversity of vascular plant species in those plantations. The results indicated that both plantations exhibited comparable characteristics with respect to deadwood (volume and decay stage) and tree size and density. However, the Old plantations exhibited higher forest heterogeneity, pH, and higher shrub and herb richness and diversity. Overall, generalist and invasive species were found in the New plantations, while in the Old plantations, typical species of the native forests were also observed. The factor that influenced plant diversity was the volume of deadwood. Regarding life forms, higher altitude and proximity to watercourses favoured tree diversity; and lower canopy cover, shrub diversity. In conclusion, the longer the plantation has been established, the greater the number of species that are able to survive and adapt. This is probably due to the fact that management disturbance is specific and not sufficient to remove the already established plants and the soil seed bank.
In the last century, plantations of Eucalyptus species are increasing all over the world (Florêncio et al., 2022; Martins et al., 2022), as this genus offers exceptional growth rates and profitability for timber industry (Wang et al., 2023). The ability of these plantations to develop on poor soils has been fundamental to its success in different parts of the world (South Africa, India, Brazil, California, Portugal and Spain). In Europe, eucalyptus was first introduced in England and then to Italy between 1,771 and 1,774. Nowadays, Eucalyptus plantations in southern Europe occupy an approximate area of 1.3 million ha, multiplying by four the area existing in 1970 (Deus et al., 2018). Although it is also present in France and Italy (Cerasoli et al., 2016), its presence is mainly in the Iberian Peninsula (more than 80%). The species arrived in Portugal in 1829 and in Spain in 1850 (Silva-Pando, 2022). The climate and soil conditions were ideal for its growth, leading to its notable expansion from the 1960s. In 1965, eucalyptus trees covered 140,000 ha in Portugal and 102,000 ha in Spain. By 2015, these areas had increased to 811,943 and 820,141 ha, respectively (Silva-Pando, 2022). In Spain, most of those plantations are located in Galicia (248,169 ha in 2015) (Barrio-Anta et al., 2021; Teixeira et al., 2023), although, in nearby northern regions (Asturias, Cantabria and the Basque Country) are also rapidly increasing (López-Sánchez et al., 2021). Concretely, in the Basque Country, the area of those plantations has doubled from 13,023 ha in 2005 to 26,152 ha in 2023, only 14%–19% being in public land. This is due to the substitution of pine plantations (7%), the most abundant plantations in the territory (36% of forest surface) by eucalypt plantations (Gobierno Vasco, 2023a). In this area, pine plantations have been affected by the fungus that causes brown and red band diseases, thus decreasing their value. As a result, owners have turned to eucalyptus plantations produced for feed pulp and paper markets.
However, the most relevant impact is due to forest management, as the felling of the mature trees interrupts the cycle of forest ecosystem functioning (Cateau et al., 2015). Furthermore, the exploitation is highly mechanised and intensive, utilising processors and requiring the construction of multiple extraction routes (Veiras and Soto, 2011). This process may result in soil damage, compaction, and the removal of vegetation (Asif et al., 2023; Martins et al., 2023), increasing soil erosion, currently a critical concern (Kort et al., 1998; Brempong et al., 2023). In fact, clear cutting results in adverse effects such as the elimination of numerous native tree and shrub species (Wen et al., 2010; Aszalós et al., 2023), the colonisation of alien species (Angiolini et al., 2023), the alteration of soil characteristics (Edeso et al., 1998; Rozas, 2005) and the reduction of the amount of deadwood (Seibold and Thorn, 2018). According to Johnson and Curtis (2001), complete clear-cutting of the tree reduces soil carbon on an average of 6%. Moreover, when forest plantations are cleared, all trees and large branches are removed, leaving only the small branches (Merganičová et al., 2012; Ranius et al., 2018). Therefore, the amount of deadwood that can accumulate in plantations is small, which influences biodiversity (Burrascano et al., 2008; Oettel et al., 2020), as deadwood is essential niche for saproxylic species (Seibold and Thorn, 2018). Moreover, the amount and decay state of deadwood in an ecosystem is an important indicator of its maturity (Martin et al., 2021), just like heterogeneity in the forest structure (Onaindia et al., 2004). Some studies also indicate that slope, altitude and nearby freshwater sources such as, rivers, streams, and lakes could influence plant species composition, richness and diversity in forest plantations (Nobis et al., 2016; Zhang et al., 2018; Wani et al., 2023).
The impact of management practices on soil and biodiversity depends greatly on the climatic, geographical and social context, which shows the need for local studies (Deus et al., 2018). In the Basque Country, the age at which forest plantations are harvested varies significantly among different species. For example, native species such as Quercus robur, which represents the potential native vegetation of this area, has a slow growth and rotations of up to 100 years. In contrast, Pinus radiata D. Don, the most planted tree in the Basque Country, has approximately 35–40 years rotation (Onaindia et al., 2013) and Eucalyptus globulus Labill. plantations have a short harvesting cycle, 12–15 years rotations (Bravo and Ortuzar, 2012). Moreover, the eucalyptus is capable of regenerating from stumps after being cut down; therefore, its plantations generally are replanted after 3–4 rotations (FAO, 1981). This means that individuals remain with the same root system during 36–46 years, until they are pulled out (da Silva et al., 2020). This type of invasive and frequent management carried out in those plantations (short rotations) could result in more adverse effects than in plantations where frequency of rotation is lower (FAO, 1995; Merino et al., 2005; Augustynczik et al., 2024). Nevertheless, there is a significant knowledge gap in relation to the potential impact produced by the number of rotations carried out in eucalypt plantations. Therefore, the aim of this study is to characterise and compare the eucalypt plantations newly established (New: never been harvested) with older ones (Old: several times harvested and grown from stumps and established for at least 35 years). Thus, stand characteristics, vascular plant diversity and species composition, forest structure, soil characteristics and deadwood will be analysed and compared. We also aimed to identify the primary factors that influence the richness and diversity of vascular plant species in those plantations.
We hypothesise that the negative impact in those analysed variables are more severe in the older plantations due to the compaction and the alteration of the physical soil properties (Cambi et al., 2015; Karami et al., 2023) by the most frequent use of machinery to harvest the trees.
2.
Methods
2.1
Study area
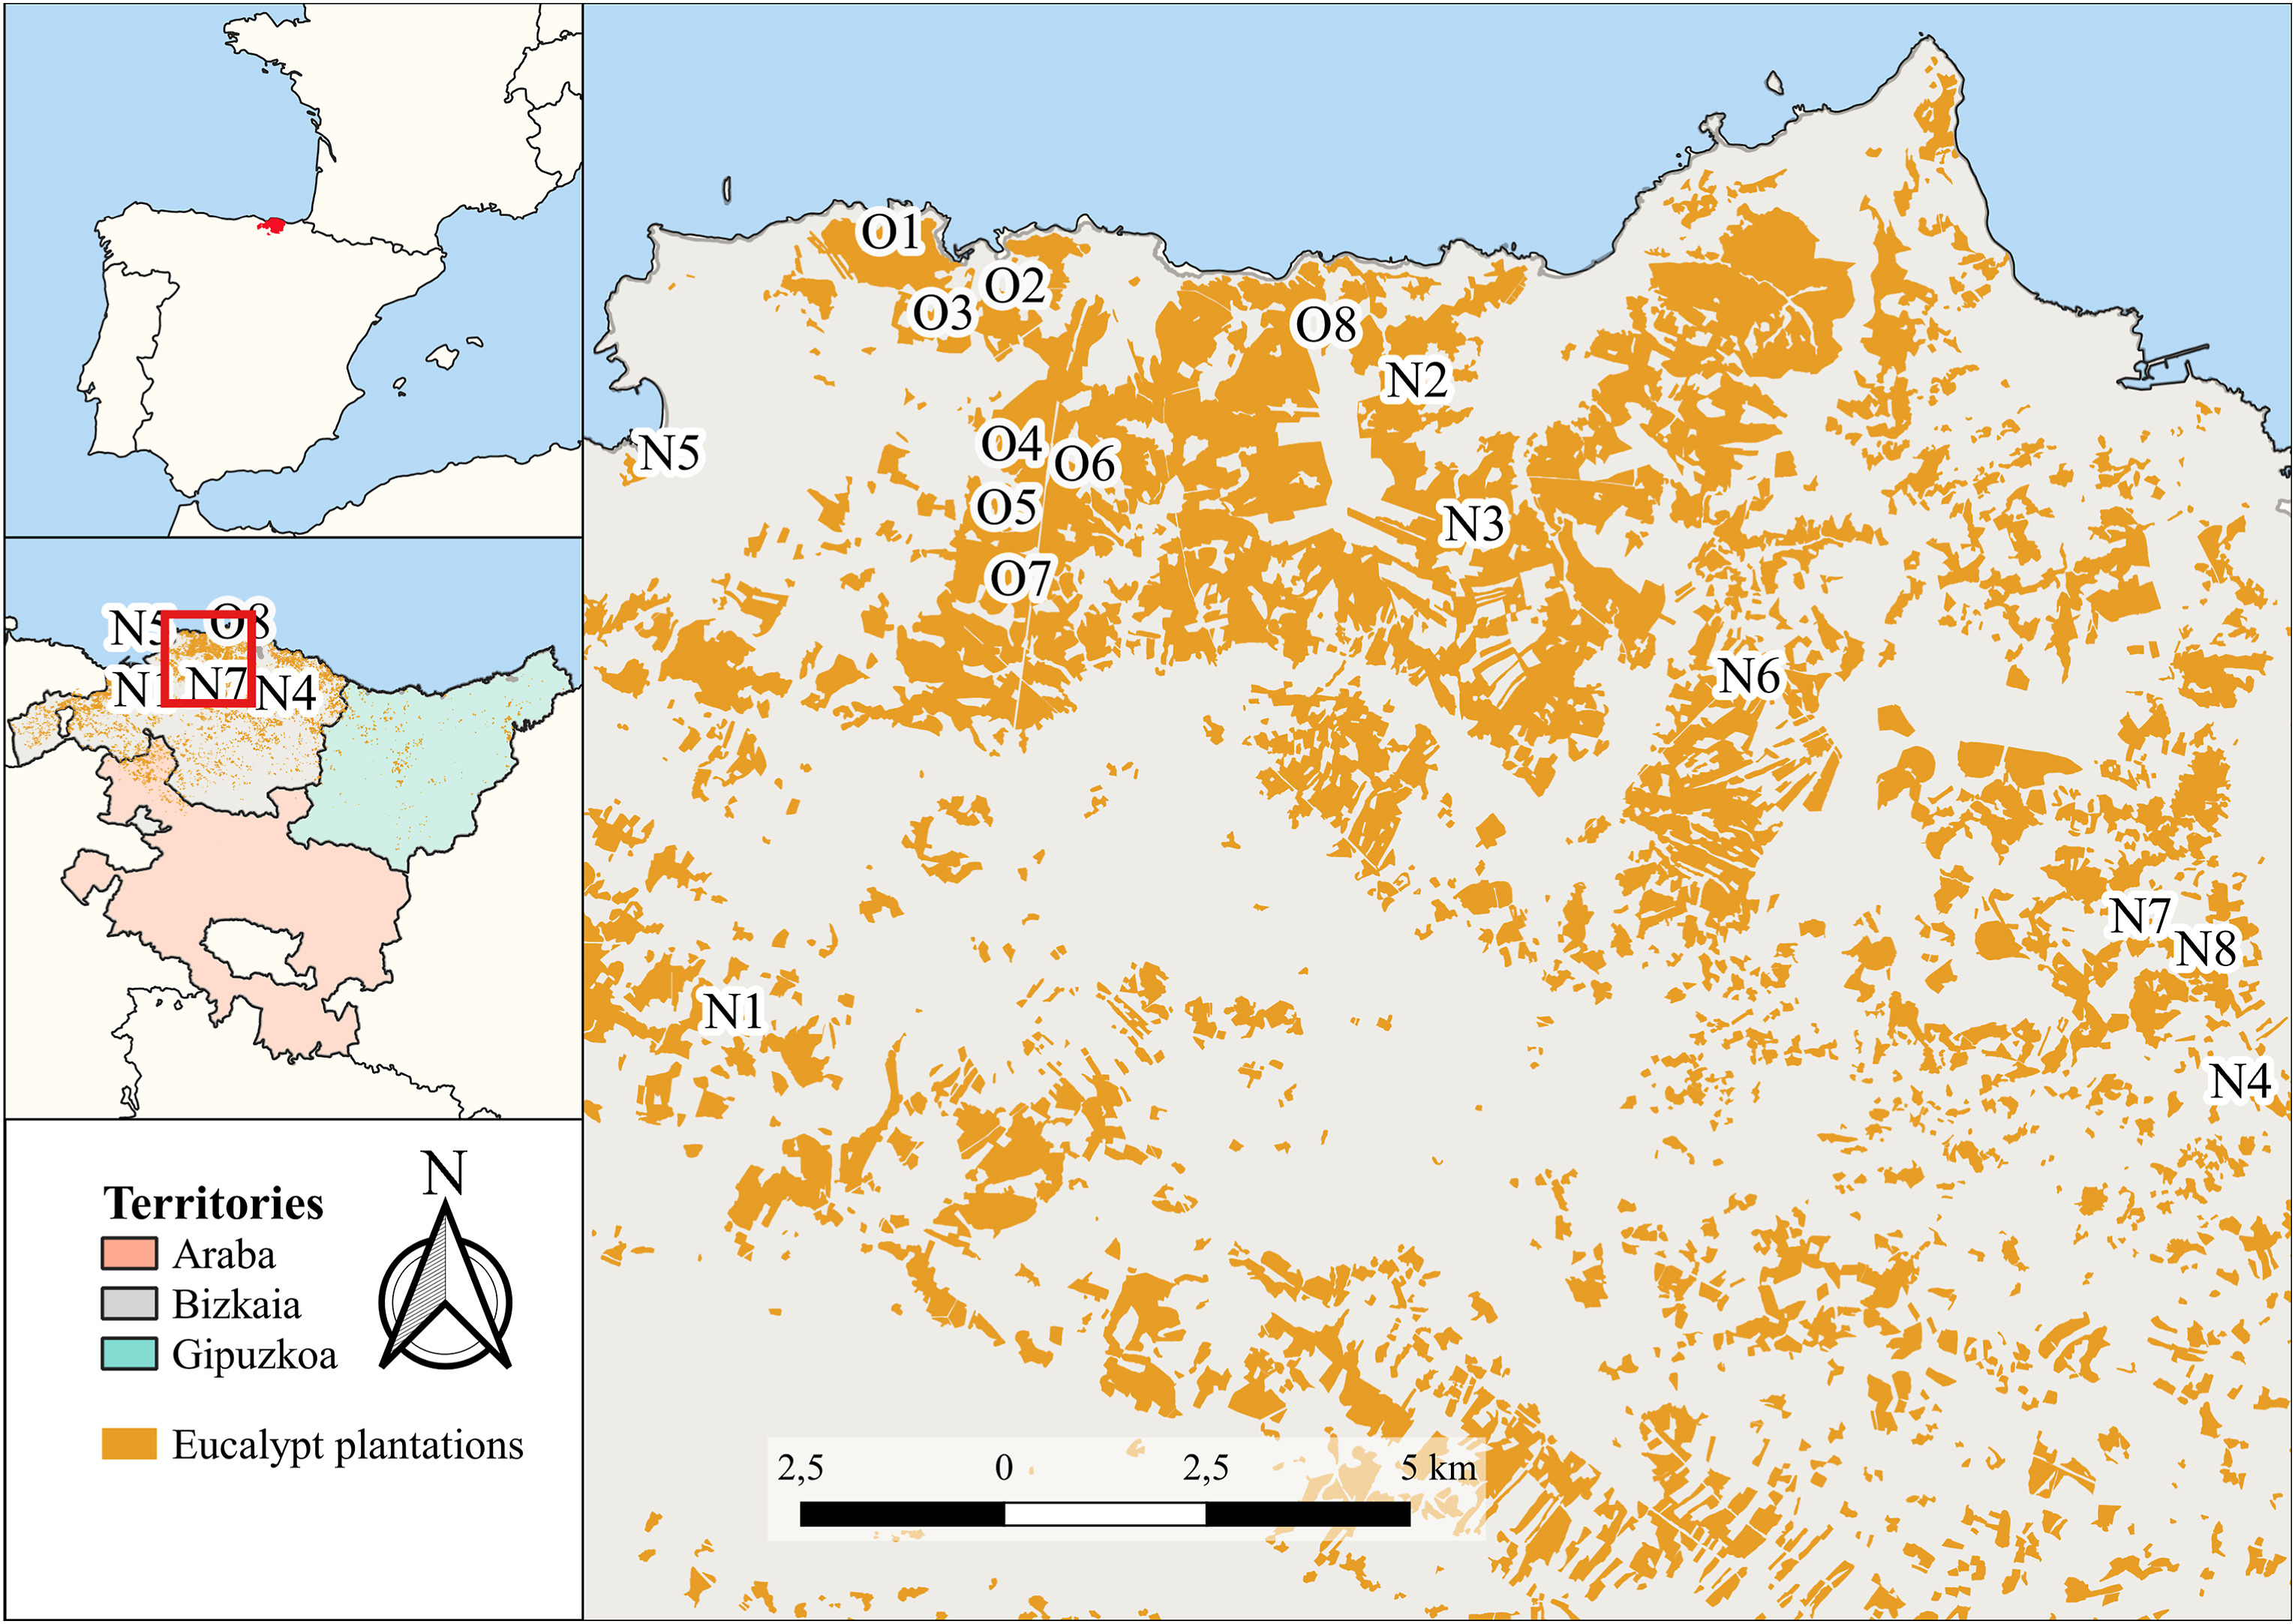
The study was carried out in the coast of Biscay, the northwest of the Basque Country (northern Iberian Peninsula), where 88% of eucalypt plantations of this province are located (Gobierno Vasco, 2023a) (Fig. 1). The climate in the area is temperate Atlantic, with a mean annual rainfall of 1,200 mm and a mean annual temperature of 12 ℃. The density of aquatic systems in Biscay is very high, so 64% of those plantations are actually located to a distance less than 100 m to the nearest body of water. The native vegetation is composed of mixed-oak woodlands, with a canopy dominated by Q. robur, Fraxinus excelsior, and Crataegus monogyna and it is the potential vegetation of a great part of the territory (Loidi et al., 2011). However, in the 1950s industrialisation in the area initiated a crisis in the rural regions that resulted in farm abandonment and the spread of fast growing P. radiata plantations. Therefore, deforested areas due to high demand for wood used in charcoal and timber production were forested by P. radiata plantations, resulting in highly fragmented native forests. Nowadays, native forests occupy only 14.41%, while P. radiata plantations occupy 24.61% of the area (Gobierno Vasco, 2023a). However, in recent years, P. radiata plantations have been replaced by eucalypt plantations (7.34% of the area of P. radiata in 2005). In this region, E. globulus and Eucalyptus nitens Maiden, are the most commonly planted species (Fig. 1). Since E. globulus was the first most planted Eucalyptus species in the Basque Country, the oldest stands of eucalypt plantations are of this species. Consequently, only stands of this species were selected for the present study.
Figure
1.
Distribution of sampling points and plantations of Eucalyptus species in the Basque Country. Orange patches represent the eucalypt plantations. The sampling points are displayed with a letter and a number. The Old plantations are represented by an “O” and the New by an “N”. The number indicates the point's group number. (For interpretation of the references to colour in this figure legend, the reader is referred to the Web version of this article.)
We randomly selected 16 E. globulus stands (Fig. 1): 8 planted at least 35 years ago, suggesting that they were likely harvested at least twice within this period (Old) and 8 stands recently established, thus, they had never been harvested (New). To select those eucalypt plantations, and in order to be sure about their age, we examined orthophotos taken in 1984–1985, 1991, 2001, 2008, 2011 and 2021, and the cartography of the Forest Inventory of the Basque Country (Gobierno Vasco, 2022). Old eucalyptus plantations were sites that since 1984 had been considered as eucalyptus plantations, and those considered New were those only having eucalyptus plantations in 2011 and 2021. Old plantations are situated in close proximity to one another, as the first eucalyptus plantations were located within the same geographical area, situated near the coast, where the environmental conditions were optimal for that species. Subsequently, New plantations were extended to adjacent areas, as owners have historically been influenced by the species planted by their neighbours when selecting the species to use for the plantation.
The characteristics of the stands were similar in all cases. They were between 5 and 10 ha in size, situated at altitudes down to 300 m, located above detritic rocks that alternate between limestone and sandstone, the depth of the regolith was of 0.5–1.0 m, and the percentage of native forest cover in a buffer zone of 250 m ranged from 0 to 20% (Martello et al., 2023). Two of the New plantations were located only above limestone and one of them had the depth of the regolith of 0–0.5 m (Appendix A).
The management of the stands were also similar in all of them. In the Basque Country, once the trees have been planted, no further interventions are undertaken, such as thinning or the removal of shrubs or small trees, as trees grow in a straight upward trajectory and lose branches by themselves. People in neighbouring communities do not collect those branches for fuel, as in the case of native forests. After a period of 12–15 years, the harvesting of the trees is conducted using the clear-cut method, whereby all wood is extracted. Subsequently, the trees sprout vigorously from their stumps with some stems, from which only one is selected to grow, while the rest are removed.
2.3
Sampling design
Sampling was performed between June and July 2022. In each stand, one sample plot was established in the centre of the stand, to avoid the edge effect, and two transects of 50 m were placed perpendicularly (Brower and Zar, 1977), one in parallel to the slope and the other perpendicularly. In each transect, we established five plots of 5 m × 2 m (9 plots of 10 m2) separated by a distance of 5 m. The centre plot was common to both transects.
In each plot, plant species were identified and classified into four groups according to their life forms: trees, shrubs, herbs, and ferns (Aizpuru et al., 1999). The grass species present were not identified, but rather noted when different species were observed. The coverage of each species was calculated through visual estimation in 5 layers: 0–0.2, 0.2–1.0, 1.0–3.0, 3.0–7.0 m, and more than 7.0 m (Lindgren and Sullivan, 2001; Onaindia et al., 2004). For all the species and the different life forms, species richness and Shannon diversity index were calculated.
Moreover, in five plots, located in the four corners and centre of both transects, a soil sample from the upper 15 cm was collected with a core after removal of the litter layer and transported to the laboratory to measure pH and soil organic matter (SOM) (Brower and Zar, 1977). Plot values were pooled to determine the stand mean value.
All deadwood (diameter >2 cm) intersected in the parallel transect was also counted. We recorded the length, width, and stage of decomposition for each piece (grading from 1 to 5, where 5 indicates the most advanced decomposition (Rahman et al., 2008)). Then, the total volume per hectare of deadwood (V=(π2/8L)∑d2) (m3·ha−1) and the total volume per hectare at each stage of decomposition (V=(π2/8L)∑(nid2i)) (m3·ha−1) were calculated (Harmon et al., 1986; Marshall et al., 2003). L refers to the transect length, d refers to the mean diameter of deadwood pieces, di is the mean diameter of pieces at decay stage i, and ni is the number of deadwood pieces at decay stage i.
At the 15, 30, and 45-m plots of the parallel transect, the variables for the forest structure were measured using the point-centred quarter method (Brower and Zar, 1977; Peña et al., 2011). The tree height (h, m), diameter (DBH, cm), and distance from the centre point (D) were measured. With those data, the tree density (Dh=10000/D2) (trees per ha) and the basal area per hectare (ABha=π(DBH2/4)×Dh) (m2·ha−1) were calculated (Mostacedo and Fredericksen, 2000). Furthermore, values for the heterogeneity of forest structure were obtained by computing the coefficient of variation for height, diameter, and the distance to the centre of the square as the heterogeneity of the density (Alamgir et al., 2016).
Finally, we characterised the stand calculating its slope (° of the slope), elevation (altitude in m), and the minimum distance to the nearest body of water (m) from the centre of the sampling point. We computed the mean slope and elevation within a 25-m radius surrounding the centre of the sampling point and the minimum distance to the nearest body of water from the centre of the sampling point, using a digital terrain model (Gobierno Vasco, 2020) and GeoEuskadi BTA dataset (Gobierno Vasco, 2023b), respectively, in the software QGIS (2022, http://www.qgis.org) (version 3.22.14-Białowieża).
2.4
Statistical analyses
Firstly, we checked the normality and homoscedasticity of the following variables: vascular plant richness and diversity (in both cases, total and for the four groups), tree density, height, diameter, basal area, heterogeneity of forest structure, SOM and pH. Subsequently, we conducted statistical tests to compare those variables between New and Old eucalypt plantations. For variables that their data showed a normal distribution and homoscedasticity, we performed a t-test, while for variables with heteroscedasticity, we used a t-test with the Welch approximation. For variables that did not show a normal distribution, but were homoscedastic, we performed the Wilcoxon-Mann-Whitney test, and for non-normal and heteroscedastic variables, we applied Yuen's robust test.
Additionally, we conducted a detrended correspondence analysis (DCA) to analyse the similarity between the types of plantations in relation to their species composition. E. globulus was excluded from this analysis, as it was the dominant species and almost the only large tree in the plots. For each species in each stand, we used the maximum of the 9 cover values to minimise differences between species that appeared frequently and those that were rare. When a species was absent from a plot, it was assigned a value of 0.
To identify the soil factors and forest structure that most influence the richness and diversity of plant species (all plants, trees, shrubs, herbs, and ferns) we performed Bayesian hierarchical models using the Old-New distinction as the random effect. Generally, forest structure factors are highly correlated among them, so only those factors that were no correlated were selected to include in the model to avoid collinearity. Those correlations were checked using Pearson's correlation coefficient. The results showed that there was a significant correlation between tree diameter and basal area (t = 2.816, p = 0.014), tree diameter and tree height (t = 5.954, p < 0.001), basal area and tree density (t = 2.8957, p = 0.012), and basal area and tree height (t = 2.712, p = 0.017). However, there was no significant correlation between tree diameter and tree density (t = −0.948, p = 0.359), and tree density and tree height (t = −0.357, p = 0.727). Thus, tree density and height were used for the analysis.
Later, we conducted a vif analysis to know if the explanatory variables (tree density, tree height, tree canopy cover, pH, SOM, slope, altitude, distance to water, and volume of deadwood) were correlated among them. None of the values exceeded the limit value, so there was no support for collinearity among explanatory variables. In the case of models of trees, we did not include tree density, tree height and tree canopy cover as covariates. We standardised all the variables by subtracting their mean and dividing by their standard deviation.
Subsequently, for performing the Bayesian hierarchical models, we used uninformative priors, as we had insufficient prior information of the response variables, which were the richness and diversity of plant species (all plants, trees, shrubs, herbs, and ferns). For richness models, after checking for overdispersion, a Poisson distribution was used due to the count nature of the data; while, for diversity models, we used a gamma distribution, as they were positive values with decimals. In the case of herb and fern diversities, we decided not to compute models for diversity, as there were many zeros in the data to account enough variation. In both cases, we began with the most complex model, eliminating the variable with lowest significance per step, until we reached the model with all the variables demonstrating significant effects on the response variables. We used the widely applicable information criterion (WAIC) (Watanabe, 2010) to compare the performance of the models. The models with the lowest WAIC were then chosen as the best models. We also calculated Bayesian p-values (posterior predictive checks) to evaluate the fit of the created models (Ghosh et al., 2006). We calculated posterior predictive checks for the mean for all models. All the statistical analyses were performed with RStudio Team (2022) (version 2022.12.0.353).
3.
Results
3.1
Characterisation and comparison between plantations
The stand characteristics showed no significant differences between both types of plantation in terms of altitude, slope, and proximity to watercourses (t = 0.686, p = 0.503; t = 0.099, p = 0.922; t = 0.034, p = 0.974; respectively) (Appendix B).
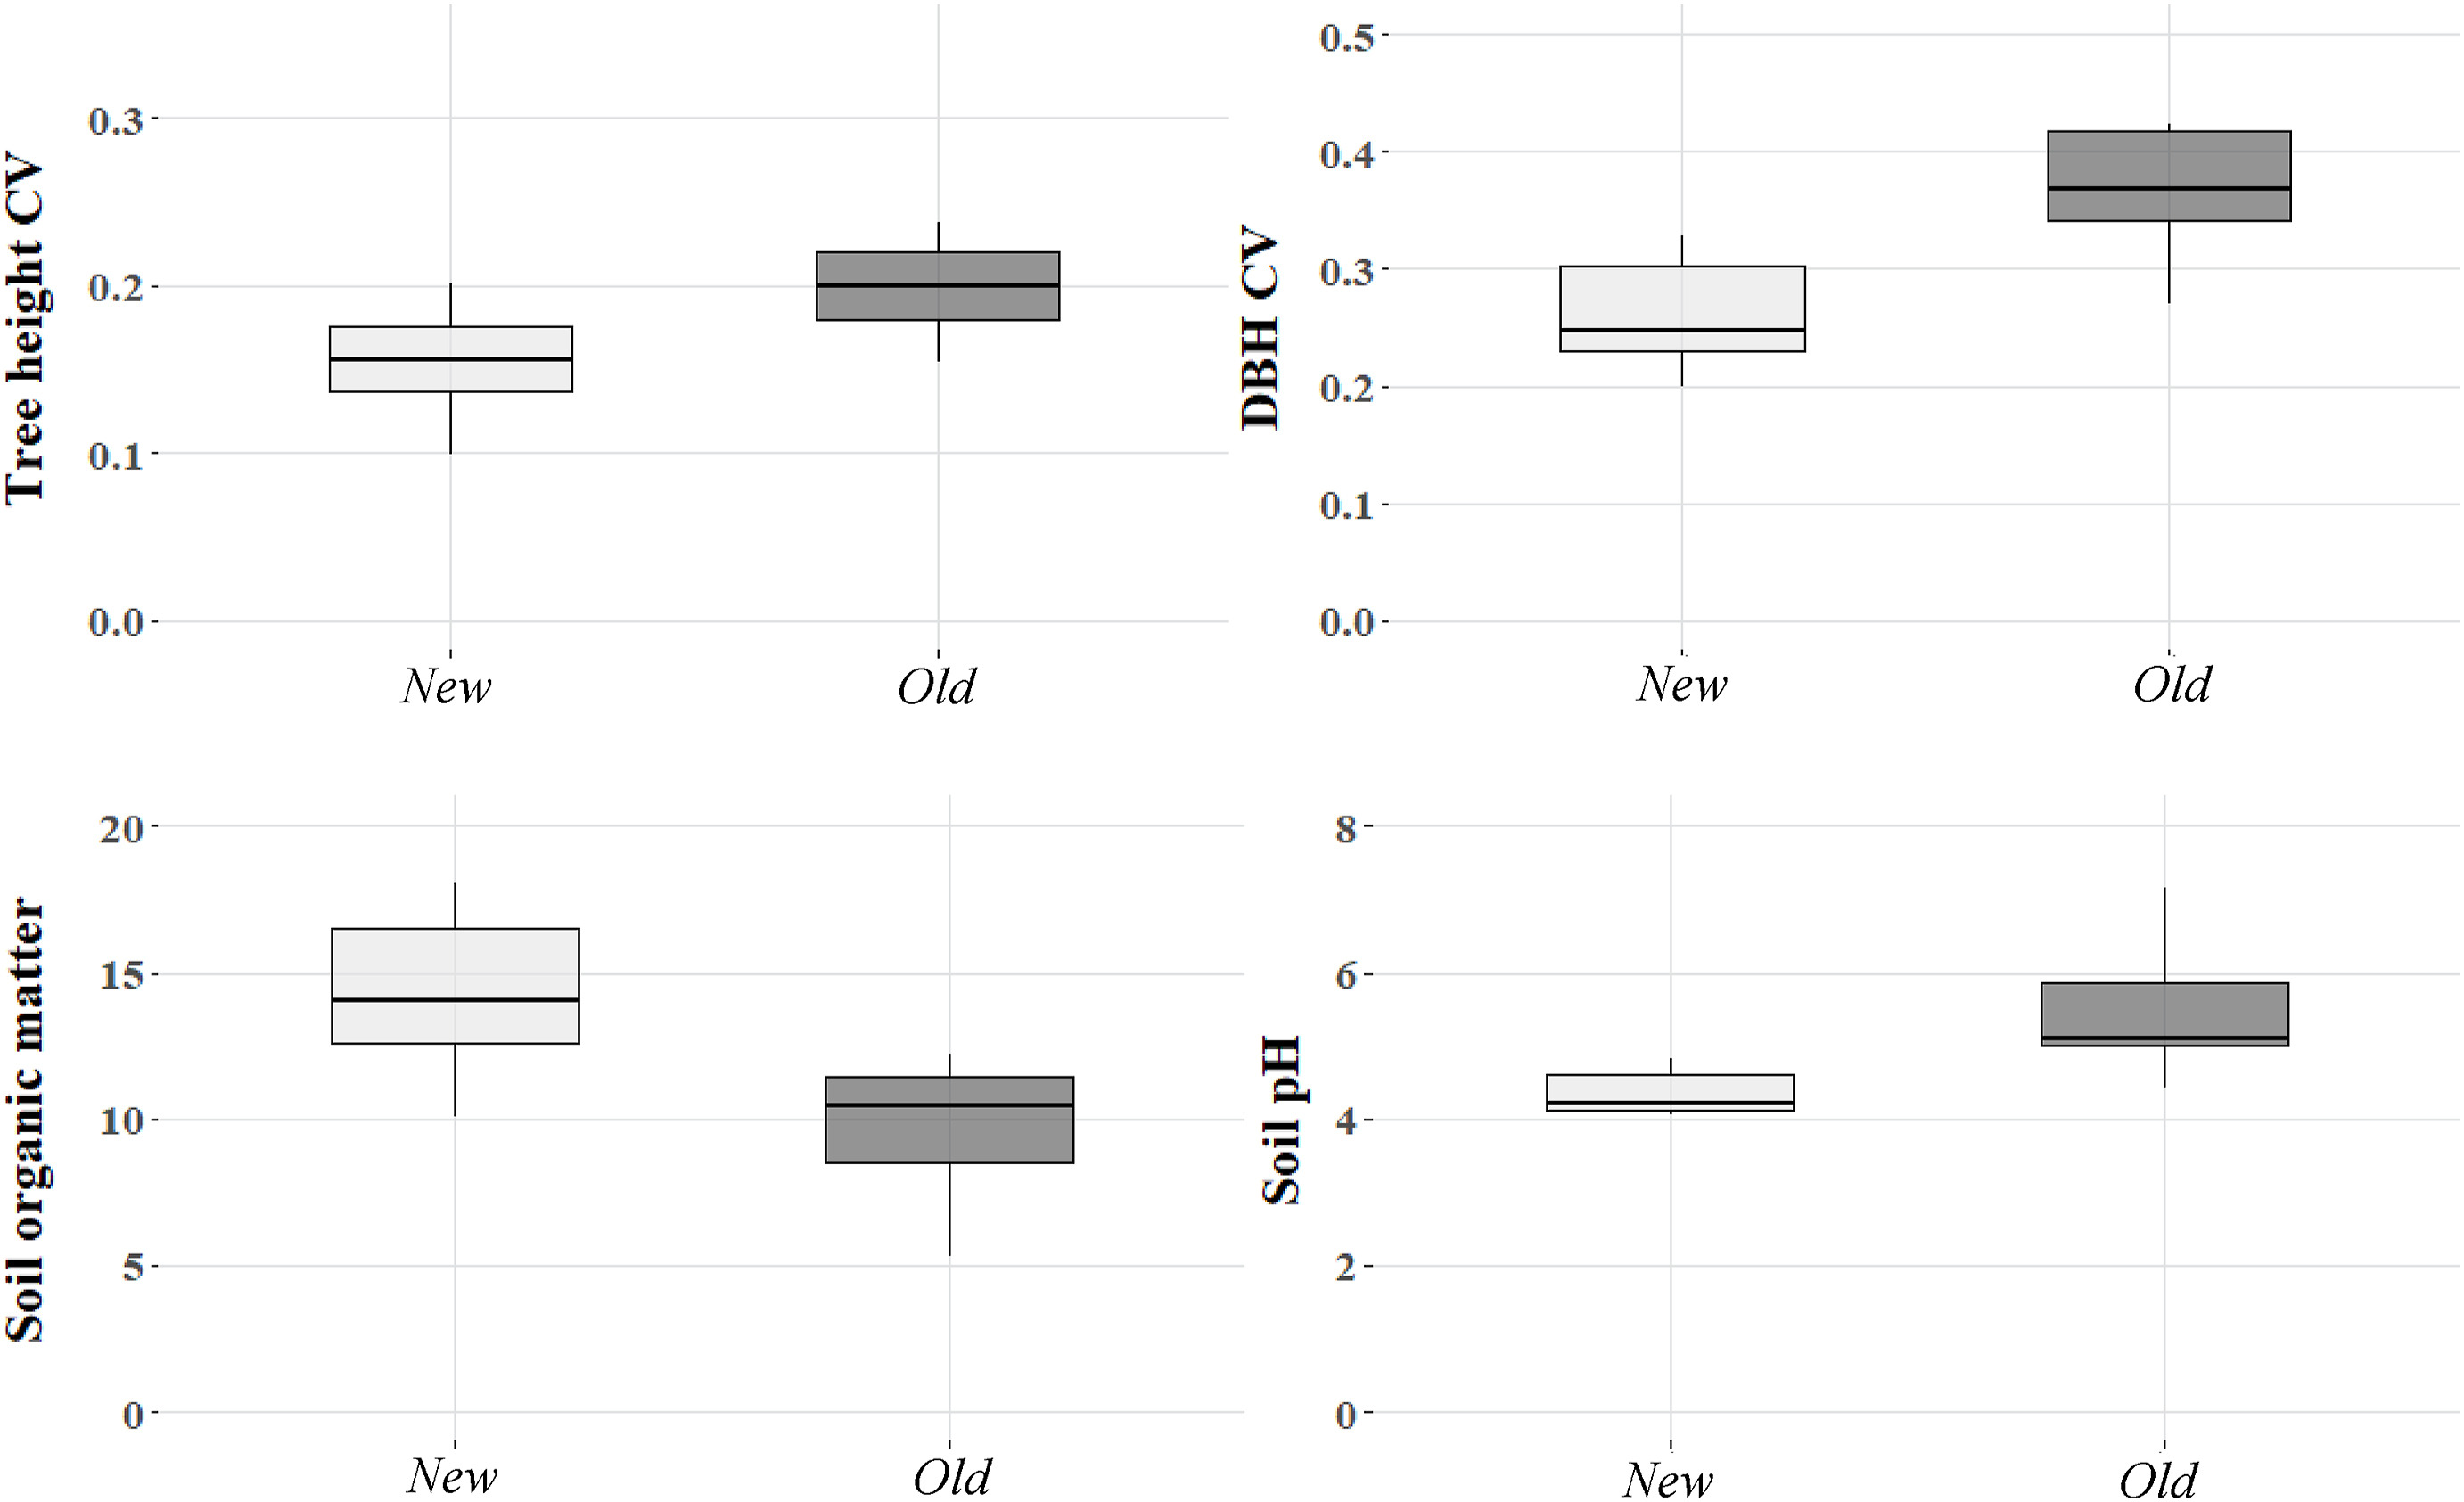
Regarding forest structure, analysed variables (tree density, tree height, basal area, and DBH) did not show significant differences between both types of plantations (W = 38, p = 0.574; t = 1.384, p = 0.188; t = 2.056, p = 0.059; t = 1.320, p = 0.208; respectively). However, the coefficient variation in height (t = −2.838, p = 0.013) and in DBH (t = −4.250, p < 0.001) were significantly higher in Old plantations (Fig. 3), but not the coefficient variation of the distance to the centre of the square (t = −2.044, p = 0.060) (Appendix B).
Figure
2.
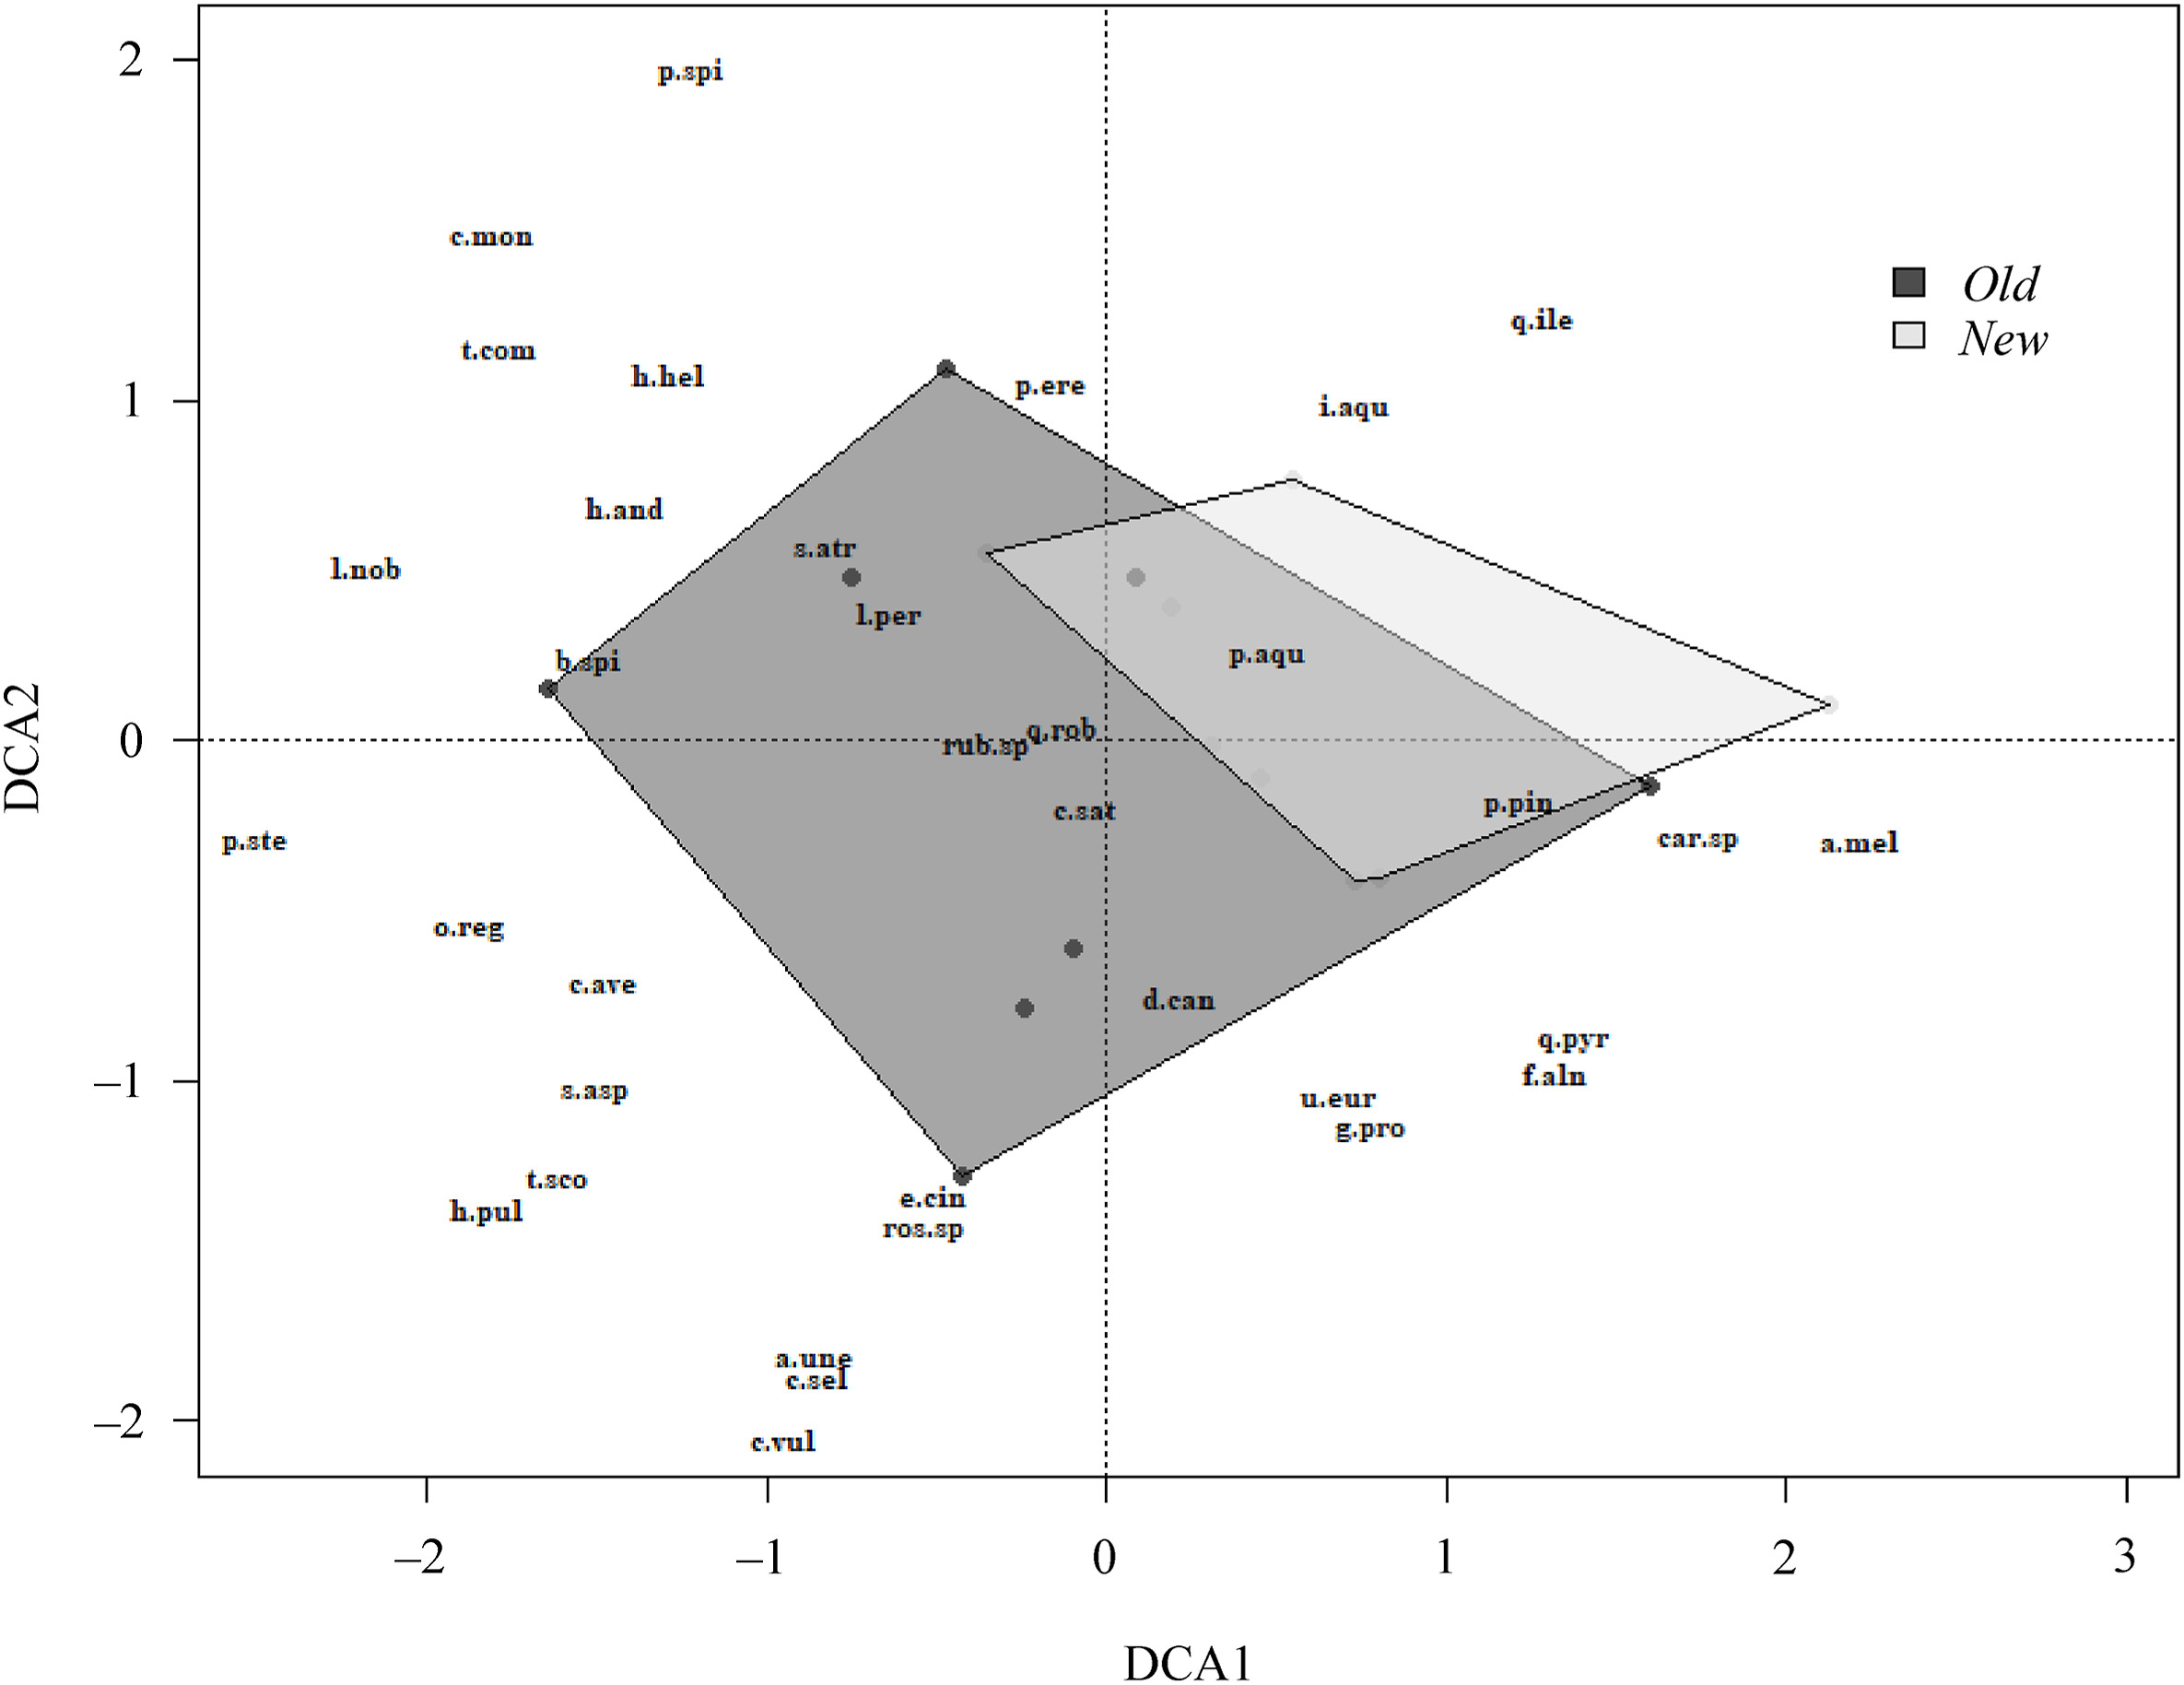
Detrended correspondence analysis (DCA) for plant species composition in Old (dark points) and New (light points) eucalyptus plantations.
Figure
3.
Coefficient variation (CV) of tree height and DBH, soil organic matter and soil pH in Old and New plantations. All the showing variables were significantly different.
In relation to vegetation, 43 vascular plant species were recorded (Appendix C), of which 39 were found in Old plantations and 26 in New ones with an average richness of 14.88 ± 4.22 and 10.50 ± 0.53 per plot, respectively. Pteridium aquilinum, Ulex sp., and Rubus sp. were the most abundant species (9.40 ± 1.49; 8.90 ± 1.53; 8.79 ± 1.53, respectively) and Pteridium aquilinum and Rubus sp. (in 15 sites), Daboecia cantabrica (in 14 sites), and Ulex sp. and Quercus robur (in 13 sites) were the most frequent species in the plantations (similarity of 0.51, Jaccard index) (Appendix C). Moreover, 22 species were present in both types of plantations, 17 were only found in Old plantations (herbs: Teucrium scorodonia and Cortaderia selloana, and shrubs: Arbutus unedo and Tamus communis were the most common), and 4 only in New plantations (shrubs: Frangula alnus and Ilex aquifolium, tree: Quercus pyrenaica, and fern: Dryopteris affinis) (Appendix C). The DCA results suggested that the Old plantations exhibit greater dissimilarity among them in relation to species composition than the New plantations, and the majority of the New ones fell within the area encompassed by the Old stands (Fig. 2). Generalist species such as Pteridium aquilinum were predominantly found around or close to the New plantations. Conversely, the non-generalist species such as Hypericum pulchrum or Teucrium scorodonia were primarily found farther away from the New stands and closer to some Old ones.
Additionally, the overall plant richness and diversity were significantly higher in Old plantations than in New ones. The richness and diversity of shrubs and herbs were also significantly higher in Old plantations, while no differences in trees and ferns were observed (Table 1).
Table
1.
Plant species richness and diversity (mean ± standard error) comparison in Old and New eucalyptus plantations and significant values (p-value). +: t-test; ++: Wilcoxon-Mann-Whitney test; +++: Yuen's robust test; **p ≤ 0.01; *p ≤ 0.05.
Finally, soil properties showed that Old plantations had a significantly higher pH than New ones (W = 3, p = 0.001), while the quantity of SOM was significantly higher in the New plantations (t = 3.541, p = 0.003) (Fig. 3). Moreover, the total volume of deadwood (DW) and the volumes of each decomposition stage did not differ between both types of plantations (DW: W = 26, p = 0.563; DW1: W = 37, p = 0.630; DW2: W = 22.5, p = 0.344; DW3: W = 36.5, p = 0.629; DW4: W = 26, p = 0.546; DW5: W = 24.5, p = 0.334) (Appendix B).
3.2
Drivers of plant species richness and diversity
We found no significant differences in the random effect (differences between the New and Old plantations) to explain plant richness and diversity in any of the models. All generated models for each explanatory variable with their WAIC, DIC, and Bayesian p-values are in Appendix D.
3.2.1
Species richness models
Although different covariates (SOM, pH, and distance to watercourses) were used to fit the optimal models for explaining plant species richness (overall, trees, shrubs, herbs, and ferns), none of them showed a significant effect on species richness (Appendix E).
3.2.2
Species diversity models
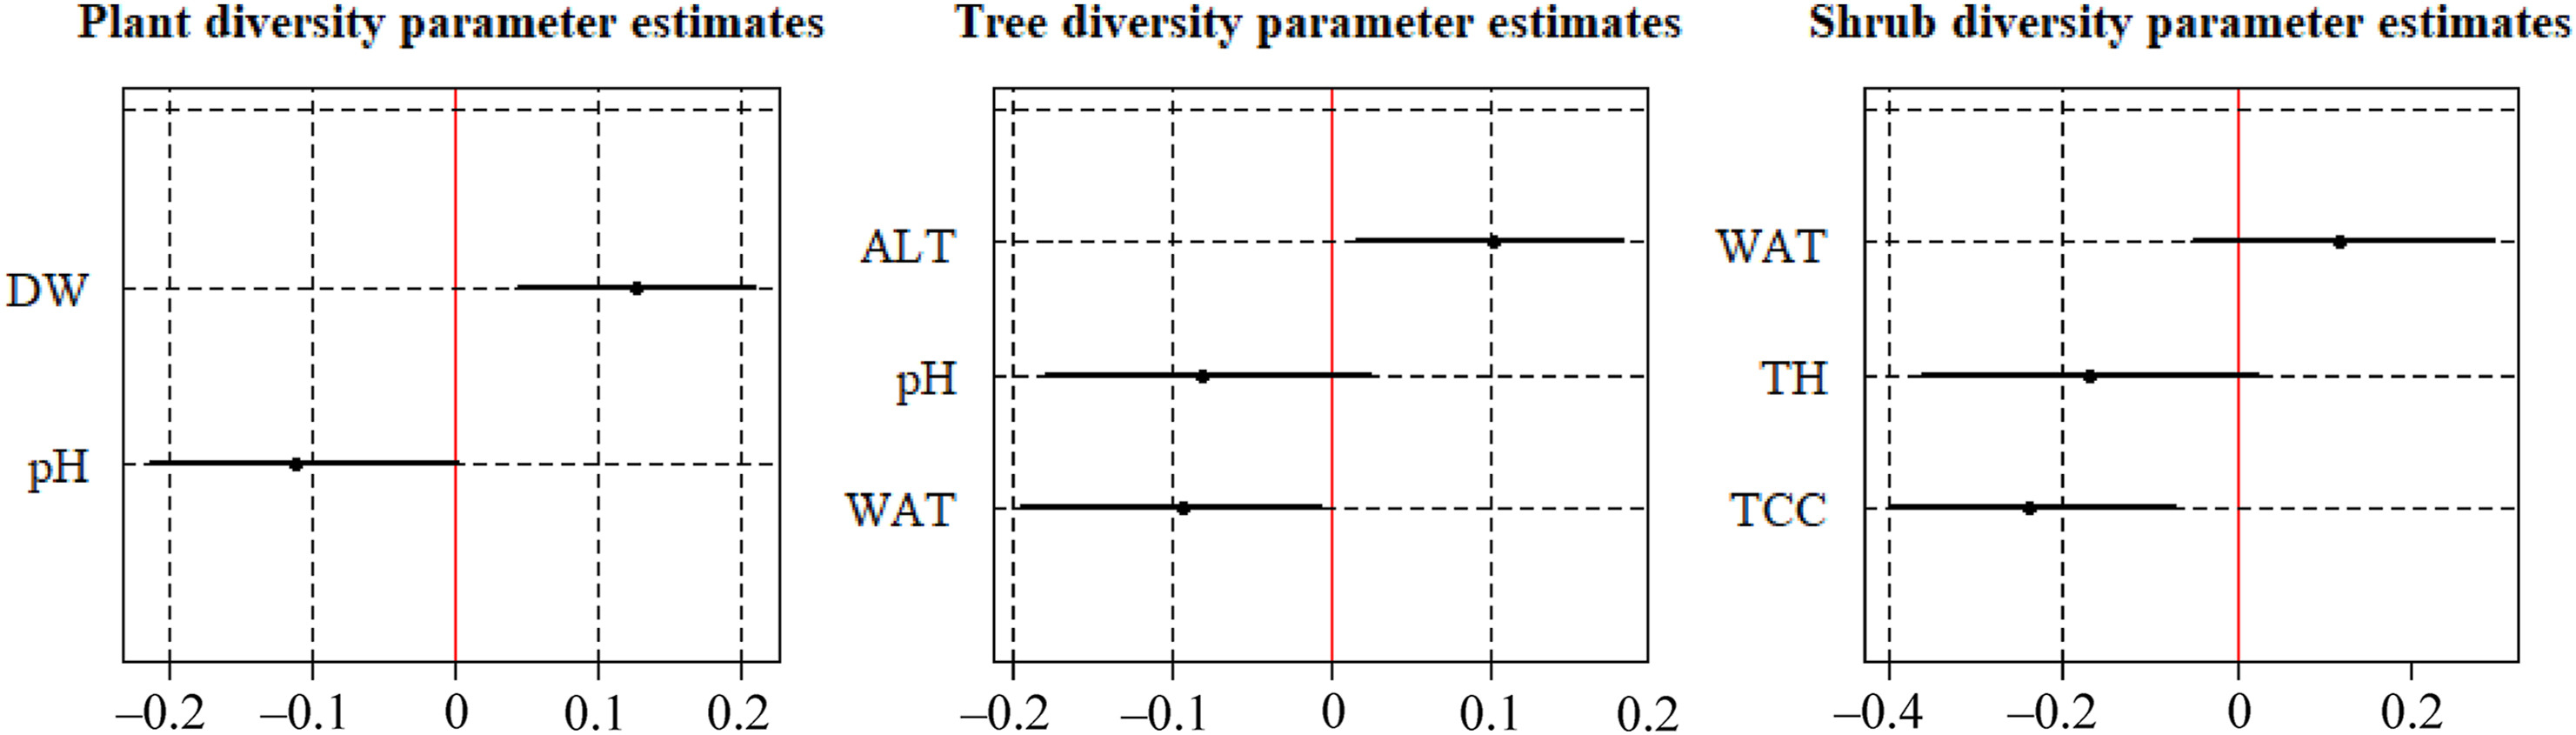
In this case, the total volume of deadwood showed a significantly positive impact on plant diversity (Fig. 4).
Figure
4.
Values of the covariates of the models that had at least one variable with a significant effect on vegetation. The red line indicates the zero value. The points correspond to the mean values of the distributions of the covariates, and the black lines represent the credible intervals (95%) of them. We considered that if the zero value fell outside the credible intervals, the covariate significantly affected the response variable. Total deadwood volume (DW), soil pH (pH), mean altitude of the sampling point (ALT), minimum distance from the point to a watercourse (WAT), mean tree height (TH) and tree canopy cover (TCC). (For interpretation of the references to colour in this figure legend, the reader is referred to the Web version of this article.)
For trees, the distance to watercourses had a significantly negative impact on their diversity, and altitude had a significantly positive impact (Fig. 4). Therefore, in areas with shorter distance to watercourses and higher altitude, tree diversity is higher.
The model for shrub diversity incorporated the covariates of tree height, distance to watercourses, and tree canopy cover, but only the last one had a significantly negative effect on it (Fig. 4). This means that higher tree canopy cover in the plantation resulted in lower shrub diversity.
4.
Discussion
4.1
How different are the Old and New plantations?
4.1.1
Forest structure
Forest structure did not differ between plantation types, and especially in this case where trees in Old plantations have regrown from stumps, thus, resulting in a similar density as before felling. Hence, tree density remains relatively constant until stumps are cleared. However, forest heterogeneity was affected by the establishment time, as Old plantations had higher ranges of tree size and tree spacing, showing a higher forest heterogeneity and a higher plant richness and diversity (Onaindia et al., 2013).
4.1.2
Plant diversity and composition
The richness and diversity of shrubs and herbs were significantly higher in Old plantations; while, they were poorer than in native forests (Bas López et al., 2018; Goded et al., 2019) or exotic pine plantations (Onaindia et al., 2013). In this study, 9 shrubs and 7 herbs species were only found in Old plantations. Shrubs, typical of the native forests, such as Arbutus unedo, Crataegus monogyna, Calluna vulgaris, Erica vagans, Prunus spinosa, Rosa sp., Rubia peregrina, and Tamus communis were found in them (Loidi et al., 2011), and some herbs such as, Carex pendula, Hypericum pulchrum, Potentilla erecta, Potentilla sterilis, and Teucrium scorodonia. Therefore, species that live in the surrounding forests or persist in the seed bank have more time to colonise, establish themselves and adapt to those conditions (Onaindia et al., 2013). However, seeds of some species could disappear from the bank when eucalyptus are planted for the first time, as occur in evergreen conifers when planted on formerly deciduous oak woodland (Amezaga and Onaindia, 1997). Consequently, native forest species show a slow colonisation rate on those newly created habitats (Matlack and Monde, 2004). Moreover, their presence could suggest a considerable grade of maturity (Onaindia and Mitxelena, 2009). Those species enrich the undergrowth with more native richness and diversity, creating a well-developed understory that can favour the presence of micromammals (Carrilho et al., 2017; Teixeira, 2017), the cycling and the conservation of nutrients and the protection against soil erosion (Bauhus et al., 2001). In spite of the colonisation of those species, there are differences in composition with native forests, showing pine plantations higher similarity with native forests regarding to understory species composition than eucalypt plantations (Calviño-Cancela et al., 2012). In the study sites, the most frequent species (Pteridium aquilinum, Rubus sp, Daboecia cantabrica and Ulex sp.) were pioneer and broad-ranged generalist species typical of forest plantations and perturbed areas (Onaindia and Mitxelena, 2009). In the New plantations, the species that only appeared in these plantations (Frangula alnus, Ilex aquifolium, Quercus pyrenaica, and Dryopteris affinis) were mainly related to characteristics of the stand such as proximity to water or the fact that they were possibly not removed when the trees were planted. Nowadays, owners are not allowed to cut down native species when they clear or establish a plantation, as they used to do in previous decades. Therefore, it is necessary to implement management practices that develop understorey conditions that support species requiring high-quality habitats (Onaindia et al., 2013)
On the other hand, tree and fern richness and diversity were similar in both types of plantations. E. globulus, the dominant tree species, hinders the growth of other trees due to its rapid growth ability, which increases competition (Forrester et al., 2006; Li et al., 2023), so tree richness and diversity were poor in those plantations. In the case of ferns, Pteridium aquilinum was the species most frequently found. It is a generalist and tolerant species, that although it is not considered as an invasive species in Spain, it is one of the most aggressively spreading species in the world. In fact, it is considered as an invasive species in some regions (Marrs et al., 2013) just like E. globulus (Touza et al., 2010). This fern is accompanied by some other invasive species such as, Cortaderia selloana, Acacia melanoxylon or Pinus pinaster (Campos and Herrera, 2009). C. selloana, for instance, is able to colonise eucalyptus plantations due to its ability to increase its underground biomass (Domenech, 2005), excluding the native flora because of its fast growth. In the Basque Country, Eucalyptus sp., Quercus rubra and Pinus radiata plantations have the greatest presence of invasive flora (IFN, 2013).
4.1.3
Deadwood
The Old and New eucalypt plantations showed similar characteristics in relation to the total amount of deadwood and the volume of each decay stage found, as well as, the tree height, diameter and density. This means that, although deadwood amounts are sensitive to climate, forest structure, terrain, and socio-economic conditions (Augustynczik et al., 2024), the establishment time of the eucalyptus did not influence deadwood or tree size and density. The distribution of deadwood volume and decay classes provide an indication of the temporal variation in tree mortality and can be used to estimate the optimal deadwood volume ratio in biodiversity integrated forest management planning (Özdemir et al., 2023). Even so, the obtained amount of deadwood values in eucalypt plantations were low (3.35 m3·ha−1) compared to others studies and forests in the Basque Country, namely, eucalypt plantations (5.1 m3·ha−1), Pinus radiata plantations (11.1 m3·ha−1), Atlantic mixed forests (16.3 m3·ha−1), oak forests (20.8 m3·ha−1) or beech forests (25.5 m3·ha−1) (Peña, 2009; IFN, 2013). The values of high decomposition stage (decay stages 4 and 5), were very low (0.18 m3·ha−1) compared to other managed forests in Europe (1.94 and 2.40 m3·ha−1) (Özdemir et al., 2023; Bujoczek et al., 2024). Therefore, eucalypt plantations in Biscay could have problems sheltering diversity, especially of saproxylic species, as some of those species require deadwood with high decomposition rates to survive (Seibold et al., 2015).
4.1.4
Soil properties
Soil properties vary greatly over a small area and over time making it difficult to assess differences between plantations of the same tree (Grigal et al., 1991; Järvinen et al., 1993). Nevertheless, Old plantations showed significantly higher pH values and lower SOM than New plantations. Generally, eucalyptus stands tend to show low pH values (Afif et al., 2010; Rwibasira et al., 2021), and, in this case, the pH increased with the establishment time. Studies indicate that before a new plantation is established, all the trees and stumps are removed and the soil is prepared for planting, causing a change in the soil properties such as pH (Borrelli et al., 2017; El Mazi et al., 2022). However, this soil perturbation can be less severe in Old plantations, as they are capable of regenerating from stumps. This allows the colonisation and establishment of a higher number of specialist plant species and life forms, which have had more time to consume the accumulated SOM, resulting in a lower percentage of SOM in the soil.
4.2
Which drivers have more effect on plant species richness and diversity?
In this study, different drivers were found affecting plant diversity. Thus, we found that total deadwood volume had a positive effect on plant diversity, even at low values. Deadwood is known to be an important factor for herb layer diversity (Lee and Sturgess, 2001), as certain species can use deadwood for seedling germination and growth (Dittrich et al., 2014; Chećko et al., 2015; Unar et al., 2023). However, other studies have shown the negative effect of deadwood on plant diversity (Szymañski et al., 2021). Despite the lack of obligate deadwood colonisers, deadwood apparently plays a key role for forest plant diversity, mainly by providing an environment with low competition and thus, facilitating the establishment of species (Dittrich et al., 2014). Moreover, large-diameter deadwood in an advanced stage of decay harboured more species than smaller fragments in the early stages of decay (Chećko et al., 2015). Therefore, deadwood amount and their decay stage must be taken into account in the management of plantations and its increase must be promoted in forest systems.
Tree diversity was mainly influenced by altitude and proximity to watercourses. Thus, in eucalyptus plantations located at higher altitude or those closed to a watercourse, tree diversity was higher. At higher altitudes, the native forest area increases in this region so plantations have more native vegetation nearby which can influence the composition and diversity of vascular plants of the stand. Moreover, in areas near rivers or ponds where humidity is high, species of forest plantations and Atlantic mixed forests coexist such as, Salix atrocinerea, Quercus robur or Castanea sativa, increasing tree diversity (Nobis et al., 2016; Holeštová and Douda, 2022).
In the case of shrubs, their diversity increased when canopy cover decreased, as canopy cover is closely linked to the amount of light that enters in the stand (Shaw and Ken, 1996). When the tree cover is low, plants receive more light and the temperature of the understory increases (Lorer et al., 2023; Pohlman et al., 2007). As a result, generalist species that require light can easily colonise these areas, leading to an increase in shrub diversity (Chelli et al., 2021; Govaert et al., 2021).
5.
Conclusions
In conclusion, this study indicates that the longer a eucalyptus plantation has been established, the more species are able to colonise and survive in it, probably because management disturbance is punctual and not enough to remove the herb and shrub species already present and to modify soil conditions. Moreover, stand characteristics, such as, forest structure, deadwood or canopy cover favour plant diversity. Therefore, it is necessary to implement management practices that develop understorey conditions that support species requiring high-quality habitats, and increase deadwood amount and promote decay stage to improve biodiversity in eucalypt plantations. However, it is important to note that after 3–4 rotations, the stumps are removed and the soil is prepared for new trees to be planted. This results in the plantation being reverted to a New plantation state, which leads to a loss of plant diversity as has been observed in this study.
Funding and acknowledgements
We acknowledge the University of the Basque Country (UPV/EHU) for the given fellowship (PIF20/27) and the Basque Government through the given grant (GIC21/201-IT1648-22). We also acknowledge the Basque Government for the doctoral fellowship (PRE_2022_2_0194) that has partially supported this research.
The authors declare that they have no known competing financial interests or personal relationships that could have appeared to influence the work reported in this paper.
Afif, E., Canga, E., Oliveira, J.A., Gorgoso, J.J., 2010. Crecimiento en volumen y estado nutricional de Eucalyptus globulus Labill. y Pinus radiata D. Don en Asturias, España. Rev. Mex. Ciencias Farm. 1 (1), 47–54. .
Aizpuru, I., Aseginolaza, C., Uribe-Echebarria, P.M., Urrutia, P., Zorrakin, I., 1999. Claves ilustradas de la flora del País Vasco y territorios limítrofes. (Primera edición). Servicio Central de Publicaciones del Gobierno Vasco, Vitoria-Gasteiz, p. 831.
Alamgir, M., Turton, S.M., Macgregor, C.J., Pert, P.L., 2016. Assessing regulating and provisioning ecosystem services in a contrasting tropical forest landscape. Ecol. Indicat. 64, 319–334. .
Amazonas, N.T., Forrester, D.I., Oliveira, R.S., Brancalion, P.H.S., 2018. Combining Eucalyptus wood production with the recovery of native tree diversity in mixed plantings: implications for water use and availability. For. Ecol. Manag. 418, 34–40. .
Amezaga, I., Onaindia, M., 1997. The effect of evergreen and deciduous coniferous plantations on the field layer and seed bank of native woodlands. Ecography 20, 308–318. .
Angiolini, C., de Simone, L., Fiaschi, T., Cifaldi, G.P., Maccherini, S., Fanfarillo, E., 2023. Detecting the imprints of past clear-cutting on riparian forest plant communities along a Mediterranean river. River Res. Appl. 39 (8), 1616–1628. .
Asif, M., Nawaz, M.F., Ahmad, I., Rashid, M.H.U., Farooq, T.H., Kashif, M., Gul, S., Li, Q., 2023. Detrimental effects of induced soil compaction on morphological adaptation and physiological plasticity of selected multipurpose tree species. Plants 12 (13), 2468. .
Aszalós, R., Kovács, B., Tinya, F., Németh, C., Horváth, C.V., Ódor, P., 2023. Canopy gaps are less susceptible to disturbance-related and invasive herbs than clear-cuts: temporal changes in the understorey after experimental silvicultural treatments. For. Ecol. Manag. 549, 121438. .
Augustynczik, A.L.D., Gusti, M., di Fulvio, F., Lauri, P., Forsell, N., Havlík, P., 2024. Modelling the effects of climate and management on the distribution of deadwood in European forests. J. Environ. Manag. 54, 120382. .
Barrio-Anta, M., Castedo-Dorado, F., Cámara-Obregón, A., López-Sánchez, C.A., 2021. Integrating species distribution models at forest planning level to develop indicators for fast-growing plantations. A case study of Eucalyptus globulus Labill. in Galicia (NW Spain). For. Ecol. Manag. 491, 119200. .
Bas López, S., Guitián Rivera, J., Sobral, M., 2018. Biodiversidad en plantaciones de eucalipto y en robledales del sur de Galicia: plantas y aves. Nova Acta Cient. Compostelana 25, 71–81.
Bauhus, J., Aubin, I., Messier, C., Connell, M., 2001. Composition, structure, light attenuation and nutrient content of understory vegetation in a Eucalyptus sieberi regrowth stand 6 years after thinning and fertilisation. For. Ecol. Manag. 144, 275–286. .
Borrelli, P., Panagos, P., Märker, M., Modugno, S., Schütt, B., 2017. Assessment of the impacts of clear-cutting on soil loss by water erosion in Italian forests: first comprehensive monitoring and modelling approach. Catena 149, 770–781. .
Bravo, E., Ortuzar, L., 2012. Mecanización forestal en Euskadi: tala y desembosque. Foresta 55, 114–125.
Brempong, M.B., Amankwaa-Yeboah, P., Yeboah, S., Danquah, E.O., Agyeman, K., Keteku, A.K., Addo-Danso, A., Adomako, J., 2023. Soil and water conservation measures to adapt cropping systems to climate change facilitated water stresses in Africa. Front. Sustain. Food Syst. 6. .
Brower, J.E., Zar, J.H., 1977. Field and Laboratory Methods for General Ecology. W. C. Brown Company Publishers. Dubuque, Iowa.
Bujoczek, L., Bujoczek, M., Zięba, S., 2024. How do stand features shape deadwood diversity? For. Ecol. Manag. 553, 121609. .
Burrascano, S., Lombardi, F., Marchetti, M., 2008. Old-growth forest structure and deadwood: are they indicators of plant species composition? A case study from central Italy. Plant Biosyst. 142 (2), 313–323. .
Calviño-Cancela, M., Neumann, M., López de Silanés, M.E., 2020. Contrasting patterns of lichen abundance and diversity in Eucalyptus globulus and Pinus pinaster plantations with tree age. For. Ecol. Manag. 462, 117994. .
Calviño-Cancela, M., Rubido-Bará, M., van Etten, E.J.B., 2012. Do eucalypt plantations provide habitat for native forest biodiversity? For. Ecol. Manag. 270, 153–162. .
Cambi, M., Certini, G., Neri, F., Marchi, E., 2015. The impact of heavy traffic on forest soils: a review. For. Ecol. Manag. 338, 124–138. .
Campos, J.A., Herrera, M., 2009. Diagnosis de la Flora alóctona invasora de la CAPV. Dirección de Biodiversidad y Participación Ambiental. Departamento de Medio Ambiente y Ordenación del Territorio, Gobierno Vasco, Bilbao.
Carrilho, M., Teixeira, D., Santos-Reis, M., Rosalino, L.M., 2017. Small mammal abundance in Mediterranean Eucalyptus plantations: how shrub cover can really make a difference. For. Ecol. Manag. 391, 256–263. .
Cateau, E., Larrieu, L., Vallauri, D., Savoie, J.M., Touroult, J., Brustel, H., 2015. Ancienneté et maturité: Deux qualités complémentaires d'un écosystème forestier. Comptes Rendus Biol. 338 (1), 58–73. .
Cerasoli, S., Caldeira, M.C., Pereira, J.S., Caudullo, G., de Rigo, D., 2016. Eucalyptus globulus and other eucalypts in Europe: distribution, habitat, usage and threats. In: San-Miguel-Ayanz, J., de Rigo, D., Caudullo, G., Houston Durrant, T., Mauri, A. (Eds.), European Atlas of Forest Tree Species. Publications Office of the European Union, Luxembourg.
Chećko, E., Jaroszewicz, B., Olejniczak, K., Kwiatkowska-Falińska, A.J., 2015. The importance of coarse woody debris for vascular plants in temperate mixed deciduous forests. Can. J. For. Res. 45 (9), 1154–1163. .
Chelli, S., Ottaviani, G., Simonetti, E., Campetella, G., Wellstein, C., Bartha, S., Cervellini, M., Canullo, R., 2021. Intraspecific variability of specific leaf area fosters the persistence of understorey specialists across a light availability gradient. Plant Biol. 23 (1), 212–216. .
da Silva, N.F., de Barros, N.F., Lima Neves, J.C., Schulthais, F., de Novais, R.F., Mattiello, E.M., 2020. Yield and nutrient demand and efficiency of eucalyptus under coppicing regime. Forests 11 (8), 852. .
De la Hera, I., Arizaga, J., Galarza, A., 2013. Exotic tree plantations and avian conservation in northern Iberia: a view from a nest-box monitoring study. Anim. Biodivers. Conserv. 36 (2), 153–163. .
Deus, E., Silva, J.S., Castro-Díez, P., Lomba, A., Ortiz, M.L., Vicente, J., 2018. Current and future conflicts between eucalypt plantations and high biodiversity areas in the Iberian Peninsula. J. Nat. Conserv. 45, 107–117. .
Dittrich, S., Jacob, M., Bade, C., Leuschner, C., Hauck, M., 2014. The significance of deadwood for total bryophyte, lichen, and vascular plant diversity in an old-growth spruce forest. Plant Ecol. 215 (10), 1123–1137. .
Domenech, R., 2005. Cortaderia Selloana Invasion in the Mediterranean Region: Invasiveness and Ecosystem Invasibility. Doctoral thesis. The University of Alabama at Birmingham.
Edeso, J.M., Merino, A., González, M.J., Marauri, P., 1998. Manejo de explotaciones forestales y pérdida de suelo en zonas de elevada pendiente del País Vasco. Cuaternario Geomorfol. 12(1–2), 105–116.
El Mazi, M., Hmamouchi, M., Saber, E.R., Bouchantouf, S., Houari, A., 2022. Deforestation effects on soil properties and erosion: a case study in the central Rif, Morocco. Eur. J. Soil Sci. 11 (4), 275–283. .
Elosegi, A., Cabido, C., Larrañaga, A., Arizaga, J., 2020. Efectos ambientales de las plantaciones de eucaliptos en Euskadi y la península ibérica. Munibe Cienc. Nat. 68, 111–136. .
FAO, 1981. El eucalipto en la repoblación forestal. Estudios de silvicultura y productos forestales No. 11. Rome, Italy.
FAO, 1995. Regional Expert Consultation on eucalyptus. FAO Regional Office for Asia and the Pacific. Bangkok, Thailand. RAPA 1995/6.
Florêncio, G.W.L., Martins, F.B., Fagundes, F.F.A., 2022. Climate change on Eucalyptus plantations and adaptive measures for sustainable forestry development across Brazil. Ind. Crop. Prod. 188, 115538. .
Forrester, D.I., Bauhus, J., Cowie, A.L., Vanclay, J.K., 2006. Mixed-species plantations of Eucalyptus with nitrogen-fixing trees: a review. For. Ecol. Manag. 233(2-3), 211–230. .
Ghosh, J., Delampady, M., Samanta, T., 2006. An Introduction to Bayesian Analysis: Theory and Methods. Springer, New York.
Gobierno Vasco, 2020. Modelo digital del terreno (MDT) de 1m de la Comunidad Autónoma del País Vasco, Año 2017. . (Accessed 13 March 2024).
Gobierno Vasco, 2022. Mapa Forestal Comunidad Autónoma del País Vasco 2022. . (Accessed 13 March 2024).
Gobierno Vasco, 2023a. Mapa Forestal Comunidad Autónoma del País Vasco 2023. . (Accessed 13 March 2024).
Gobierno Vasco, 2023b. Ejes de corrientes hidrografía del País Vasco 2022. escala 1,5000. . (Accessed 13 March 2024).
Goded, S., Ekroos, J., Domínguez, J., Azcárate, J. G., Guitián, J. A., Smith, H. G., 2019. Effects of eucalyptus plantations on avian and herb species richness and composition in North-West Spain. Global Ecol. Conserv. 19, e00690. .
Govaert, S., Vangansbeke, P., Blondeel, H., De Lombaerde, E., Verheyen, K., De Frenne, P., 2021. Forest understorey plant responses to long-term experimental warming, light and nitrogen addition. Plant Biol. 23 (6), 1051–1062. .
Grigal, D.F., McRoberts, R.E., Ohmann, L.F., 1991. Spatial variation in chemical properties of forest floor and surface mineral soil in the North Central United States. Soil Sci. 151, 282–290.
Holeštová, A., Douda, J., 2022. Plant species over-occupancy indicates river valleys are natural corridors for migration. Plant Ecol. 223 (1), 71–83. .
Hoogar, R., Malakannavar, S., Sujatha, H.T., 2019. Impact of eucalyptus plantations on ground water and soil ecosystem in dry regions. J. Pharmacogn. Phytochem. 8 (4), 2929–2933.
Huber, A., Iroumé, A., Mohr, C., Frêne, V., 2010. Efecto de plantaciones de Pinus radiata y Eucalyptus globulus sobre el recurso agua en la Cordillera de la Costa de la región del Biobío, Chile, Chile. Bosque 31 (3), 219–230. .
IFN, 2013. Cuarto Inventario Forestal Nacional, País Vasco. Ministerio de Medio Ambiente y Medio Rural y Marino, Madrid, Spain.
Järvinen, E., Hokkanen, T.J., Kuuluvainen, T., 1993. Spatial heterogeneity and relationships of mineral soil properties in a boreal Pinus sylvestris stand. Scand. J. For. Res. 8(1-4), 435–445. .
Johnson, D.W., Curtis, P.S., 2001. Effects of forest management on soil C and N storage: meta analysis. For. Ecol. Manag. 140, 227–238. .
Karami, S., Jourgholami, M., Attarod, P., Venanzi, R., Latterini, F., Stefanoni, W., Picchio, R., 2023. The medium-term effects of forest operations on a mixed broadleaf forest: changes in soil properties and loss of nutrients. Land Degrad. Dev. 34 (10), 2961–2974. .
Kort, J., Collins, M., Ditsch, D., 1998. A review of soil erosion potential associated with biomass crops. Biomass Bioenergy 14 (4), 351–359. .
Lee, P., Sturgess, K., 2001. The effects of logs, stumps, and root throws on understory communities within 28-year-old aspen-dominated boreal forests. Can. J. Bot. 79 (8): 905-916. .
Li, J., Huang, Y., Chen, L., Gao, S., Zhang, J., Zhang, D., 2023. Understory plant diversity and phenolic allelochemicals across a range of Eucalyptus grandis plantation ages. J. For. Res. 34 (5), 1577–1590. .
Lindgren, P.M.F., Sullivan, T.P., 2001. Influence of alternative vegetation management treatments on conifer plantation attributes: abundance, species diversity, and structural diversity. For. Ecol. Manag. 142, 163–182. .
Loidi, J., Biurrun, I., Campos, J.A., García-Mijangos, I., Herrera, M., 2011. La vegetación de la Comunidad Autonoma del País Vasco: leyenda del mapa de series de vegetación a escala 1:50.000. Universidad del País Vasco/Euskal Herriko Unibertsitatea, Leioa.
López-Sánchez, C.A., Castedo-Dorado, F., Cámara-Obregón, A., Barrio-Anta, M., 2021. Distribution of Eucalyptus globulus Labill. in northern Spain: contemporary cover, suitable habitat and potential expansion under climate change. For. Ecol. Manag. 481, 118723. .
Lorer, E., Verheyen, K., Blondeel, H., De Pauw, K., Sanczuk, P., De Frenne, P., Landuyt, D., 2023. Forest understorey flowering phenology responses to experimental warming and illumination. New Phytol. 241 (4), 1476–1491. .
Marrs, R.H., Kirby, K.J., Le Duc, M.G., McAllister, H., Smart, S.M., Oksanen, J., Bunce, R.G.H., Corney, P.M., 2013. Native dominants in British woodland—a potential cause of reduced species-richness? New J. Bot. 3, 156–168. .
Marshall, P.L., Davis, G., Taylor, S.W., 2003. Using line intersect sampling for coarse woody debris. . (Accessed 13 March 2024).
Martello, F., dos Santos, J.S., Silva-Neto, C.M., Cássia-Silva, C., Siqueira, K.N., de Ataíde, M.V.R., Ribeiro, M.C., Collevatti, R.G., 2023. Landscape structure shapes the diversity of plant reproductive traits in agricultural landscapes in the Brazilian Cerrado. Agric. Ecosyst. Environ. 341, 108216. .
Martin, M., Fenton, N.J., Morin, H., 2021. Tree-related microhabitats and deadwood dynamics form a diverse and constantly changing mosaic of habitats in boreal old-growth forests. Ecol. Indicat. 128, 107813. .
Martins, F.B., Benassi, R.B., Torres, R.R., de Brito Neto, F.A., 2022. Impacts of 1.5 ℃ and 2 ℃ global warming on Eucalyptus plantations in South America. Sci. Total Environ. 825, 153820. .
Martins, M.A.S., González-Pelayo, O., Machado, A.I., Simões, L.B., Ben-Hur, M., Keizer, J.J., 2023. Assessment of short- to medium-term impacts of bench terrace construction on soil water repellency in north-central Portugal. Geod. Reg. 35, e00707. .
Matlack, G.R., Monde, J., 2004. Consequences of low mobility in spatially and temporally heterogeneous ecosystems. J. Ecol. 92 (6), 1025–1035. .
Merganičová, K., Merganič, J., Svoboda, M., Bače, R., Šebeň, V., 2012. Deadwood in forest ecosystems. In: Blanco, J.A., Lo, Y. (Eds.), Forest Ecosystems – More than Just Trees. IntechOpen, Rijeka, pp. 81–108. .
Merino, A., Balboa, M.A., Rodríguez Soalleiro, R., González, J.G.Á., 2005. Nutrient exports under different harvesting regimes in fast-growing forest plantations in southern Europe. For. Ecol. Manag. 207 (3), 325–339. .
Mostacedo, B., Fredericksen, T.S., 2000. Manual de Métodos Básicos de Muestreo y Análisis en Ecología Vegetal. Santa Cruz, Bolivia.
Nobis, A., Żmihorski, M., Kotowska, D., 2016. Linking the diversity of native flora to land cover heterogeneity and plant invasions in a river valley. Biol. Conserv. 203, 17–24. .
Oettel, J., Lapin, K., Kindermann, G., Steiner, H., Schweinzer, K.M., Frank, G., Essl, F., 2020. Patterns and drivers of deadwood volume and composition in different forest types of the Austrian natural forest reserves. For. Ecol. Manag. 463, 118016. .
Onaindia, M., Mitxelena, A., 2009. Potential use of pine plantations to restore native forests in a highly fragmented river basin. Ann. For. Sci. 66 (3), 305. .
Onaindia, M., Ametzaga-Arregi, I., San Sebastián, M., Mitxelena, A., Rodríguez-Loinaz, G., Peña, L., Alday, J.G., 2013. Can understorey native woodland plant species regenerate under exotic pine plantations using natural succession? For. Ecol. Manag. 308, 136–144. .
Onaindia, M., Dominguez, I., Albizu, I., Garbisu, C., Amezaga, I., 2004. Vegetation diversity and vertical structure as indicators of forest disturbance. For. Ecol. Manag. 195 (3), 341–354. .
Özdemir, S., Yavuz, M., Kahriman, A., 2023. Variation of deadwood density by decay class in pure and mixed Oriental spruce stands in Northeastern Black Sea. Eur. J. For. Res. 142 (6), 1453–1466. .
Peña, L., 2009. Influencia del paisaje y de los factores ambientales en la estructura y diversidad de los hayedos de la Comunidad Autónoma del País Vasco. Universidad del País Vasco/Euskal Herriko Unibertsitatea. Doctoral thesis.
Peña, L., Amezaga, I., Onaindia, M., 2011. At which spatial scale are plant species composition and diversity affected in beech forests? Ann. For. Sci. 68 (8), 1351–1362. .
Pohlman, C.L., Turton, S.M., Goosem, M., 2007. Edge effects of linear canopy openings on tropical rain forest understory microclimate. Biotropica 39 (1), 62–71. .
Rahman, M.M., Frank, G., Ruprecht, H., Vacik, H., 2008. Structure of coarse woody debris in lange-leitn natural forest reserve, Austria. J. For. Sci. 54 (4), 161–169. .
Ranius, T., Hämäläinen, A., Egnell, G., Olsson, B., Eklöf, K., Stendahl, J., Rudolphi, J., Sténs, A., Felton, A., 2018. The effects of logging residue extraction for energy on ecosystem services and biodiversity: a synthesis. J. Environ. Manag. 209, 409–425. .
Riffo-Donoso, V., Osorio, F., Fontúrbel, F.E., 2021. Habitat disturbance alters species richness, composition, and turnover of the bryophyte community in a temperate rainforest. For. Ecol. Manag. 496, 119467. .
Rozas, M., 2005. El sistema de gestión medioambiental de la Reserva de la Biosfera de Urdaibai. Seguimiento de la actividad forestal. Europarc 19. . (Accessed 13 March 2024).
RStudio Team, 2022. RStudio: Integrated Development Environment for R. RStudio. PBC, Boston.
Rwibasira, P., Naramabuye, F.X., Nsabimana, D., Carnol, M., 2021. Long-term effects of forest plantation species on chemical soil properties in southern Rwanda. Soil Syst. 5 (4), 59. .
Saloña, M., Iturrondobeitia, J.C., 1993. A comparative study of the soil mite communities (Acari) of wooded and unwooded areas in the Basque Country, Northern Spain. In: Watkins, C. (Ed.), Ecological Effects of Afforestation. Studies in the History and Ecology of Afforestation in Western Europe. CAB International, pp. 153–163.
Seibold, S., Bässler, C., Brandl, R., Gossner, M.M., Thorn, S., Ulyshen, M.D., Müller, J., 2015. Experimental studies of dead-wood biodiversity - a review identifying global gaps in knowledge. Biol. Conser. 191, 139–149. .
Seibold, S., Thorn, S., 2018. The importance of dead-wood amount for saproxylic insects and how it interacts with dead-wood diversity and other habitat factors. In: Ulyshen, M.D. (Ed.), Saproxylic Insects: Diversity, Ecology and Conservation. Springer, Athens, Georgia, pp. 607–631.
Shaw, D.C., Ken, B., 1996. An overview of forest canopy ecosystem functions with reference to urban and riparian systems. Northwest Sci. 70(1-5).
Silva-Pando, F.J., 2022. La introducción y expansión del eucalipto en la Península Ibérica. Foresta 82, 42–49.
Szymañski, C.R, Tabeni, S., Alvarez, J.A., Campos, C.M, 2021. Diversity of plants and mammals as indicators of the effects of land management types in woodlands. For. Ecosyst. 8, 74. .
Teixeira, D., 2017. Management of Eucalyptus plantations influences small mammal density: evidence from Southern Europe. For. Ecol. Manag. 385, 25–34. .
Teixeira, D.F., Carpio, A.J., Rosalino, L.M., Carniato, D., Fonseca, C., Acevedo, P., 2023. Can Eucalyptus plantations influence the distribution range of mesocarnivores? Landsc. Ecol. 38, 3221–3235. .
Tellería, J.L., Galarza, A., 1990. Avifauna y paisaje en el norte de España: efecto de las repoblaciones con árboles exóticos. ARDEOLA 37 (2), 229–245.
Touza, J., Perrings, C., Amil, M.L.C., 2010. Harvest decisions and spatial landscape attributes: the case of Galician communal forests. Environ. Resour. Econ. 46 (1), 75–91. .
Unar, P., Daněk, P., Adam, D., Paločková, L., Holík, J., 2023. Can deadwood be preferred to soil? Vascular plants on decaying logs in different forest types in Central Europe. Eur. J. For. Res. 143, 379–391. .
Veiras, X., Soto, M.A., 2011. La conflictividad de las plantaciones de eucalipto en España (y Portugal). Greenpeace, Madrid.
Wang, T., Dai, Q., Fu, Y., Wei, P., 2023. Effect of continuous planting on tree growth traits and growth stress in plantation forests of Eucalyptus urophylla×E. grandis. Sustainability 15 (12), 9624. .
Wani, Z.A., Negi, V.S., Bhat, J.A., Satish, K.V., Kumar, A., Khan, S., Dhyani, R., Siddiqui, S., Al-Qthanin, R.N., Pant, S., 2023. Elevation, aspect, and habitat heterogeneity determine plant diversity and compositional patterns in the Kashmir Himalaya. Front. For. Glob. Chang. 6. .
Watanabe, S., 2010. Asymptotic equivalence of bayes cross validation and widely applicable information criterion in singular learning theory. J. Mach. Learn. Res. 11, 3571–3594.
Wen, Y., Ye, D., Chen, F., Liu, S., Liang, H., 2010. The changes of understory plant diversity in continuous cropping system of Eucalyptus plantations, South China. J. For. Res. 15 (4), 252–258. .
Zhang, Q.P., Wang, J., Gu, H.L., Zhang, Z.G., Wang, Q., 2018. Effects of continuous slope gradient on the dominance characteristics of plant functional groups and plant diversity in alpine meadows. Sustainability 10 (12), 4805. .

 DownLoad:


 Email Alerts
 RSS Feeds