Lu Wang, Hongyan Liu, Liang Shi, Xianliang Zhang, Boyi Liang, Ru Huang, Jussi Grießinger, Steven Leavitt, Yuemin Yue, Kelin Wang. Water use strategies determine divergent growth trends of spruce and juniper on the southeastern Tibetan plateau[J]. Forest Ecosystems, 2024, 11(1): 100248. DOI: 10.1016/j.fecs.2024.100248
Citation:
Lu Wang, Hongyan Liu, Liang Shi, Xianliang Zhang, Boyi Liang, Ru Huang, Jussi Grießinger, Steven Leavitt, Yuemin Yue, Kelin Wang. Water use strategies determine divergent growth trends of spruce and juniper on the southeastern Tibetan plateau[J]. Forest Ecosystems, 2024, 11(1): 100248. DOI: 10.1016/j.fecs.2024.100248
Lu Wang, Hongyan Liu, Liang Shi, Xianliang Zhang, Boyi Liang, Ru Huang, Jussi Grießinger, Steven Leavitt, Yuemin Yue, Kelin Wang. Water use strategies determine divergent growth trends of spruce and juniper on the southeastern Tibetan plateau[J]. Forest Ecosystems, 2024, 11(1): 100248. DOI: 10.1016/j.fecs.2024.100248
Citation:
Lu Wang, Hongyan Liu, Liang Shi, Xianliang Zhang, Boyi Liang, Ru Huang, Jussi Grießinger, Steven Leavitt, Yuemin Yue, Kelin Wang. Water use strategies determine divergent growth trends of spruce and juniper on the southeastern Tibetan plateau[J]. Forest Ecosystems, 2024, 11(1): 100248. DOI: 10.1016/j.fecs.2024.100248
Key Laboratory for Agro-Ecological Processes in Subtropical Region, Institute of Subtropical Agriculture, Chinese Academy of Sciences, Changsha, 410125, China
b.
College of Urban and Environmental Sciences, Peking University, Beijing, 100871, China
c.
Institute of Geographic Sciences and Natural Resources Research, Chinese Academy of Sciences, Beijing, 100101, China
d.
College of Forestry, Hebei Agricultural University, Baoding, 071001, China
e.
College of Forestry, Precision Forestry Key Laboratory of Beijing, Beijing Forestry University, Beijing, 100083, China
f.
National Institute of Natural Hazards, Beijing, 100085, China
g.
Friedrich-Alexander-University Erlangen-Nürnberg, Institute of Geography, Wetterkreuz, Erlangen, Germany
h.
Laboratory of Tree-Ring Research, University of Arizona, Tucson, AZ, USA
Funds: This research was funded by the National Natural Science Foundation of China (No. 42161144008)
Warming and increased CO2 levels are generally believed to enhance photosynthetic rates (A) and tree growth, especially in alpine treelines. However, this positive effect may be limited by moisture availability. Here we compare the radial growth and intrinsic water use efficiency (iWUE) of two widely-distributed evergreen needleleaf species, Tibetan juniper (Juniperus tibetica) and Balfour spruce (Picea balfouriana), at the same site near the treeline on the southeastern Tibetan Plateau using tree-ring width and dual isotopes (δ13C and δ18O). We observed that with a 70-ppm increase in atmospheric CO2 from 1954 to 2007, juniper radial growth was significantly stimulated, whereas spruce growth remained constant. Correlation analysis between tree-ring width and climate factors revealed that spruce was more moisture-sensitive than juniper. Although the increases in iWUE for juniper (22%) and spruce (26%) were similar, iWUE changes in spruce were more influenced by stomatal conductance (gs) rather than A, supporting that moisture availability inhibits spruce growth. Our study implies that predicting growth dynamics in alpine forests based on the growth-temperature relationship may be inadequate, as they are likely moisture-limited. It also suggests that increases in A may not be as widespread as previously thought, which helps improve forest productivity modeling.
The Tibetan Plateau, being the highest and largest plateau in the world, is typically sensitive to global changes. Numerous studies have investigated how trees responded to global warming and hydroclimatic changes in the Tibetan Plateau (e.g., Lyu et al., 2019; Shi et al., 2023). For example, it was shown that temperature increases play a role in stimulating photosynthesis timing and rates in the Tibetan Plateau (Zhang et al., 2022). Moreover, atmospheric CO2 concentration (ca) is also surging along with temperature increases. With ca rising, plants increase their photosynthesis rate (A), and/or partially decrease their stomatal conductance (gs), leading to increasing intrinsic water-use efficiency (iWUE=Ags) (Mathias and Thomas, 2021). With more carbon gain and/or less water loss, plant growth may also be enhanced, which is the carbon dioxide fertilization effect (CFE, Keenan et al., 2013). However, warming-induced water stress also affects vegetation growth there (Fang et al., 2015). Since natural climatic variability can hinder quantifying the real CFE signal (Chen et al., 2022), to what extent CFE impacts tree growth, especially in this high-altitude region is worthy to be further explored.
So far there is no consensus in terms of the magnitude or even existence of CFE, owing to different study scales from leaf level to ecosystem level and various research methods, including CO2 enrichment experiments, proxy data from remote sensing and tree rings, as well as models (Chen et al., 2022). For example, while various dynamic global vegetation models (DGVMs) usually monitor an increasing gross primary productivity (GPP) with rising ca (Chen et al., 2022), tree-ring meta-analysis over tropical areas (van der Sleen et al., 2015), high-latitude boreal forests (Girardin et al., 2016) and global biomes (Peñuelas et al., 2011; Silva and Anand, 2013) found no consistent stimulated tree growth. Solving the divergence between modeling and tree-ring studies requires understanding the natural forests' physiological processes over time and space and carefully checking whether the modeling setup parameters reasonably represent the forest system.
Tree-ring dual isotopes (δ13C and δ18O) provide a means for investigating physiological processes of trees over time, particularly determining iWUE changes and separating the contribution of A and gs to the iWUE in response to rising ca (Roden and Farquhar, 2012; Gessler et al., 2018; Siegwolf et al., 2023). From the perspective of isotopic discrimination, tree-ring δ13C is influenced by both changes of A and gs, and iWUE can be calculated with the isotope (Farquhar et al., 1989). By comparison, tree-ring δ18O is not responsive to A changes but is determined by water source δ18O and gs, with the strength of two signals varying over time and space (Roden et al., 2000). Therefore, the relative impacts of A and gson iWUE can be distinguished by the two isotopes in the case that tree-ring δ18O is mainly influenced by gs, rather than water source δ18O (Barnard et al., 2012; Roden and Siegwolf, 2012). It should be noted that a close relationship between δ18O and gs is the key to the establishment of the dual-isotope model (Lin et al., 2022).
Using the tree-ring dual isotopes to distinguish the relative A and gs contribution to increasing iWUE has been widely practiced in recent years, which helps faithfully assess CFE in natural forests (Brooks and Mitchell, 2011; Lavergne et al., 2017; Liu et al., 2019; Depardieu et al., 2024). A recent global dual-isotope meta-analysis reported that A increases accounted for 83% of the examined cases of iWUE increase (Mathias and Thomas, 2021), supporting previous research that reported gs reduction mainly occurred in water-stressed environments (Guerrieri et al., 2019). Their results seemingly point to widespread CFE. However, their methodology was equivocal in that their calculation of precipitation δ18O was probably inaccurate, so Δ18O in leaf water enrichment might not reflect gs in some cases (Lin et al., 2022). Hence, their conclusions drawn from the methodology, such as the increasing ca of the past 30 years not producing significant changes ings of trees in humid regions, are also open to debate (Lin et al., 2022).
To examine whether A increases occur in alpine environments as previously suggested, we present here a case study of Tibetan juniper (Juniperus tibetica) and Balfour spruce (Picea balfouriana) at the same site in a subhumid environment of the southeastern Tibetan Plateau, which was included in the global dual-isotope network (Mathias and Thomas, 2021). Juniper and spruce are the two most widely-distributed dominant tree genus in the Tibetan Plateau. Although the growth pattern and physiological response of juniper and spruce in the drying arid northeastern Tibetan Plateau were investigated (Wang et al., 2021), a knowledge gap remains how they adapt to CO2 concentration elevation and climatic changes in humid regions (i.e., with less water stress). The site is located in Qamdo of the southeastern Tibetan Plateau, with juniper and spruce sampled near the treeline locations (3,200–3,400 m), which should be highly sensitive to environmental changes. In addition to dual isotopes (δ13C and δ18O) as used by Mathias and Thomas (2021), tree-ring width data were also derived in our study to infer their growth patterns, physiological changes, and relations to climate variables. The tree-ring width (i.e., annual tree growth) was related to temperature, soil moisture, relative humidity, and ca variations, and the dual isotope model was used to indicate the relative impacts of A and gs changes on iWUE (Scheidegger et al., 2000; Grams et al., 2007; Barnard et al., 2012; Gessler et al., 2018; Depardieu et al., 2024). We intended to test the following two hypotheses (Hp): (1) The increasing iWUE of the two tree species might not been all driven by A increases, different from the results of the previous investigation (Mathias and Thomas, 2021). (2) Water availability might hinder A increases and tree growth stimulation.
2.
Materials and Methods
2.1
Study site and tree-ring data
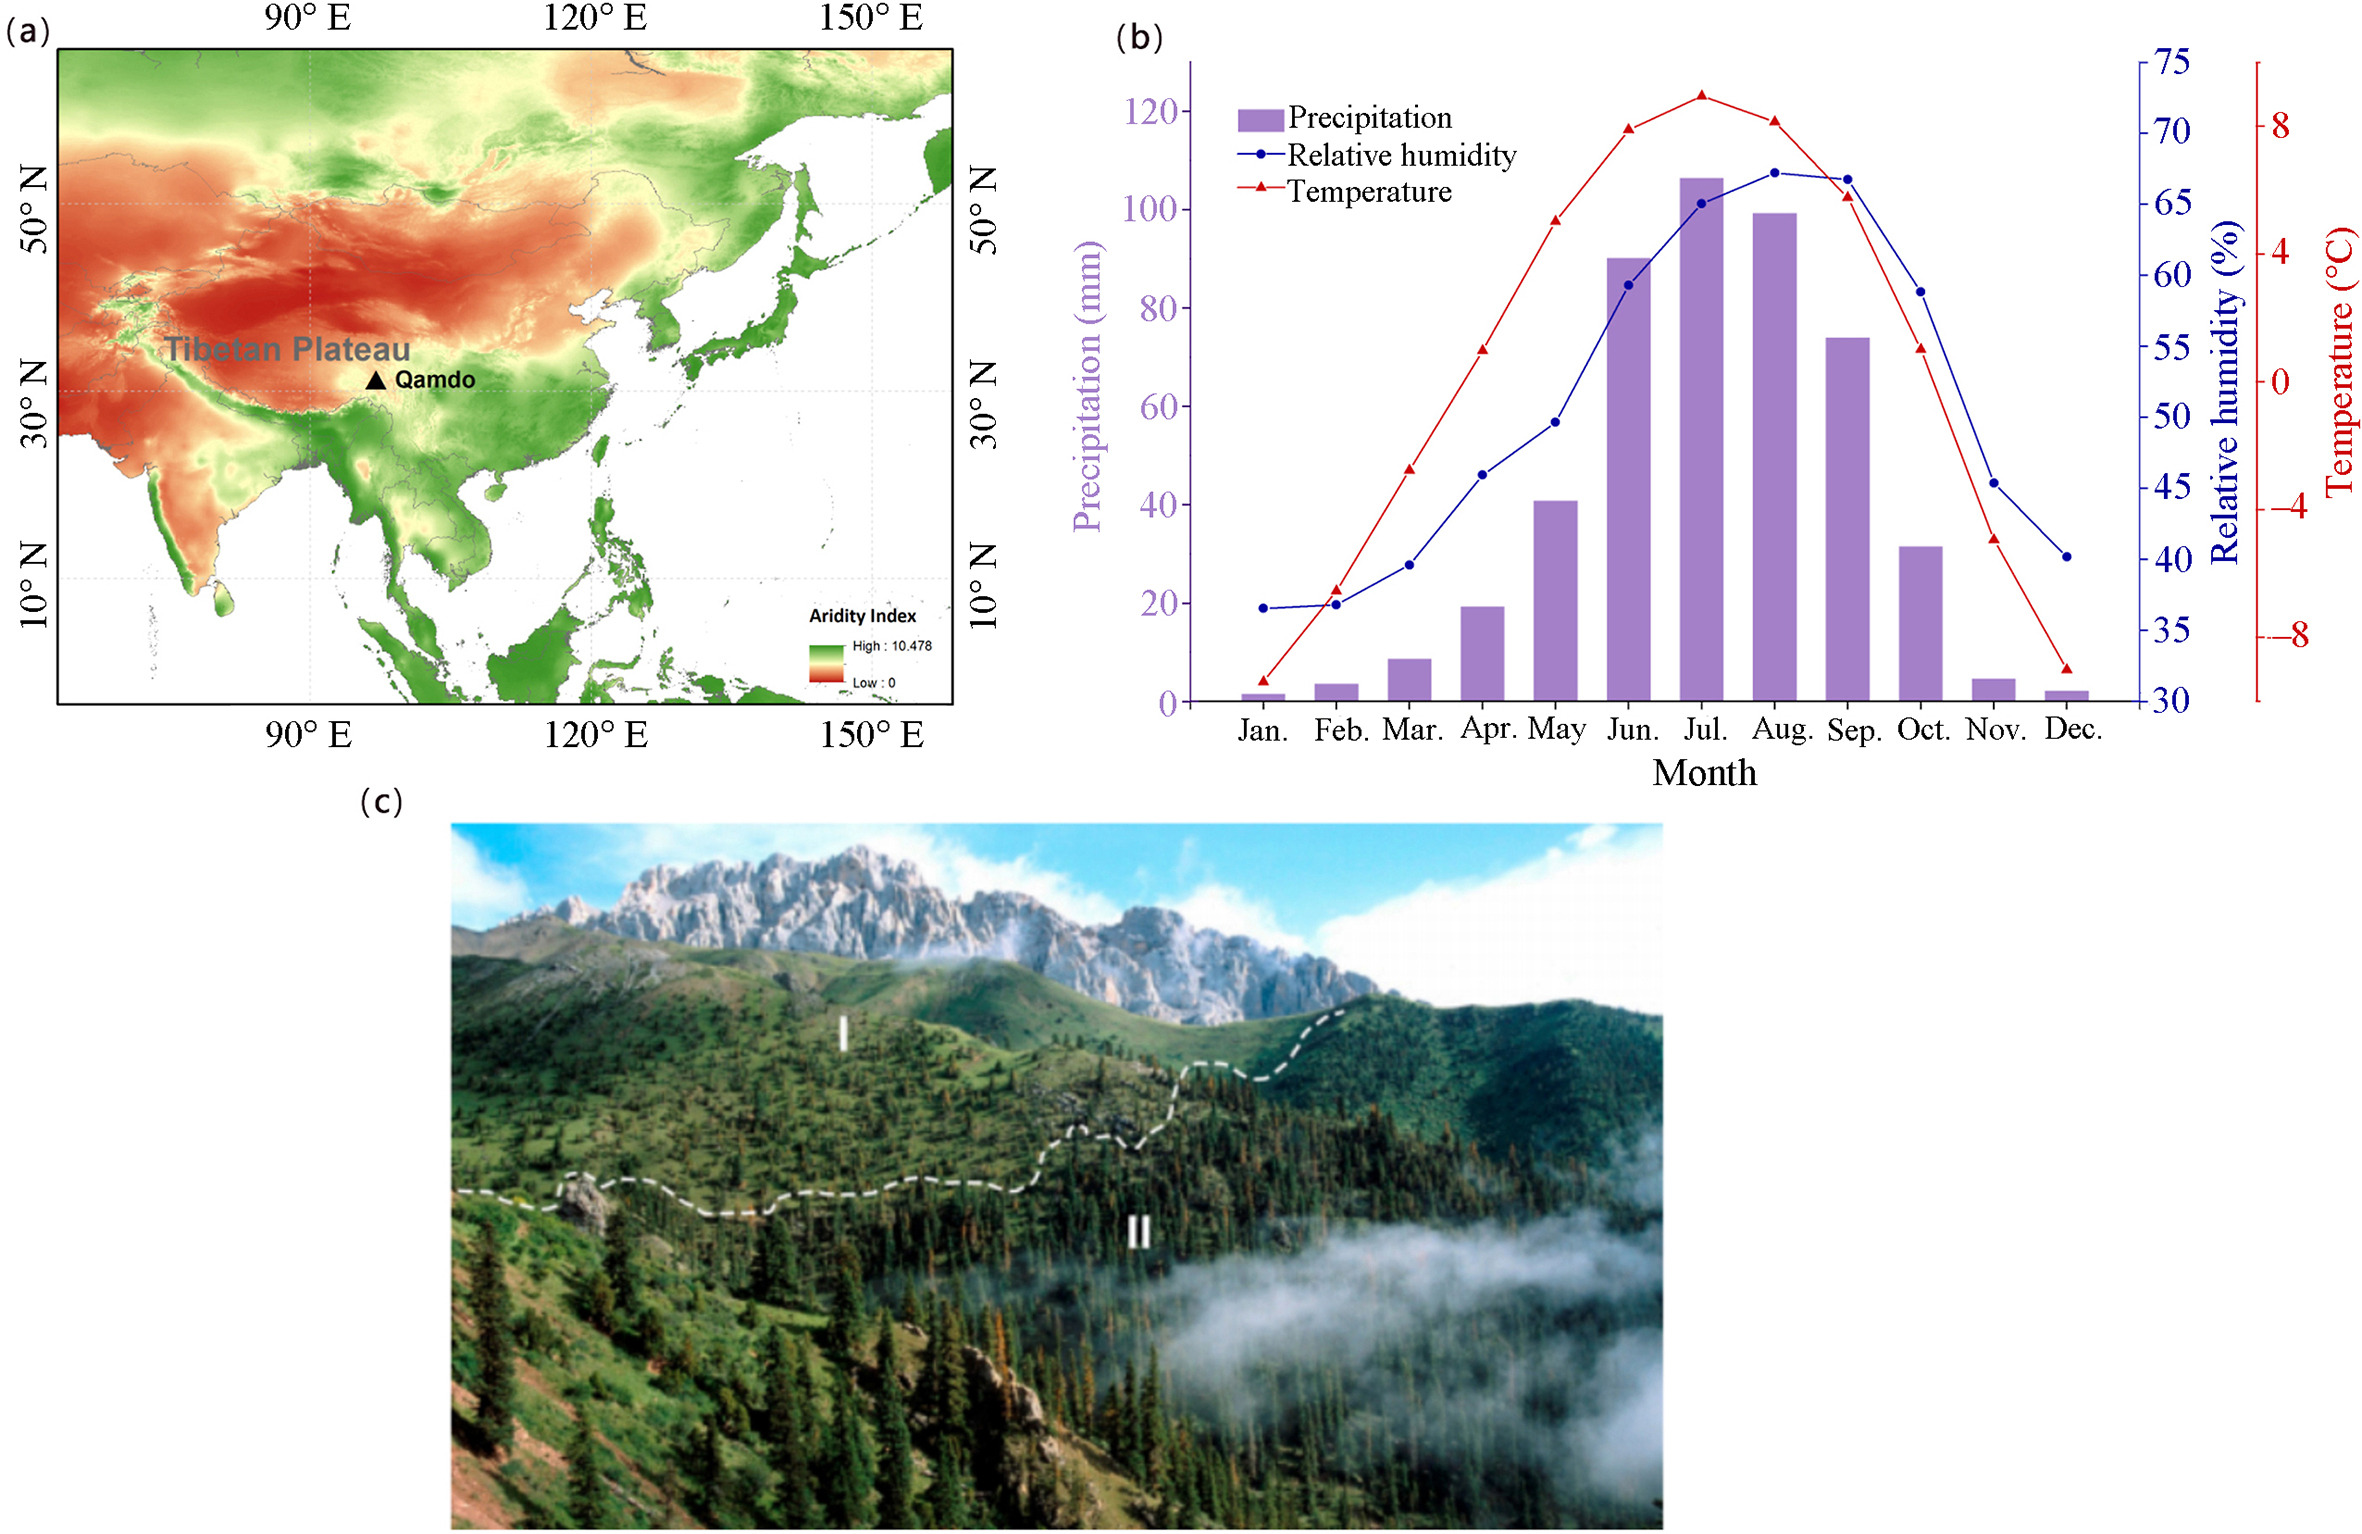
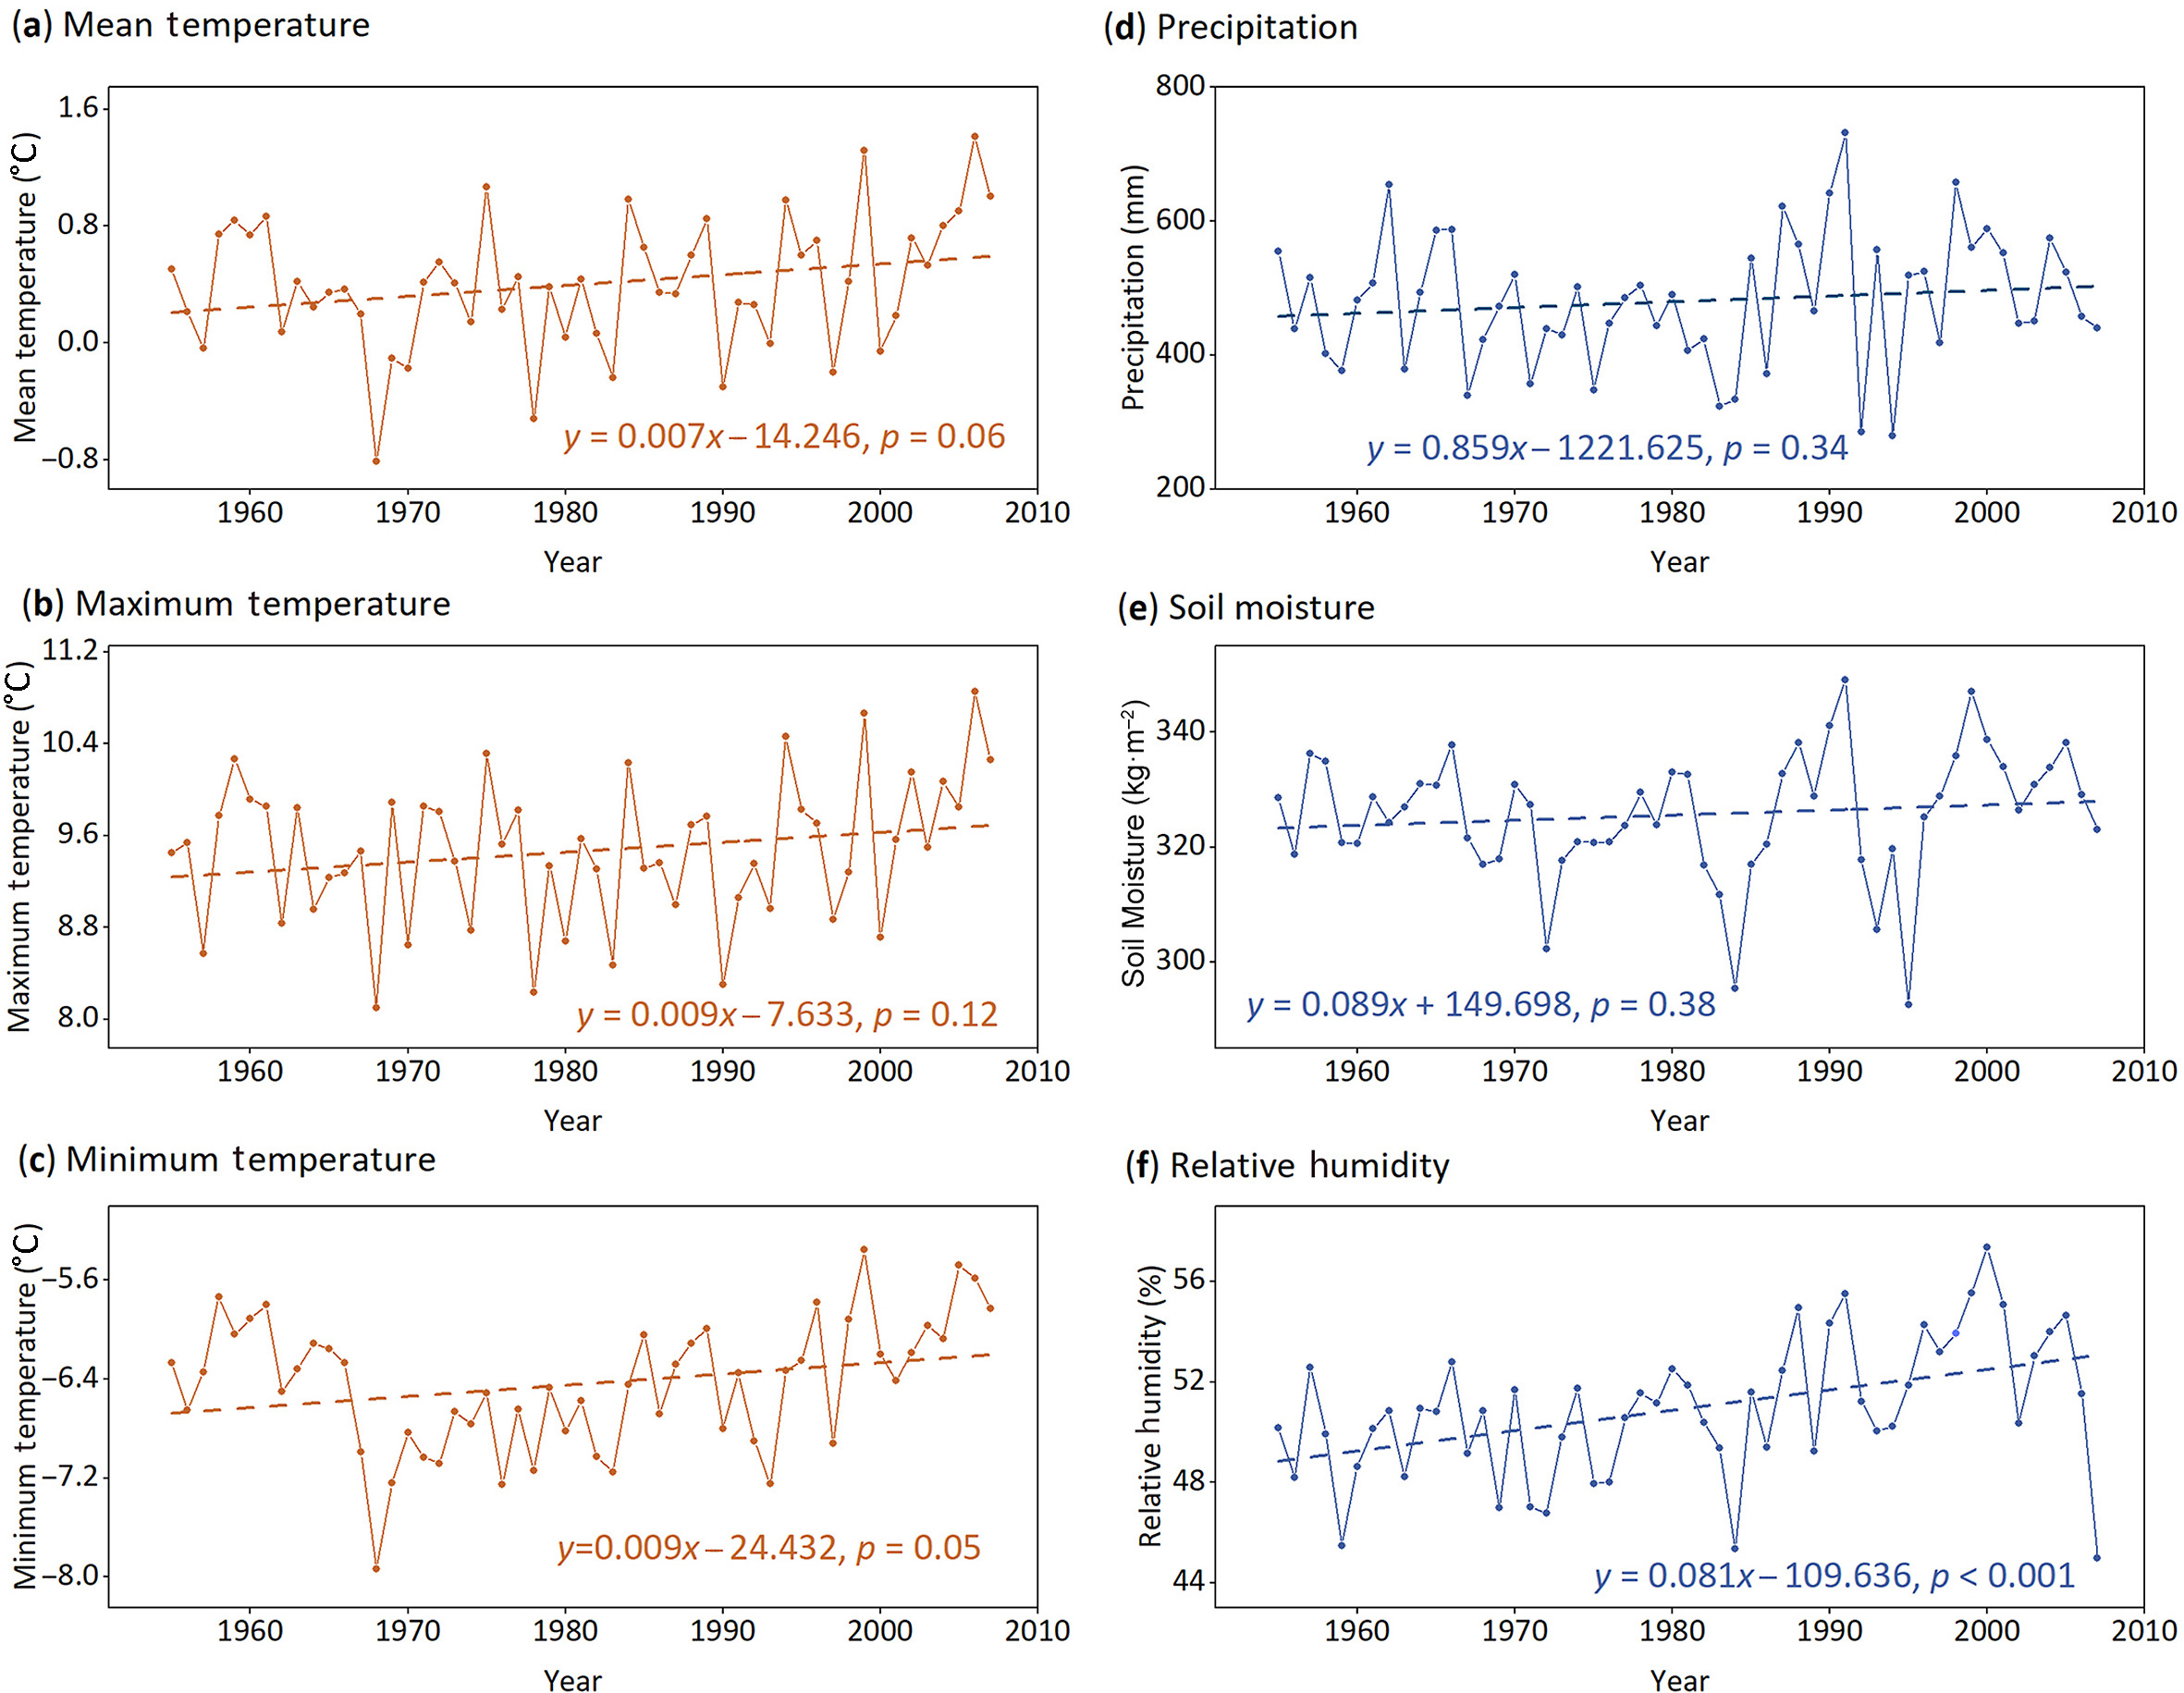
Our study site (97°02′ E, 31°07′ N) is at a natural alpine forest with rare human activities near Qamdo, southeastern Tibetan Plateau (Fig. 1a–c). The aridity index (AI) is 0.61, featuring a dry subhumid climate (0.50 < AI < 0.65) (Middleton and Thomas, 1997). According to the observations from Qamdo meteorological station during 1954–2007, the annual mean temperature (after elevation-corrected) is 0.42 ℃, the annual precipitation is 482 mm, and the annual relative humidity is 50.92%. In terms of the seasonal and monthly climate variations, summer (June–August) has the highest temperature of 7.88–8.95 ℃ and precipitation of 90–106 mm (Fig. 1b). By contrast, winter (December–February) has the lowest temperature of −9.39 ℃ to −6.54 ℃ and precipitation amount less than 10 mm (Fig. 1b). Relative humidity appears higher in the summer (59.30%–67.21%) than in the winter (36.54%–40.17%) (Fig. 1b). Regarding annual climate trends, the site seemingly experienced a "warmer-wetter" condition during 1954–2007 of our study period, although temperature (including maximum and minimum temperature), precipitation and soil moisture changes did not pass the significance test of p < 0.05, and only the increase of relative humidity was significant (p < 0.05) (Fig. 2).
Figure
1.
The geographic, climatic, and environmental features of the study site. (a) The geographic location of the study site (Qamdo). It is on the southeastern Tibetan Plateau, which is more humid than other parts of the Tibetan Plateau. (b) The monthly variations of temperature, precipitation, and relative humidity. There is higher (lower) temperature and more (less) precipitation in summer (winter). (c) The growing juniper (Ⅰ) and spruce (Ⅱ) environment at the study site. The mountain ridge is indicated by a white dashed line. Juniper grows on the sunny slope with more solar radiation and lower stand density, while spruce lives on the shady slope with less solar radiation and higher stand density. The photo was also previously published (Grieβinger et al., 2019).
Figure
2.
The trends of climatic factors during 1954–2007. The dots show the annual values from October of the previous year to September of the current year, and the dashed lines illustrate their linear trends. Linear functions and significances are denoted.
The sampled Tibetan juniper (J. tibetica) and Balfour spruce (P. balfouriana) are located close to the local subalpine alpine treeline with an elevation of 4,400–4,600 m a.s.l. (Grieβinger et al., 2019). Tibetan junipers grow on sunny slopes, with a canopy cover of 10% (Fig. 1c). By contrast, Balfour spruces live on shady slopes, with a higher canopy cover of up to 25% (Fig. 1c). Lichens are also abundant on the shady slope, indicating more humid microclimatic conditions than on the sunny slope, owing to lower radiation and higher humidity (Grieβinger et al., 2019). The sampled trees were cross-dated following the customary width-measuring steps. The width chronologies were built by fitting each width curve with a negative exponential function to remove long-term growth trends, after which the site chronology was produced by merging all individual tree series. At least 38 juniper and 26 spruce tree cores were used for establishing the original chronologies, and the chronologies were updated several times thereafter (Bräuning, 2001; Zhu et al., 2011). Five to seven tree cores of each species were selected for α-cellulose extraction and further isotopic analysis, given that a few tree samples (e.g., two to five cores) are sufficient to obtain a representative site isotope signal (Leavitt, 2010). A detailed process of sample selection and isotopic analysis and the presentation of the tree-ring δ13C and δ18O can be found in Grieβinger et al. (2019). The width and isotopic chronologies of spruce and juniper span multiple centuries summarized in Table S1. Here we only used the width and isotope chronologies during 1954–2007, their common period with available meteorological records, which also contains recent dramatic environmental changes.
2.2
iWUE calculation
The annual iWUE values were calculated using Eqs. 1 and 2 after collecting ca and atmospheric δ13C data and combining tree-ring δ13C data during 1954–2007 (Farquhar et al., 1982, 1989).
In Eq. 1, represents the discrimination of δ13C between the atmosphere (δ13Ca) and plant (δ13), the α-cellulose in this case. Meanwhile, is also a function of atmospheric and intercellular CO2 concentrations, i.e., ca and ci in the right equation. a (≈4.4‰) represents the isotopic fractionation during diffusion of CO2 entering plant cells through stomata, and b (≈27‰) represents the isotopic fractionation by carboxylation during photosynthesis. Annual δ13Ca data before 2004 were derived from McCarroll and Loader (2004), and the data was extended to 2007 and obtained from Mauna Loa CO2 observatory in National Atmospheric and Oceanic Administration (NOAA, https://www.esrl.noaa.gov/).
From Eq. 2, iWUE is the ratio of A and gs. Meanwhile, iWUE is also a function of ca and ci. After mathematical conversion, iWUE can be calculated using ca and data according to the right side of the equation. Annual ca data before 1959 were derived from McCarroll and Loader (2004), and the data during 1959–2007 were derived from NOAA's Mauna Loa CO2 observatory.
2.3
Climate data
The global aridity index data were derived from the Food and Agricultural Organization of the United Nations (FAO, https://data.apps.fao.org/map/catalog/srv/api/records/221072ae-2090-48a1-be6f-5a88f061431a), which has a spatial resolution of 19 km. The monthly temperature (mean, maximum and minimum temperature), precipitation, and relative humidity data during 1954–2007 were obtained from the nearest meteorological station of the China Meteorological Administration at Qamdo (97°10′ E, 31°09′ N). Considering the meteorological station (3,306 m a.s.l.) is 1,100–1,300 m lower than the sampling site, we corrected temperatures at sampling site by subtracting 7.2 ℃ (i.e., ), supposing that temperature drops by an average of 0.6 ℃ with every 100 m elevation.
Given that there was no in-situ soil moisture observation, soil moisture reanalysis data from Global Land Data Assimilation System (GLDAS) were utilized (Rodell et al., 2004). GLDAS dataset has a spatial resolution of 0.25° 0.25° and a temporal coverage from 1948 to 2014. The reliability of GLDAS soil moisture data on the study region has been validated in previous studies (Li et al., 2022). Therefore, the monthly root-zone soil moisture data from the closest grid in the GLDAS dataset were derived from https://ldas.gsfc.nasa.gov/gldas.
2.4
Statistical methods
Linear regressions were used to determine the trends of climate, tree-growth, and iWUE changes, and a t-test was used to determine the significance of the trends. Pearson correlation analyses were performed to assess the relative impacts of temperature, precipitation, and soil moisture on tree growth. To remove the effects of long-term trends, the first-difference time series of tree-ring width, representing the high-frequency growth changes, were also calculated and related to the first-difference climate changes (Huang et al., 2017). To further quantify the climates and CO2 impacts, commonality analyses were applied using the "yhat" package in R studio (Nimon and Oswald, 2013). The commonality analysis can partition the independent contribution of each predictor in multiple regression (i.e., the uniqueness coefficients) and contributions shared between each combination of predictors (also called the commonality coefficients) (Nimon and Oswald, 2013). Negative commonality coefficients are indicative of suppressor effects between predictors. It is suitable for cases where predictors (in our case, CO2, relative humidity, temperature, and soil moisture) are correlated.
To evaluate the extent to which iWUE was influenced by gs over time, we conducted a 11-year running correlation analysis between iWUE and tree-ring δ18O (Liu et al., 2019). Moreover, a dual-isotope conceptional model (δ13C and δ18O) was applied (Scheidegger et al., 2000; Grams et al., 2007; Barnard et al., 2012; Depardieu et al., 2024). Specifically speaking, we plotted δ18O and Δ13C changes on the x and y axes respectively (isotope values of the current year minus that of the previous year), and then inferred the relative changes in A and gs based on their position in the coordinate (Barnard et al., 2012). Note that we used Δ13C rather than raw tree-ring δ13C in the model, to avoid the effect of decreasing atmospheric δ13C (−6.87‰ in 1954 to −8.19‰ in 2007) on tree-ring δ13C values.
3.
Results
3.1
Tree growth and iWUE changes
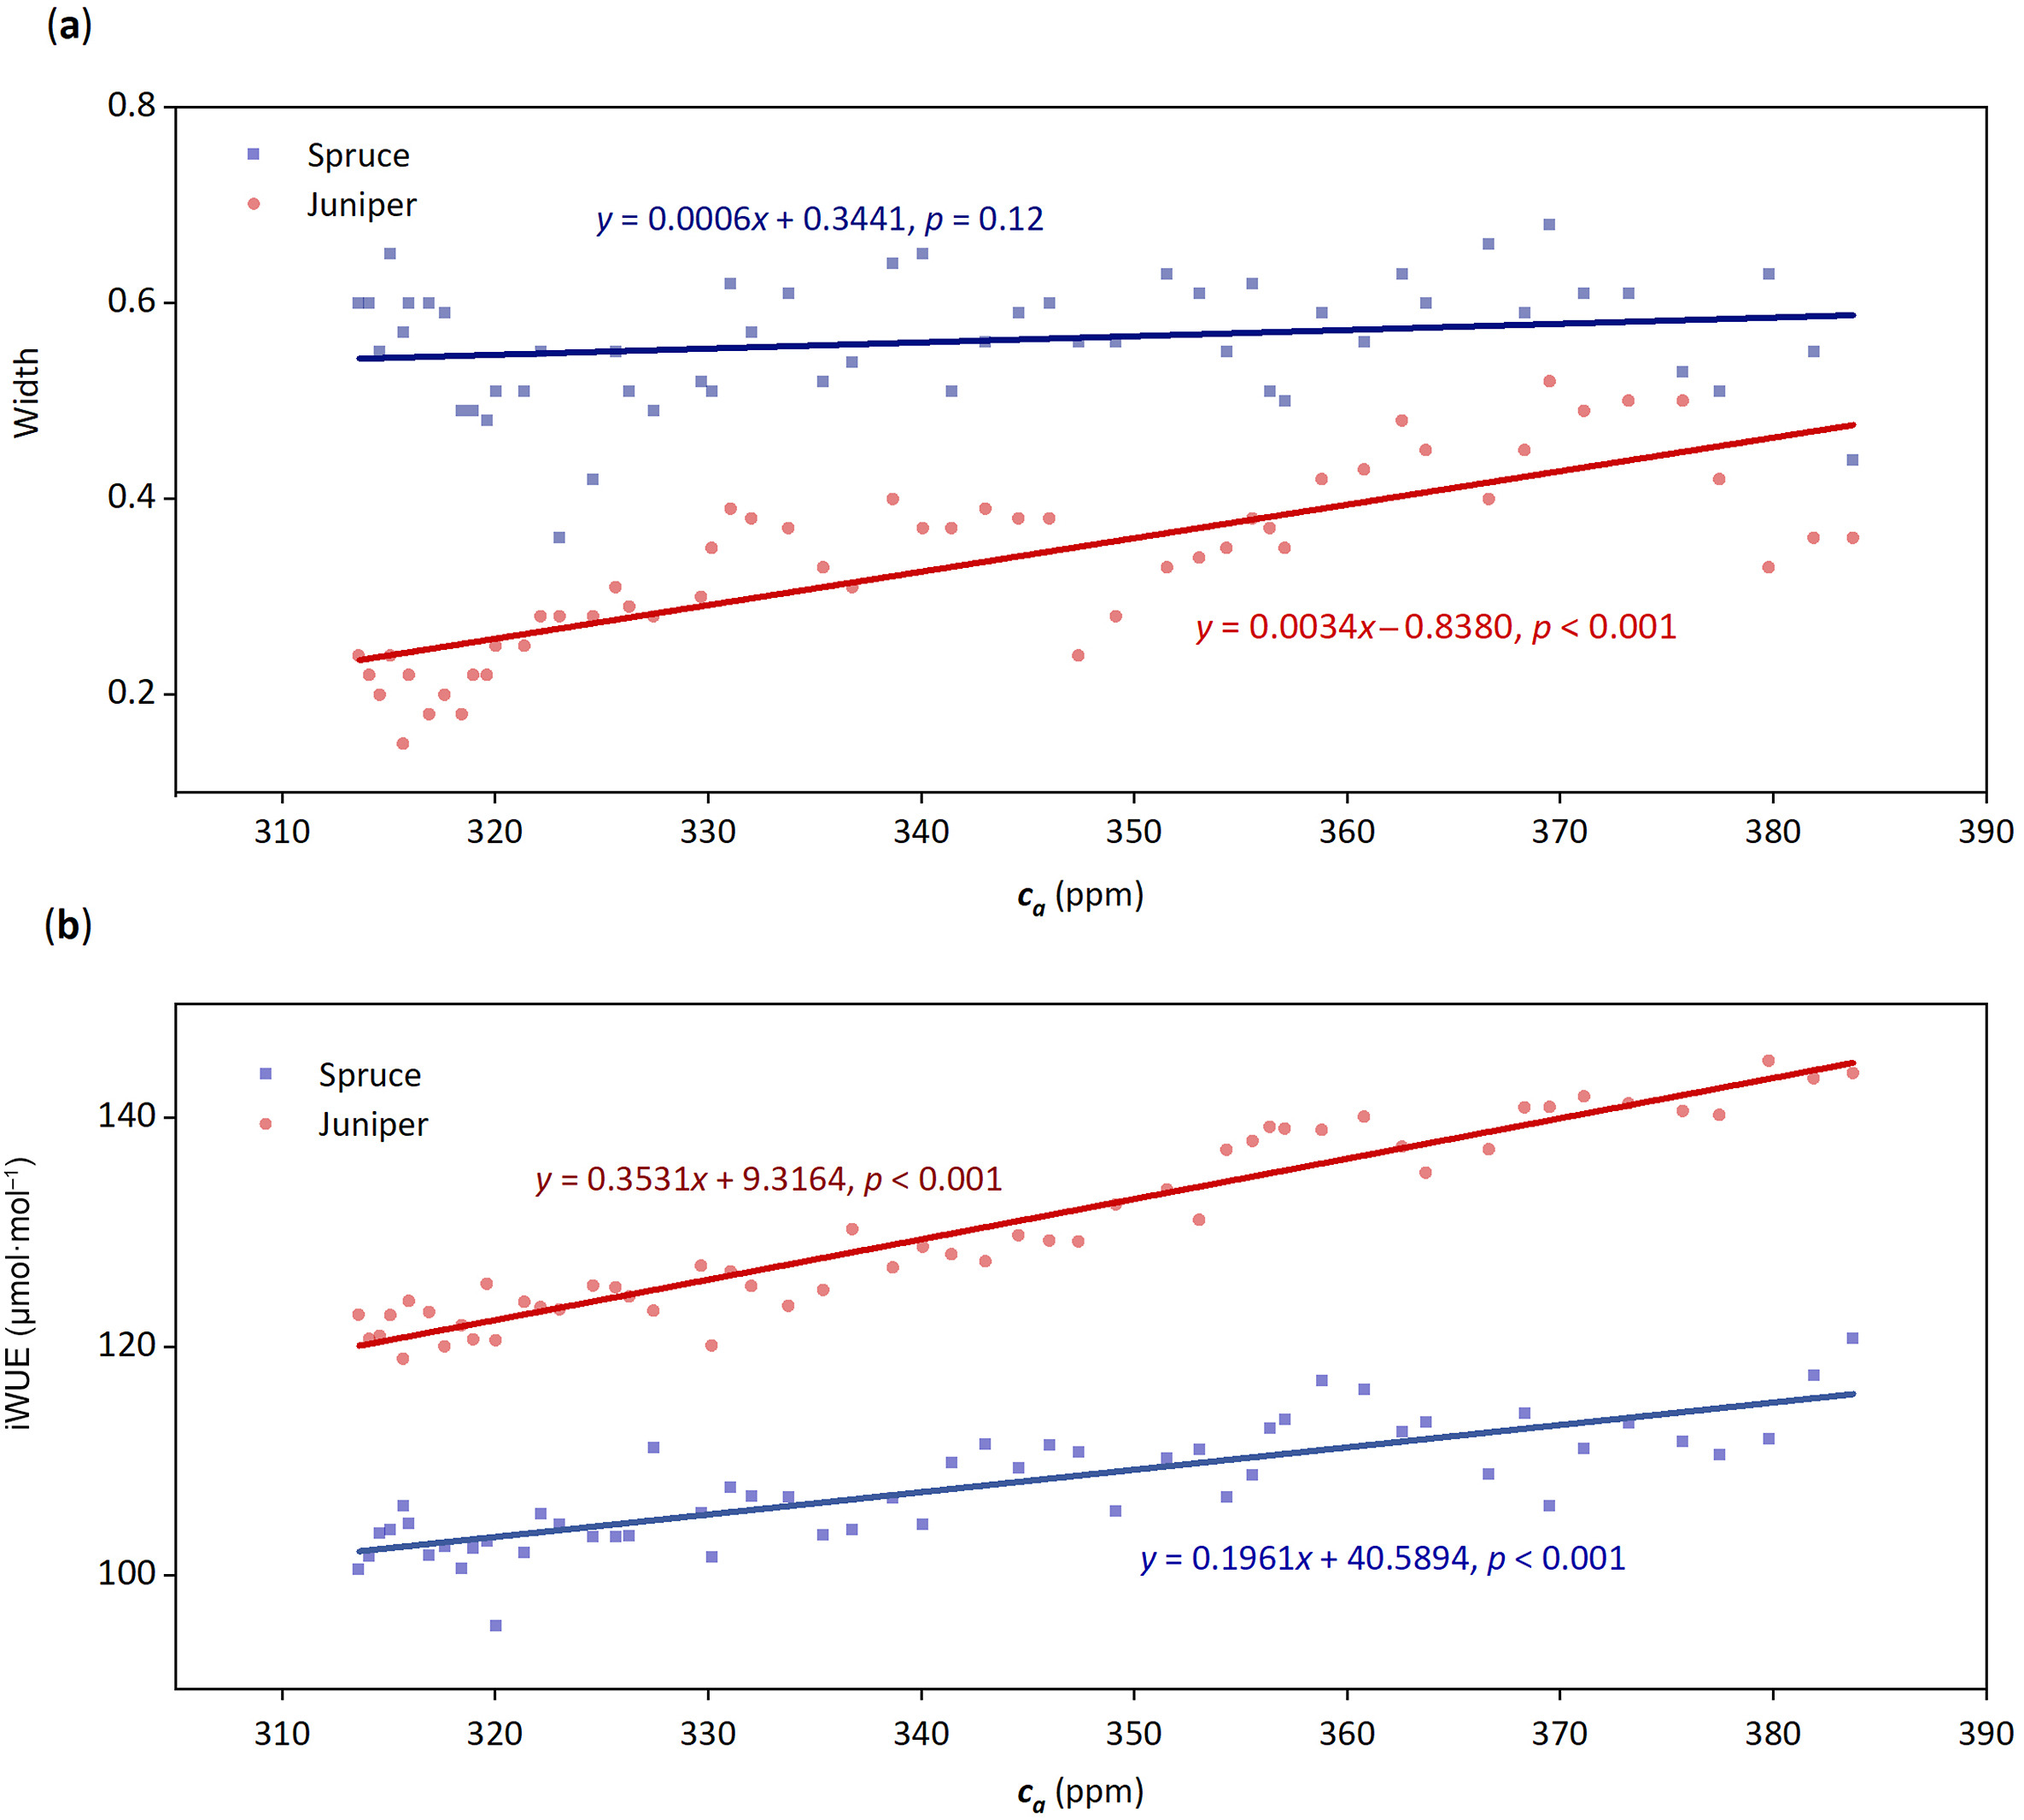
During the five decades (1954–2007), ca increased by 70.16 ppm, ranging from 313.60 to 383.76 ppm (Fig. 3, Fig. S1). Accompanied with ca elevation, the juniper growth showed a significantly rising trend (p < 0.001). Spruce, by contrast, maintained relatively steady growth with no stimulation or decline (Fig. 3a, Fig. S2a). Nevertheless, the interannual growth of juniper was still less than that of spruce during the whole study period (Fig. S2a).
Figure
3.
The growth (a) and iWUE changes (b) of spruce and juniper along with ca changes during the study period of 1954–2007. The lines indicate their linear trends, and the linear regression functions and significance are denoted.
Regarding the iWUE values, juniper had higher iWUE (118.93–145.01 μmol⋅mol−1) than spruce (95.59–120.71 μmol⋅mol−1) during 1954–2007 (Fig. 3b, Fig. S2b). Both juniper and spruce experienced a significant increasing trend as ca concentration increases (p < 0.001), with the absolute increasing rate of juniper (0.35 μmol⋅mol−1⋅ppm−1) 1.5 times higher that of spruce (0.20 μmol⋅mol−1⋅ppm−1) (Fig. 3b). However, compared with the values of initial years, the increasing amplitudes of the two species were similar, i.e., 22% for the juniper and 26% for the spruce.
3.2
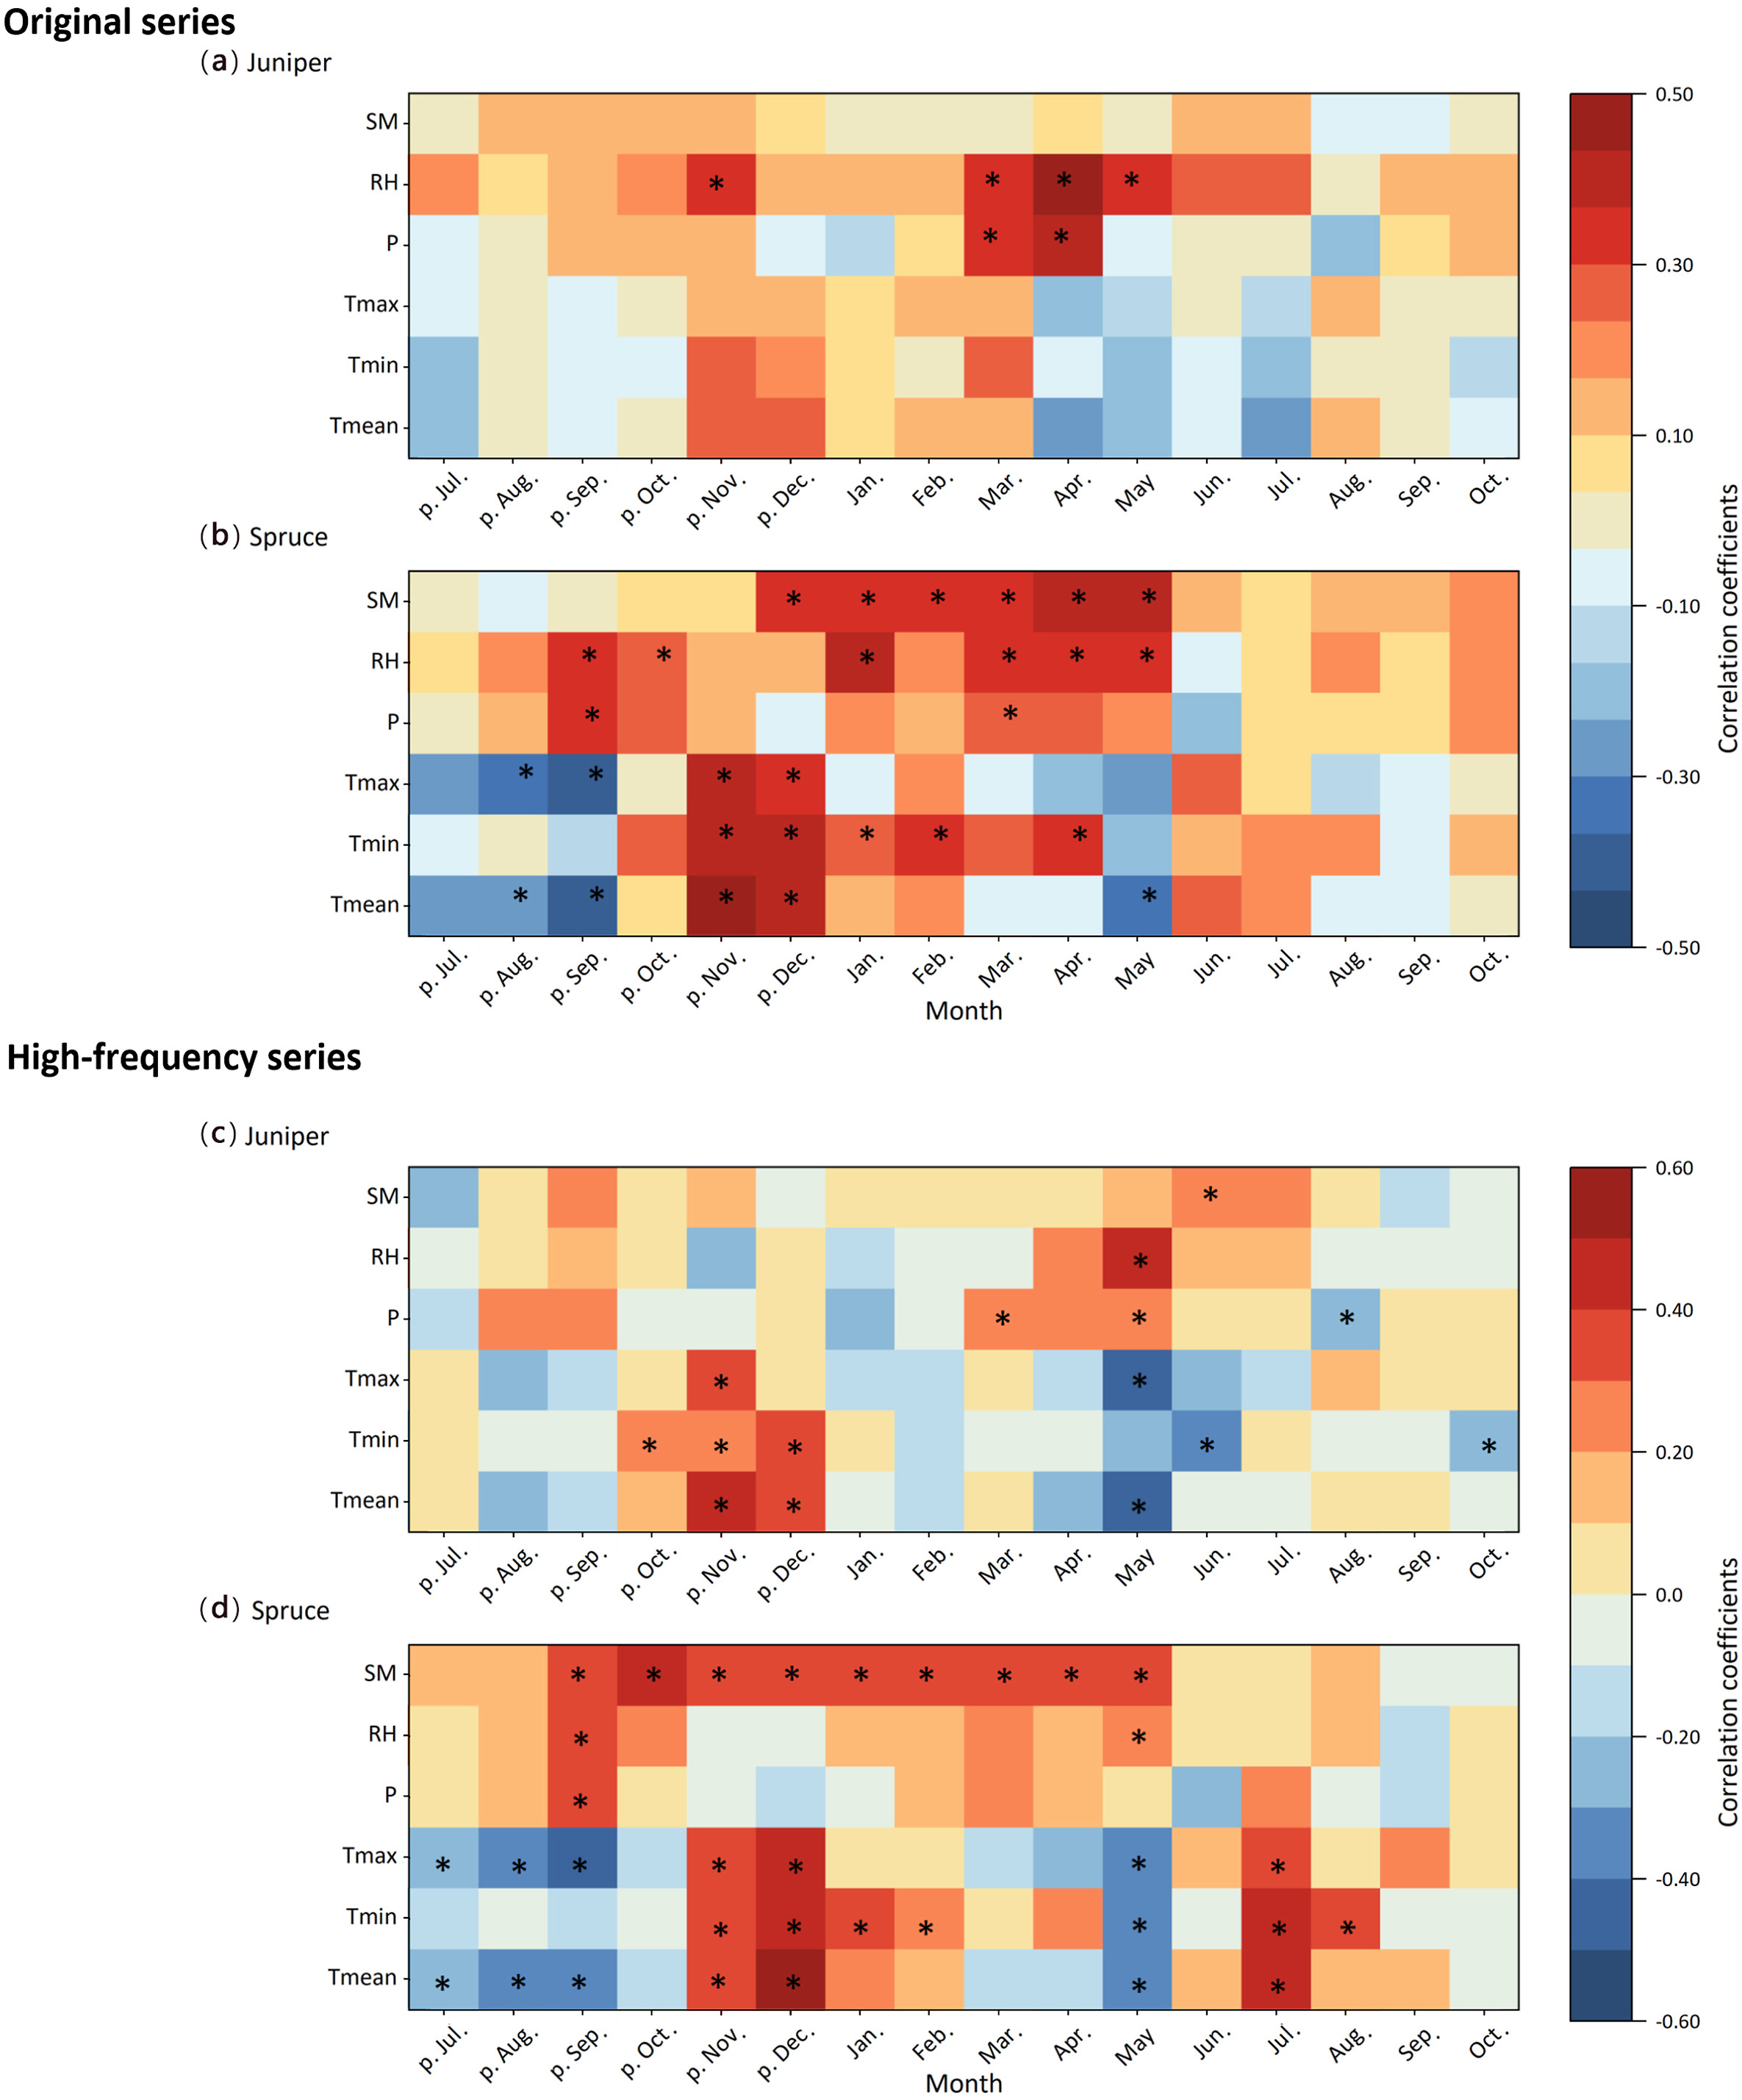
The correlations between tree growth and climate factors
We chose three hydroclimate factors (soil moisture, relative humidity and precipitation) and three temperature factors (mean, maximum, and minimum temperature) to investigate the tree-growth–climate relationships. Juniper and spruce at the study site exhibited different responses to the selected climate factors (Fig. 4). Juniper mainly showed significant positive correlations with spring (March–May) relative humidity and precipitation (p < 0.05), while it had no significant relationship with soil moisture and the three temperature factors in any of the months from July of the previous year to October of the current year (Fig. 4a). In particular, the juniper width chronology exhibited the highest correlation with April relative humidity, with a correlation coefficient of 0.49 (p < 0.001) during 1954–2007.
Figure
4.
Heatmaps of the correlations between tree growth of juniper and spruce and multiple climatic variables for the original series (a, b) and high-frequency (first-difference) series (c, d). Significant correlations (p < 0.05) were marked with "∗" symbols. SM: soil moisture; RH: relative humidity; P: precipitation; Tmax: maximum temperature; Tmin: minimum temperature; Tmean: mean temperature. In the horizontal axis, "p." indicates months of the previous year.
By contrast, spruce ring-widths had generally stronger connections with soil moisture and temperature (Fig. 4b). Notably, they had significant positive correlations with soil moisture of all months from winter to spring (December of the previous year to May of the current year). They were also significantly positively correlated with all three temperature factors (i.e., mean, maximum and minimum temperature) of November and December of the previous year, with the highest correlation coefficient of 0.46 between spruce and minimum temperature of the previous November (p < 0.001).
To exclude the possible impacts of long-term trends on correlation analysis, we also analyzed the correlation of the first-difference time series (Fig. 4c, d). In the high frequency, the positive correlations between winter temperature and juniper ring-width changed to significant (p < 0.05), with the highest correlation coefficient of 0.45 occurring in November of the previous year. Winter temperature also significantly correlated with spruce ring-width (p < 0.05), with the highest correlation coefficient of 0.54 in December of the previous year. Notably, the correlations between winter–spring soil moisture and spruce width stayed significant (p < 0.05).
3.3
The impacts of environmental factors on tree growth
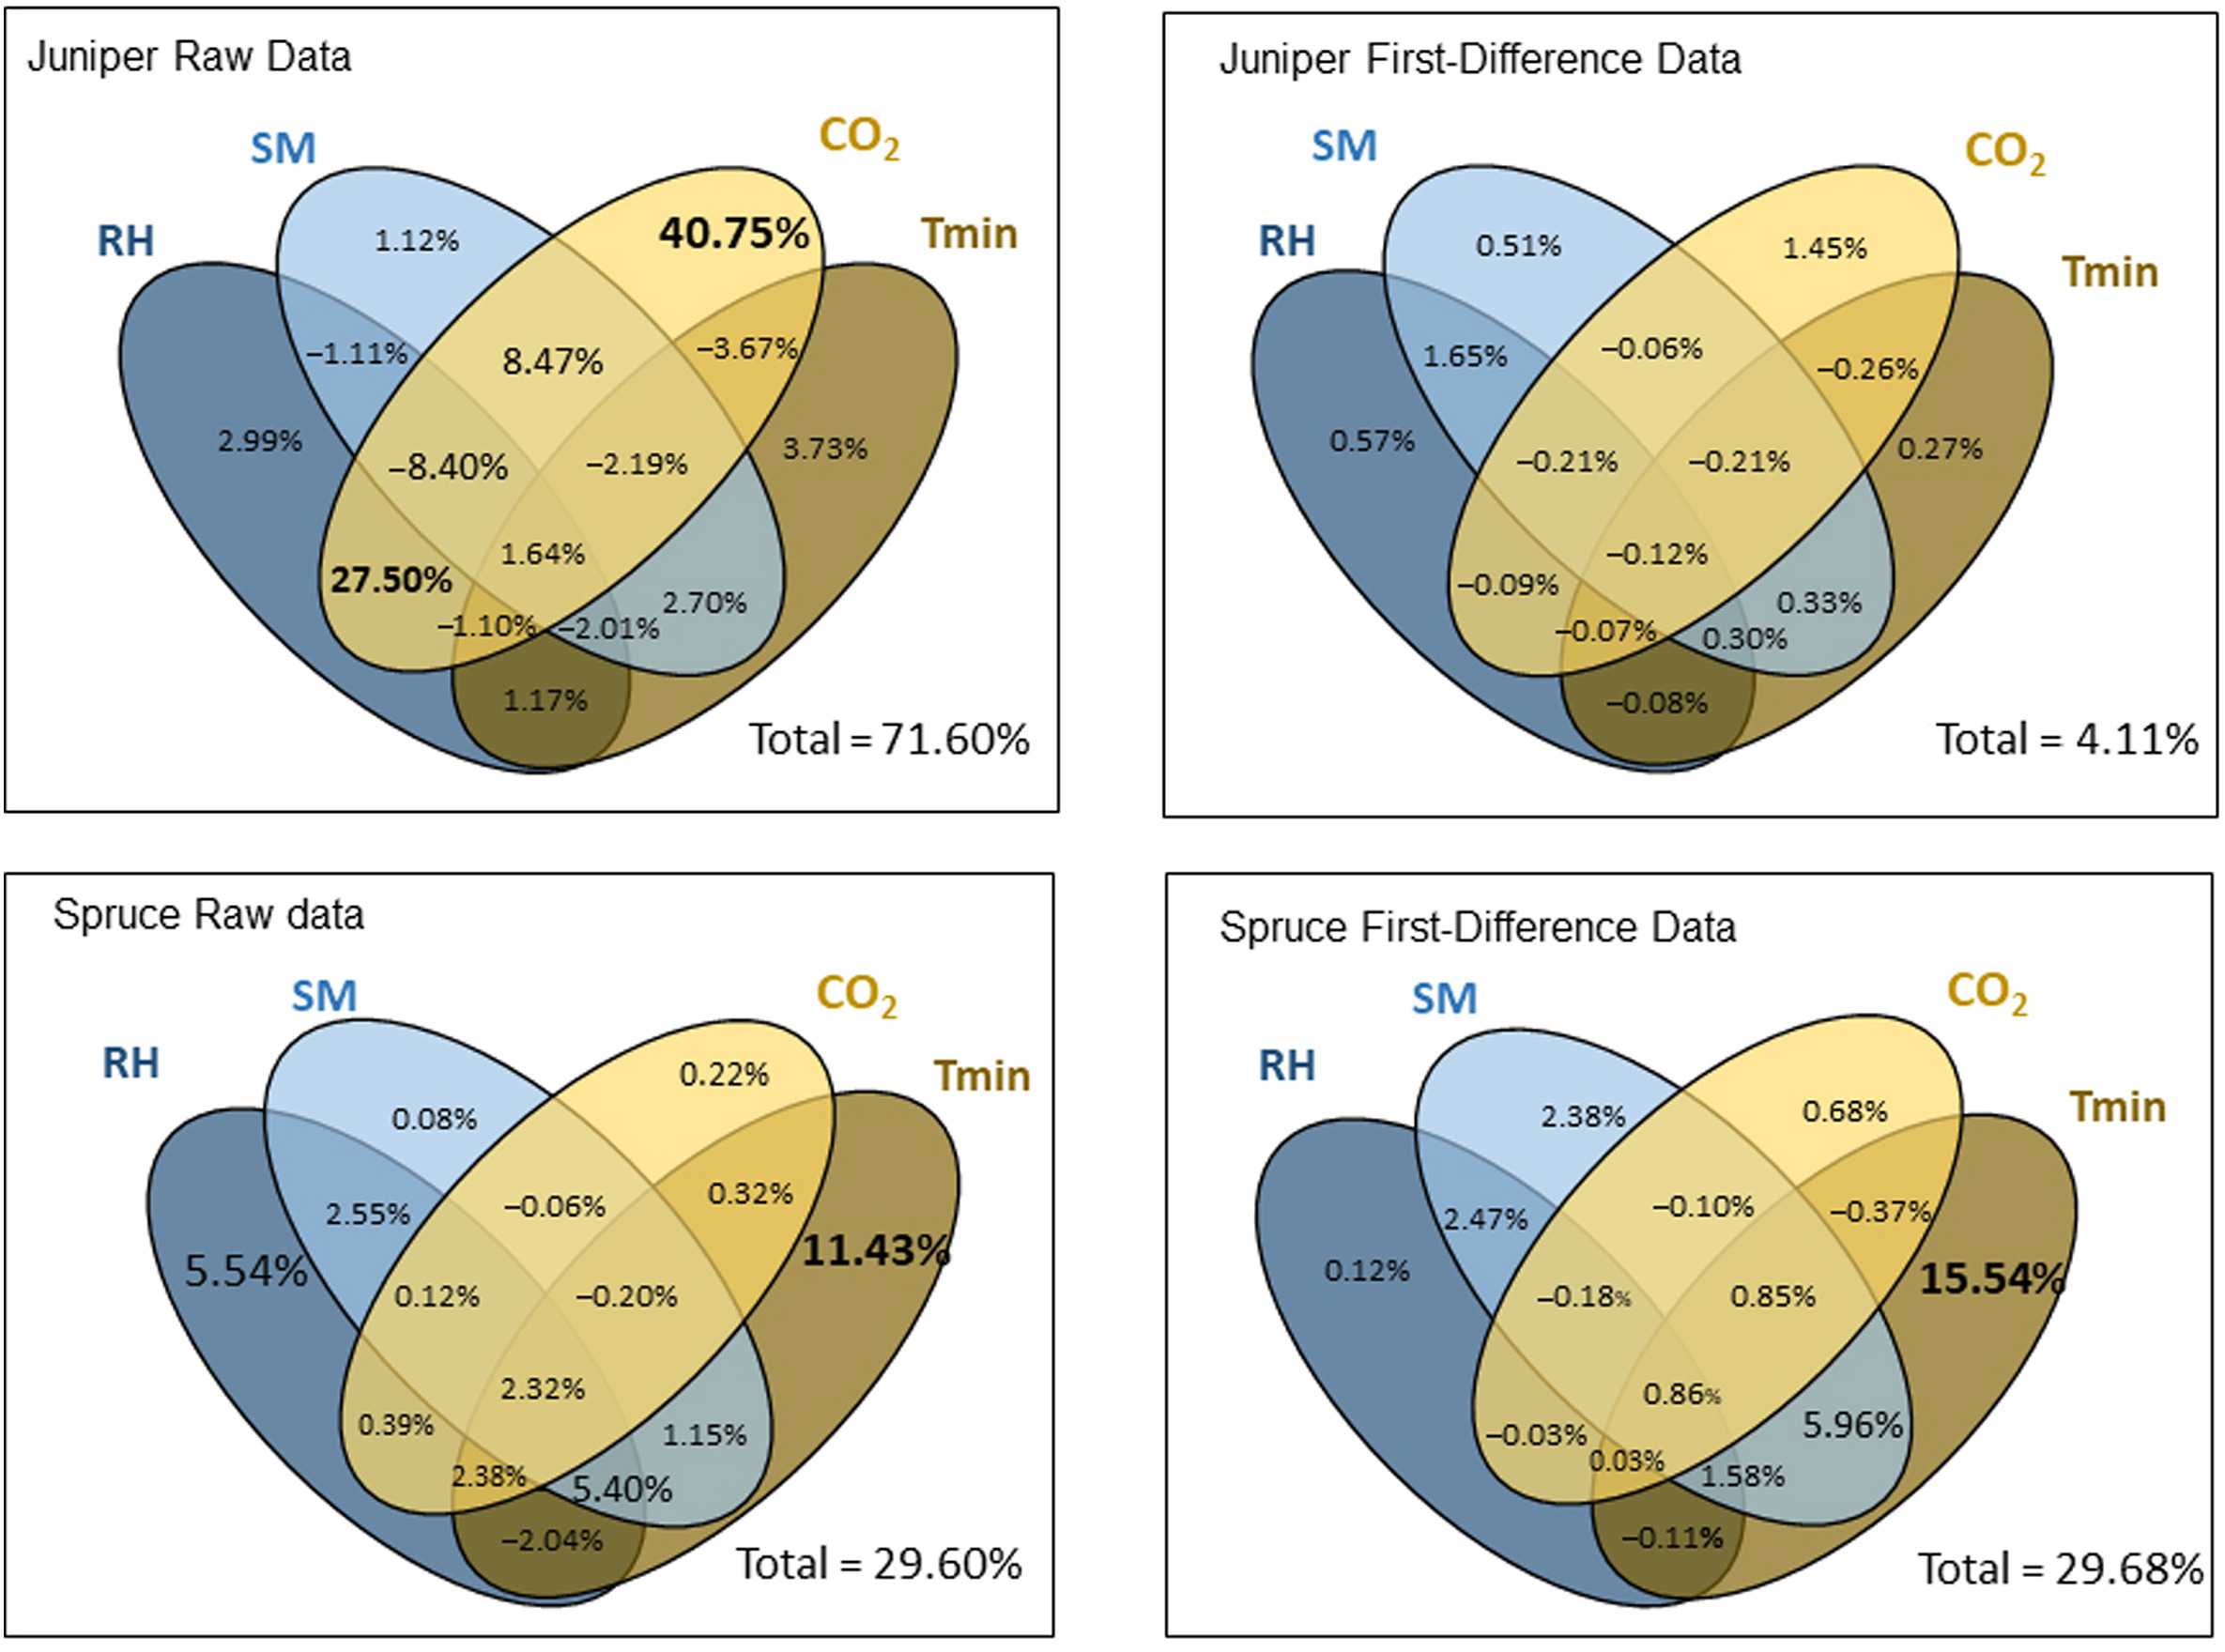
Fig. 5 quantifies the individual and combined impacts of ca, annual minimum temperature, relative humidity, and soil moisture on tree growth. The independent and joint impacts of ca changes account for 40.75% and 22.25% of the original ring-width increment for juniper, respectively. However, it explains only 1.45% in the year-to-year changes (the first-difference data). The annual soil moisture, relative humidity and temperature have positive but minimum effects on juniper growth both for the original raw data and first-difference data (0.27% and 3.73%, respectively). The combined effects of the three climatic factors on juniper growth are minimal.
Figure
5.
Results of commonality analysis disentangling the contributions of CO2, minimum temperature, relative humidity and soil moisture to tree growth of the two species. The contributions unique to each environmental factor (i.e., the uniqueness coefficients) and contributions shared between each combination of factors (i.e., the commonality coefficients) are indicated. The total contributions of the four factors are denoted in the lower-right corner of each graph. Minimum temperature, relative humidity and soil moisture data from October of the previous year to September of the current year were used, along with annual ca data.
By contrast to the results for the juniper trees, ca has negligible to no effect on spruce growth of both the original series (0.22%) and first-difference data (0.68%). Removing the ca effects, climatic factors constitute 24.11% of the original ring-width increments and 26.20% for the detrended ones. Minimum temperature has the most remarkable positive effects on spruce growth among the four factors, both for the raw data (independent impact of 11.43%) and first-difference data (independent impact of 15.54%). Soil moisture and relative humidity effects on spruce are also considerable. For example, relative humidity accounted for 5.54% changes for the original series of spruce, and the combined effects of relative humidity and minimum temperature were 5.96% for the high-frequency series.
3.4
Dual-isotope analysis to distinguish the relative impacts of A and gs on iWUE
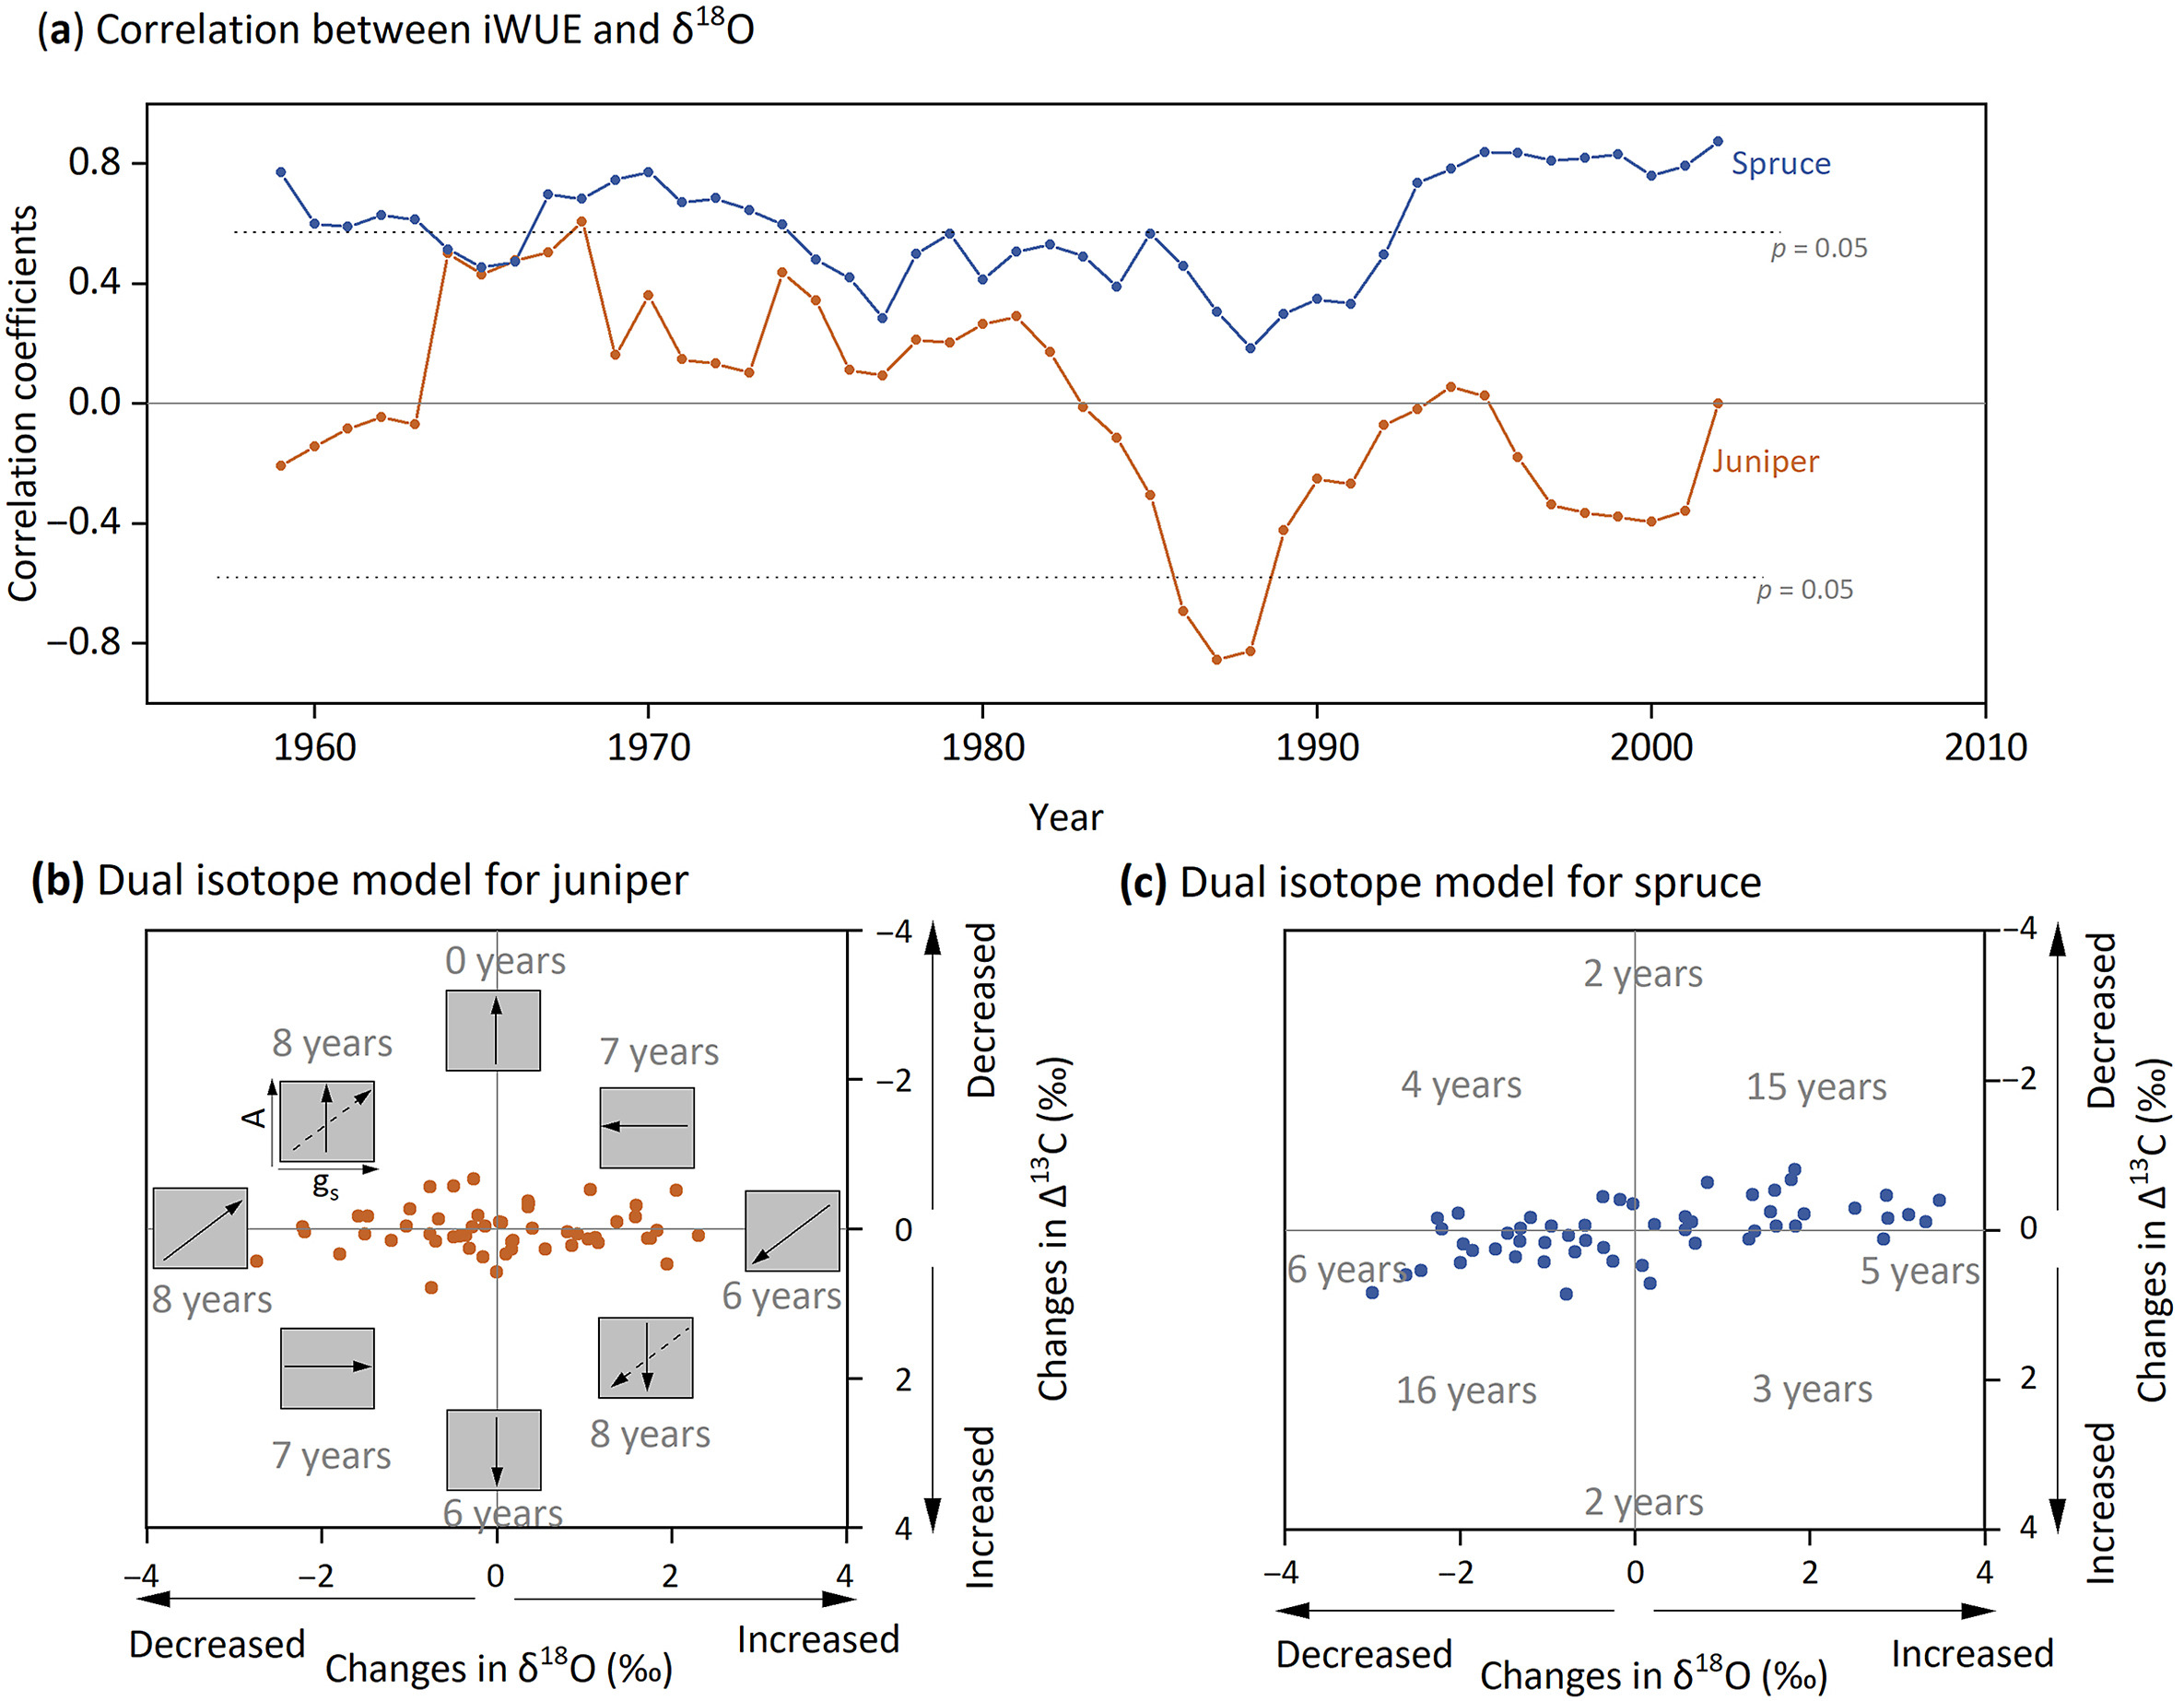
For juniper, the correlations between iWUE and tree-ring δ18O were almost insignificant over the study period (Fig. 6a). In contrast, spruce showed higher and more significant positive correlations between iWUE and tree-ring δ18O. Especially since the 1990s, these correlations have been increasing, indicating a stronger connection between iWUE and gs for spruce.
Figure
6.
Dual isotope analysis to distinguish relative impacts of photosynthesis rate (A) and stomatal conductance (gs) on iWUE. (a) The 11-year running correlation between iWUE and tree-ring δ18O chronologies of juniper (orange line) and spruce (blue line). A more significant positive correlation indicates a greater impact of stomatal conductance (gs) on iWUE. The correlation coefficient values at 95% significance level (n = 11) were illustrated using gray dashed lines. (b) and (c) illustrate the dual-isotope model to distinguish the relative impacts of A and gs on iWUE of juniper and spruce year to year, respectively. The model plots changes in δ18O and Δ13C (current year subtract previous year) in x and y axes. The relative changes in A and gs were based on their position in the coordinate, for example, a year with decreased Δ13C and no δ18O change compared to the previous year was inferred as solely A increase without gs changes. No changes of Δ13C are those with absolute values less than 0.1‰ (carbon isotope measurement precision), and similarly, no changes of δ18O are those with absolute values less than 0.2‰ (oxygen isotope measurement precision). Note that for juniper, there are three years with no changes in both Δ13C and δ18O, which are not shown in the figure.
We further applied the dual-isotope (Δ13C and δ18O) model to explain the relative impacts of A and gs on iWUE year to year (Fig. 6b, c). For juniper, iWUE changes driven solely by A accounted for 22 years, while those driven solely by gs accounted for 14 years. In contrast, for spruce, iWUE changes driven solely by A accounted for 11 years, whereas those driven solely by gs accounted for 31 years.
4.
Discussion
4.1
Divergent effects of ca and climate factors on the growth of juniper and spruce
Our results indicate that juniper and spruce had divergent climate responses and experienced distinct CFE at the study site. Rising ca contributed to increasing juniper growth, while moisture availability constrained spruce growth (Figs. 3–5). The results are consistent with a previous study in which soil moisture exhibited a more substantial impact on spruce rather than juniper (Wang et al., 2021). However, without experiencing increasingly arid conditions in the investigation period (Fig. 2), spruce growth did not decline as it did in the dry area (Wang et al., 2021). This is also supported by many studies suggesting that water availability restricts tree growth in cold, high-altitude regions, even at treeline locations (He et al., 2013; Liang et al., 2014; Fang et al., 2015; Reich et al., 2018; Gao et al., 2022). For example, Lyu et al. (2019) showed that droughts could even limit the growth of trees at the highest treeline in the Northern Hemisphere. A large-scale dendrochronological study over North American boreal forests also found no accelerated forest growth from warming, owing to an enhanced dependence of forest growth on moisture in recent decades (Girardin et al., 2016). Our study provides new evidence that moisture availability hindered the CFE on spruce at the treeline location, supporting the proposed Hp2.
It is noteworthy that we only considered the contributions of four main factors to tree growth in commonality analysis (Fig. 5), and other condition (e.g., nutrients, radiation, competition) could also exert great impact (Jiang et al., 2018; Du et al., 2020; Guo et al., 2022). These unavailable data might account for the remaining variance of tree growth, which was not explained by the four chosen factors (Fig. 5).
4.2
Physiological explanation for the different growth patterns
Exploring iWUE changes and the relative contribution of A and gs to iWUE helps understand the different growth patterns of the two tree species. According to the dual isotope analysis, iWUE of juniper was more influenced by A while spruce's iWUE was mainly modulated by gs (Fig. 6). This distinction helps explain the growth stimulation in juniper and the stable growth in spruce. These results well support the proposed Hp1.
Many reasons could account for the different water use strategies in juniper and spruce. For example, junipers grow on sunny, south-facing slopes with lower density compared to spruces, which predominantly occupy the shadier, moister north-facing slopes with higher density (Fig. 1b). Consequently, each juniper may receive more sunlight and have greater access to water for photosynthesis, thereby influencing their ecological adaptations. Moreover, the juniper was hundreds-of-years older than spruce (Table S1), and they possibly require less water for evapotranspiration than the younger trees (Perry and Jones, 2017). Additionally, their hydraulic traits are different. As an anisohydric species, juniper tends to keep open stomata and maximize carbon assimilation, while isohydric spruce is apt to close stomata, limiting CO2 uptake and assimilation (Wang et al., 2021). Other functional traits, such as specific leaf area and stomatal density, which were not measured in the study, may also affect water use and corresponding growth differences.
However, the results contradict Mathias and Thomas (2021), whose global dual isotope network indicated no significant gs changes in either juniper or spruce since the 1960s at the site. The precipitation δ18O calculation, which was used to estimate leaf water δ18O discrimination (Δ18Olw) by Mathias and Thomas (2021), was based on an empirical model. Admittedly the model is valuable in the absence of precipitation δ18O observations (Guerrieri et al., 2022). Nevertheless, it probably bears uncertainties at specific sites (Lin et al., 2022). At Qamdo of our study site, the precipitation δ18O is mainly influenced by precipitation amount/temperature in the rainy/dry season (Yu et al., 2017). Therefore, the empirical equation that Mathias and Thomas (2021) used for estimating precipitation δ18O assigned a fixed weighting of temperature and precipitation on annual precipitation δ18O, which could probably result in inaccurate estimates of Δ18Olw and gs changes at the site. If the two species have similar physiological responses, i.e., increasing A, as the previous study suggested (Mathias and Thomas, 2021), it would be hard to explain why the growth of juniper accelerated while that of spruce remained the same in this area.
Though increasing ca and iWUE could explain the accelerating trend of the juniper growth, it is worth noting that many factors could control the juniper growth at the interannual timescale. The correlation between juniper iWUE and width of the first-difference sequences is low, almost 0. Likewise, ca has minimal contribution to year-to-year juniper growth (1.45%) (Fig. 5). The heat maps indicate no obvious limiting factor for the growth of juniper in this study area (Fig. 4). This means that in different years, changes of multiple environmental factors may affect the growth of trees to varying degrees, which may lead to the difference in the fluctuation of tree growth and iWUE year by year. For example, in a dry year, iWUE of juniper may significantly increase, but its growth may be lower than the previous year because of water shortage. Nevertheless, ca and iWUE generally increased steadily, resulting in an accelerated trend of juniper growth. A similar result of the contribution of ca and iWUE on the increasing growth trend rather than on the interannual-timescale changes was also presented in a previous study (Huang et al., 2017).
4.3
Implication and limitations
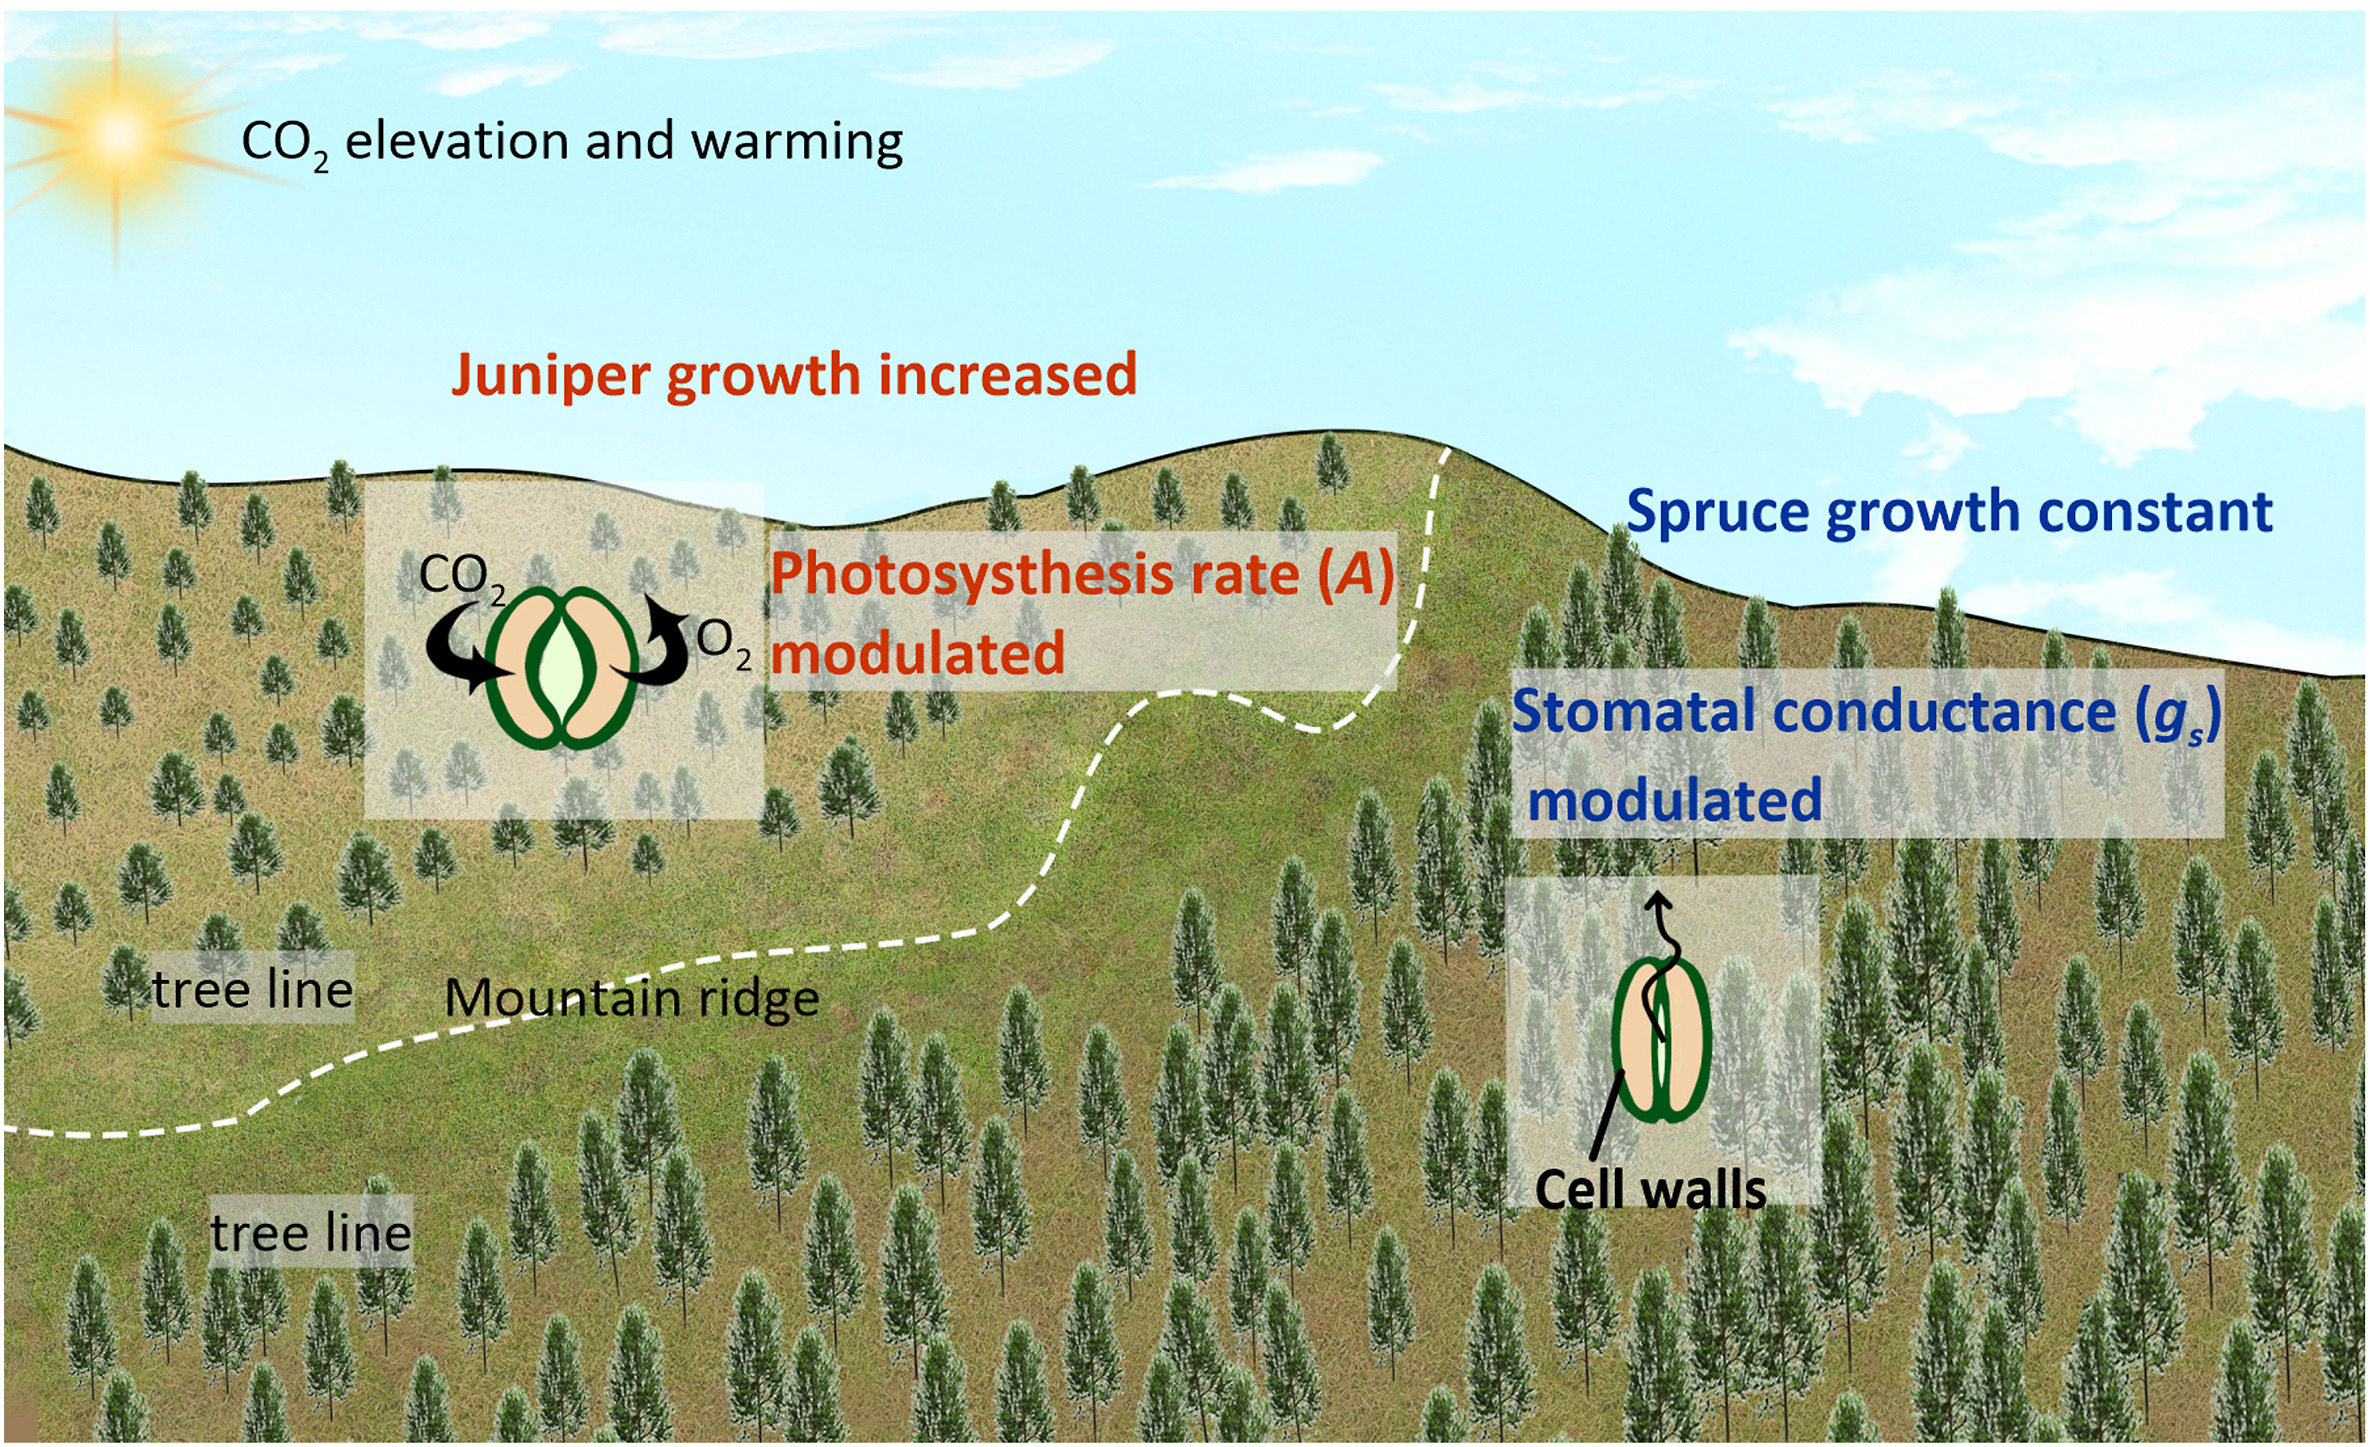
Our results have significant implication in tree growth prediction and vegetation productivity modeling. Firstly, we suggest that predicting tree growth dynamics at alpine forests based on the growth-temperature relationship may be inadequate, as they are likely to be moisture-limited (Fig. 4) (Fang et al., 2015; Girardin et al., 2016; Lyu et al., 2019). Secondly, the results imply that although being the same plant functional type (PFT) (evergreen needle-leaf) at the same site, vegetation could exhibit significant physiological dynamics and growth-pattern difference. Adapting to rising ca and climate changes, spruce tends to modulate gs while juniper mainly changes A (Fig. 7). Moreover, previous dendrochronological evidence implies that trees with different PFTs could have similar rates of change of iWUE and tree growth over recent decades (Zhang et al., 2018). Ignoring these significant variations within PFTs and similar responses among PFTs could result in inaccurate simulation of carbon cycle processes in DGVMs (e.g., Wright et al., 2005; Pavlick et al., 2013). A functional traits-based scheme seems more appropriate to monitor vegetation productivity (van Bodegom et al., 2012).
Figure
7.
A schematic diagram showing different physiological responses and growth trends of juniper and spruce at the study site. Under CO2 and temperature increasing, juniper modulated photosynthesis rate (A), while spruce modulated stomatal conductance (gs). As a result, juniper growth was accelerated, but spruce growth stayed constant.
The primary limitation of the study is the uncertainty inherent in the tree-ring dual-isotope model. Initially designed for leaf organic matters, this model may not be as effective for tree rings (Scheidegger et al., 2000). In certain instances, variations in tree-ring δ18O could indicate shifts in water source regimes rather than changes in gs (Roden and Siegwolf, 2012; Lin et al., 2022). Moreover, our analysis only inferred the relative changes in A and gs from one year to the next, rather than their absolute changes (Fig. 6b, c). Despite these uncertainties, tree-ring dual isotopes likely remain the most effective indicators for understanding plant physiology over extended periods (Siegwolf et al., 2023; Depardieu et al., 2024).
5.
Conclusion
To summarize, we detected different growth trends and physiological responses of juniper and spruce to climate changes during 1954–2007 in an alpine environment on the southeastern Tibetan Plateau. Adapting to rising ca, juniper mainly modulated A, while spruce regulated gs. As a result, juniper growth was significantly enhanced, but spruce growth stayed constant, though the increasing amplitudes in iWUE of both tree species were similar. Water availability limited spruce growth at the upper treeline location even in this sub-humid region, but it had less impact on juniper growth. These findings suggest A increases might not be as widespread as models and the previous global isotope network suggested. The divergent tree growth, physiological processes, and thus CFE of trees with the same PFT at the same site implies that the PFT-based DGVMs could benefit from our findings to improve forest productivity modeling.
Availability of data and materials
The tree-ring data used in the study can be requested to the co-author Jussi Grieβinger (Jussi.griessinger@plus.ac.at). Access to other data have been described in the Materials and Methods section.
Conflict of interest
The authors declare that they have no known competing financial interests or personal relationships that could have appeared to influence the work reported in this paper.
Barnard, H.R., Brooks, J.R., Bond, B.J., 2012. Applying the dual-isotope conceptual model to interpret physiological trends under uncontrolled conditions. Tree Physiol. 32 (10), 1183–1198. .
Bräuning, A., 2001. Climate history of the Tibetan plateau during the last 1000 years derived from a network of juniper chronologies. Dendrochronologia 19, 127–137.
Brooks, J.R., Mitchell, A.K., 2011. Interpreting tree responses to thinning and fertilization using tree-ring stable isotopes. New Phytol. 190 (3), 770–782. .
Chen, C., Riley, W.J., Prentice, I.C., Keenan, T.F., 2022. CO2 fertilization of terrestrial photosynthesis inferred from site to global scales. Proc. Natl. Acad. Sci. USA 119 (10), e2115627119. .
Depardieu, C., Lenz, P., Marion, J., Nadeau, S., Girardin, M.P., Marchand, W., Bégin, C., Treydte, K., Gessler, A., Bousquet, J., Savard, M.M., 2024. Contrasting physiological strategies explain heterogeneous responses to severe drought conditions within local populations of a widespread conifer. Sci. Total Environ. 923, 171174. .
Du, E., Terrer, C., Pellegrini, A.F., Ahlström, A., van Lissa, C.J., Zhao, X., Xia, N., Wu, X., Jackson, R.B., 2020. Global patterns of terrestrial nitrogen and phosphorus limitation. Nat. Geosci. 13 (3), 221–226. .
Fang, K., Frank, D., Zhao, Y., Zhou, F., Seppä, H., 2015. Moisture stress of a hydrological year on tree growth in the Tibetan Plateau and surroundings. Environ. Res. Lett. 10 (3), 034010. .
Farquhar, G.D., O'Leary, M.H., Berry, J.A., 1982. On the relationship between carbon isotope discrimination and the intercellular carbon dioxide concentration in leaves. Funct. Plant Biol. 9 (2), 121–137.
Gao, S., Liang, E., Liu, R., Babst, F., Camarero, J.J., Fu, Y.H., Piao, S., Rossi, S., Shen, M., Wang, T., Peñuelas, J., 2022. An earlier start of the thermal growing season enhances tree growth in cold humid areas but not in dry areas. Nat. Ecol. Evol. 6 (4), 397–404. .
Gessler, A., Cailleret, M., Joseph, J., Schönbeck, L., Schaub, M., Lehmann, M., Treydte, K., Rigling, A., Timofeeva, G., Saurer, M., 2018. Drought induced tree mortality–a tree-ring isotope based conceptual model to assess mechanisms and predispositions. New Phytol. 219 (2), 485–490. .
Girardin, M.P., Bouriaud, O., Hogg, E.H., Kurz, W., Zimmermann, N.E., Metsaranta, J.M., de Jong, R., Frank, D.C., Esper, J., Büntgen, U., Guo, X.J., 2016. No growth stimulation of Canada's boreal forest under half-century of combined warming and CO2 fertilization. Proc. Natl. Acad. Sci. USA 113 (52), E8406-E8414. .
Grams, T.E., Kozovits, A.R., Häberle, K.H., Matyssek, R., Dawson, T.E., 2007. Combining δ13C and δ18O analyses to unravel competition, CO2 and O3 effects on the physiological performance of different-aged trees. Plant Cell Environ. 30 (8), 1023–1034. .
Grießinger, J., Bräuning, A., Helle, G., Schleser, G.H., Hochreuther, P., Meier, W.J.H., Zhu, H., 2019. A dual stable isotope approach unravels common climate signals and species-specific responses to environmental change stored in multi-century tree-ring series from the Tibetan plateau. Geosciences 9 (4), 151. .
Guerrieri, R., Belmecheri, S., Ollinger, S.V., Asbjornsen, H., Jennings, K., Xiao, J., Stocker, B.D., Martin, M., Hollinger, D.Y., Bracho-Garrillo, R., Clark, K., 2019. Disentangling the role of photosynthesis and stomatal conductance on rising forest water-use efficiency. Proc. Natl. Acad. Sci. USA 116 (34), 16909–16914. .
Guerrieri, R., Belmecheri, S., Asbjornsen, H., Xiao, J., Hollinger, D.Y., Clark, K., Jennings, K., Kolb, T.E., Munger, J.W., Richardson, A.D., Ollinger, S.V., 2022. Detecting long-term changes in stomatal conductance: challenges and opportunities of tree-ring δ18O proxy. New Phytol. 236 (3), 809. .
Guo, Y., Zhang, L., Yang, L., Shen, W., Pan, Y., Wright, I.J., Luo, Y., Luo, T., 2022. Enhanced leaf turnover and nitrogen recycling sustain CO2 fertilization effect on tree-ring growth. Nat. Ecol. Evol. 6 (9), 1271–1278. .
He, M., Yang, B., Bräuning, A., 2013. Tree growth–climate relationships of Juniperus tibetica along an altitudinal gradient on the southern Tibetan Plateau. Trees (Berl.) 27, 429–439. .
Huang, R., Zhu, H., Liu, X., Liang, E., Grießinger, J., Wu, G., Li, X., Bräuning, A., 2017. Does increasing intrinsic water use efficiency (iWUE) stimulate tree growth at natural alpine timberline on the southeastern Tibetan Plateau? Global Planet. Change 148, 217–226. .
Jiang, X., Huang, J.G., Cheng, J., Dawson, A., Stadt, K.J., Comeau, P.G., Chen, H.Y.H., 2018. Interspecific variation in growth responses to tree size, competition and climate of western Canadian boreal mixed forests. Sci. Total Environ. 631–632, 1070–1078. .
Lavergne, A., Daux, V., Villalba, R., Pierre, M., Stievenard, M., Srur, A.M., 2017. Improvement of isotope-based climate reconstructions in Patagonia through a better understanding of climate influences on isotopic fractionation in tree rings. Earth Planet Sci. Lett. 459, 372–380. .
Leavitt, S.W., 2010. Tree-ring C–H–O isotope variability and sampling. Sci. Total Environ. 408 (22), 5244–5253. .
Li, N., Zhou, C., Zhao, P., 2022. The validation of soil moisture from various sources and its influence factors in the Tibetan Plateau. Rem. Sens. 14 (16), 4109. .
Liang, E., Dawadi, B., Pederson, N., Eckstein, D., 2014. Is the growth of birch at the upper timberline in the Himalayas limited by moisture or by temperature? Ecology 95 (9), 2453–2465. .
Lin, W., Barbour, M.M., Song, X., 2022. Do changes in tree-ring δ18O indicate changes in stomatal conductance? New Phytol. 236, 803–808. .
Liu, X., Zhao, L., Voelker, S., Xu, G., Zeng, X., Zhang, X., Zhang, L., Sun, W., Zhang, Q., Wu, G., Li, X., 2019. Warming and CO2 enrichment modified the ecophysiological responses of Dahurian larch and Mongolia pine during the past century in the permafrost of northeastern China. Tree Physiol. 39 (1), 88–103. .
Lyu, L., Zhang, Q.B., Pellatt, M.G., Büntgen, U., Li, M.H., Cherubini, P., 2019. Drought limitation on tree growth at the Northern Hemisphere's highest tree line. Dendrochronologia 53, 40–47. .
Mathias, J.M., Thomas, R.B., 2021. Global tree intrinsic water use efficiency is enhanced by increased atmospheric CO2 and modulated by climate and plant functional types. Proc. Natl. Acad. Sci. USA 118 (7), e2014286118. .
McCarroll, D., Loader, N.J., 2004. Stable isotopes in tree rings. Quat. Sci. Rev. 23 (7-8), 771–801. .
Middleton, N., Thomas, D., 1997. World Atlas of Desertification, second ed. Arnold, Hodder Headline, PLC, London.
Nimon, K.F., Oswald, F.L., 2013. Understanding the results of multiple linear regression: beyond standardized regression coefficients. Organ. Res. Methods 16 (4), 650–674. .
Pavlick, R., Drewry, D.T., Bohn, K., Reu, B., Kleidon, A., 2013. The Jena Diversity-Dynamic Global Vegetation Model (JeDi-DGVM): a diverse approach to representing terrestrial biogeography and biogeochemistry based on plant functional trade-offs. Biogeosciences 10 (6), 4137–4177. .
Peñuelas, J., Canadell, J.G., Ogaya, R., 2011. Increased water-use efficiency during the 20th century did not translate into enhanced tree growth. Global Ecol. Biogeogr. 20 (4), 597–608. .
Perry, T.D., Jones, J.A., 2017. Summer streamflow deficits from regenerating Douglas-fir forest in the Pacific Northwest, USA. Ecohydrology 10 (2), e1790. .
Reich, P.B., Sendall, K.M., Stefanski, A., Rich, R.L., Hobbie, S.E., Montgomery, R.A., 2018. Effects of climate warming on photosynthesis in boreal tree species depend on soil moisture. Nature 562 (7726), 263–267. .
Rodell, M., Houser, P.R., Jambor, U.E.A., Gottschalck, J., Mitchell, K., Meng, C.J., Arsenault, K., Cosgrove, B., Radakovich, J., Bosilovich, M., Entin, J.K., 2004. The global land data assimilation system. Bull. Am. Meteorol. Soc. 85 (3), 381–394. .
Roden, J.S., Lin, G., Ehleringer, J.R., 2000. A mechanistic model for interpretation of hydrogen and oxygen isotope ratios in tree-ring cellulose. Geochem. Cosmochim. Acta 64 (1), 21–35. .
Roden, J.S., Farquhar, G.D., 2012. A controlled test of the dual-isotope approach for the interpretation of stable carbon and oxygen isotope ratio variation in tree rings. Tree Physiol. 32 (4), 490–503. .
Roden, J., Siegwolf, R., 2012. Is the dual-isotope conceptual model fully operational? Tree Physiol. 32 (10), 1179–1182. .
Scheidegger, Y., Saurer, M., Bahn, M., Siegwolf, R., 2000. Linking stable oxygen and carbon isotopes with stomatal conductance and photosynthetic capacity: a conceptual model. Oecologia 125, 350–357. .
Siegwolf, R.T., Lehmann, M.M., Goldsmith, G.R., Churakova, O.V., Mirande-Ney, C., Timoveeva, G., Weigt, R.B., Saurer, M., 2023. Updating the dual C and O isotope—gas-exchange model: a concept to understand plant responses to the environment and its implications for tree rings. Plant Cell Environ. 46 (9), 2606–2627. .
Shi, J., Wang, H., Li, J., Shi, S., Xu, J., Zhang, Y., Lu, H., 2023. Unprecedented early summer warming recorded in tree rings on the central eastern Tibetan Plateau over the past three centuries. Clim. Dyn. 61, 5735–5745. .
Silva, L.C., Anand, M., 2013. Probing for the influence of atmospheric CO2 and climate change on forest ecosystems across biomes. Global Ecol. Biogeogr. 22 (1), 83–92. .
van Bodegom, P.M., Douma, J.C., Witte, J.P.M., Ordoñez, J.C., Bartholomeus, R.P., Aerts, R., 2012. Going beyond limitations of plant functional types when predicting global ecosystem–atmosphere fluxes: exploring the merits of traits-based approaches. Global Ecol. Biogeogr. 21 (6), 625–636. .
van der Sleen, P., Groenendijk, P., Vlam, M., Anten, N.P., Boom, A., Bongers, F., Pons, T.L., Terburg, G., Zuidema, P.A., 2015. No growth stimulation of tropical trees by 150 years of CO2 fertilization but water-use efficiency increased. Nat. Geosci. 8 (1), 24–28. .
Wang, W., McDowell, N.G., Liu, X., Xu, G., Wu, G., Zeng, X., Wang, G., 2021. Contrasting growth responses of Qilian juniper (Sabina przewalskii) and Qinghai spruce (Picea crassifolia) to CO2 fertilization despite common water-use efficiency increases at the northeastern Qinghai-Tibetan Plateau. Tree Physiol. 41 (6), 992–1003. .
Wright, I.J., Reich, P.B., Cornelissen, J.H., Falster, D.S., Groom, P.K., Hikosaka, K., Lee, W., Lusk, C.H., Niinemets, Ü., Oleksyn, J., Osada, N., 2005. Modulation of leaf economic traits and trait relationships by climate. Global Ecol. Biogeogr. 14 (5), 411–421. .
Yu, W., Tian, L., Yao, T., Xu, B., Wei, F., Ma, Y., Zhu, H., Luo, L., Qu, D., 2017. Precipitation stable isotope records from the northern Hengduan Mountains in China capture signals of the winter India–Burma Trough and the Indian Summer Monsoon. Earth Planet Sci. Lett. 477, 123–133. .
Zhang, J., Li, X., Ren, P., Leavitt, S.W., Rossi, S., Liang, E., 2022. Terminal bud size, spring and summer temperatures regulate the timing of height-growth cessation of Smith fir on the southeastern Tibetan Plateau. Agric. For. Meteorol. 316, 108883. .
Zhang, X., Liu, X., Zhang, Q., Zeng, X., Xu, G., Wu, G., Wang, W., 2018. Species-specific tree growth and intrinsic water-use efficiency of Dahurian larch (Larix gmelinii) and Mongolian pine (Pinus sylvestris var. mongolica) growing in a boreal permafrost region of the Greater Hinggan Mountains, Northeastern China. Agric. For. Meteorol. 248, 145–155. .
Zhu, H.F., Shao, X.M., Yin, Z.Y., Huang, L., 2011. Early summer temperature reconstruction in the eastern Tibetan Plateau since AD 1440 using tree-ring width of Sabina tibetica. Theor. Appl. Climatol. 106, 45–53. .

 DownLoad:


 Email Alerts
 RSS Feeds