Nick Schafstall, Laura Dobor, Marco Baldo, Andrew M. Liebhold, Werner Rammer, Juha Honkaniemi, Tomáš Hlásny. Assessing the effect of invasive organisms on forests under information uncertainty: The case of pine wood nematode in continental Europe[J]. Forest Ecosystems, 2024, 11(1): 100226. DOI: 10.1016/j.fecs.2024.100226
Citation:
Nick Schafstall, Laura Dobor, Marco Baldo, Andrew M. Liebhold, Werner Rammer, Juha Honkaniemi, Tomáš Hlásny. Assessing the effect of invasive organisms on forests under information uncertainty: The case of pine wood nematode in continental Europe[J]. Forest Ecosystems, 2024, 11(1): 100226. DOI: 10.1016/j.fecs.2024.100226
Nick Schafstall, Laura Dobor, Marco Baldo, Andrew M. Liebhold, Werner Rammer, Juha Honkaniemi, Tomáš Hlásny. Assessing the effect of invasive organisms on forests under information uncertainty: The case of pine wood nematode in continental Europe[J]. Forest Ecosystems, 2024, 11(1): 100226. DOI: 10.1016/j.fecs.2024.100226
Citation:
Nick Schafstall, Laura Dobor, Marco Baldo, Andrew M. Liebhold, Werner Rammer, Juha Honkaniemi, Tomáš Hlásny. Assessing the effect of invasive organisms on forests under information uncertainty: The case of pine wood nematode in continental Europe[J]. Forest Ecosystems, 2024, 11(1): 100226. DOI: 10.1016/j.fecs.2024.100226
Forests worldwide are experiencing increasingly intense biotic disturbances; however, assessing impacts of these disturbances is challenging due to the diverse range of organisms involved and the complex interactions among them. This particularly applies to invasive species, which can greatly alter ecological processes in their invaded territories. Here we focus on the pine wood nematode (PWN, Bursaphelenchus xylophilus), an invasive pathogen that has caused extensive mortality of pines in East Asia and more recently has invaded southern Europe. It is expected to expand its range into continental Europe with heavy impacts possible.
Given the unknown dynamics of PWN in continental Europe, we reviewed laboratory and field experiments conducted in Asia and southern Europe to parameterize the main components of PWN biology and host-pathogen interactions in the Biotic Disturbance Engine (BITE), a model designed to implement a variety of forest biotic agents, from fungi to large herbivores. To simulate dynamically changing host availability and conditions, BITE was coupled with the forest landscape model iLand. The potential impacts of introducing PWN were assessed in a Central European forest landscape (40,928 ha), likely within PWN’s reach in future decades.
A parameter sensitivity analysis indicated a substantial influence of factors related to dispersal, colonization, and vegetation impact, whereas parameters related to population growth manifested a minor effect. Selection of different assumptions about biological processes resulted in differential timing and size of the main mortality wave, eliminating 40%–95% of pine trees within 100 years post-introduction, with a maximum annual carbon loss between 1.3% and 4.2%. PWN-induced tree mortality reduced the Gross Primary Productivity, increased heterotrophic respiration, and generated a distinct legacy sink effect in the recovery period. This assessment has corroborated the ecological plausibility of the simulated dynamics and highlighted the need for new strategies to navigate the substantial uncertainty in the agent’s biology and population dynamics.
Over recent decades, forest disturbance regimes have undergone significant changes, including increases in the severity of wildfires, droughts, and insect outbreaks (Patacca et al., 2022; Hlásny et al., 2021; Seidl et al., 2017). Biotic disturbances are often the most intensively increasing types of disturbance because of concurrent acceleration of insects and diseases development, range expansion, and reduction in tree defences due to climatic stress (Forzieri et al., 2021; Patacca et al., 2022). At the same time, expanding international trade has facilitated the invasions of numerous insects and pathogens to new regions and this trend continues to increase (Liebhold et al., 2017; Ramsfield et al., 2016). Invasions of insects and diseases can considerably contribute to alterations of disturbance regimes, potentially generating novel dynamics departing from the ranges of historical variation (Lovett et al., 2006; Turner and Seidl, 2023). Invasion impacts include alteration of tree species composition, changes in forest succession, declines in biodiversity, and alteration of element cycles in ecosystems (Peltzer et al., 2010; Liebhold et al., 2017). For example, carbon loss due to the impact of the 15 most damaging nonnative forest pests across the conterminous United States is estimated to be as much as 5.53 Tg C per year (Fei et al., 2019). In Europe, invasive pests pose a significant threat to ca 10% of the total forest living carbon (Seidl et al., 2018). Most of this impact is predicted to result from invasions of the pine wood nematode (Bursaphelenchus xylophilus) and Asian long-horned beetle (Anoplophora glabripennis).
Although the evidence for escalating invasion impacts on the forests is alarming, our understanding of the underlying mechanisms and their effect on ecosystem functions and the provision of ecosystem services remains limited (Boyd et al., 2013). Process-based ecosystem models are increasingly employed to investigate novel vegetation dynamics, offering insights unattainable through empirical research alone (Blanco and Lo, 2023). Despite the growing complexity of these models, they seldom incorporate a mechanistic representation of disturbance processes, or they address only a limited number of key disturbance agents. Windthrows, wildfires and insect outbreaks are most frequently implemented, with iLand (Seidl et al., 2012, 2014), FireBGCv2 (Keane et al., 2011), ForGEM-W (Schelhaas et al., 2007), and LandClim (Schumacher et al., 2004) serving as examples. The representation of biotic agents is heavily skewed towards prominent species, such as Ips typographus in Europe (e.g., Seidl and Rammer, 2017) and Dendroctonus ponderosae in North America (Powell and Bentz, 2014), leading to the misrepresentation of actual biotic risk. Rare approaches that have facilitated the study of multiple interacting biotic agents are a Biological Disturbance Agent extension implemented in LANDIS II (Sturtevant et al., 2004) that included representation of several native and invasive organisms (Mina et al., 2022); and the Biotic Disturbance Engine – BITE (Honkaniemi et al., 2021), which offered a modular platform for simulating the dynamics and impacts of various biotic agents, and for integrating these processes with vegetation models. A key strength of such implementations is a bi-directional interface between biotic agents and climatically sensitive vegetation dynamics. The inclusion of management operations, which is a common capability of vegetation models (Rammer and Seidl, 2015; Dobor et al., 2019), adds a wider socio-ecological dimension, reflecting priorities of forest owners and ecosystem management policies. Nevertheless, bridging the gap between biology and population dynamics of organisms, and the abstract representation of these processes in simulation models, remains a significant challenge. It is particularly pronounced in the case of invasive organisms, where empirical data are often severely limited.
Here, we used the BITE platform to develop a process-based implementation of an important invasive pathogen in Europe, the pine wood nematode (PWN), the causal agent of pine wilt disease (PWD; Kobayashi et al., 1984). The pathogen represents a severe threat to European pine forests, which constitute ca 20% of Europe’s forest area (Houston Durrant et al., 2016). The PWN originates from North America and has successfully established in several regions of East Asia since the early 1900s, causing significant economic and environmental damages (Mamiya, 1988; Zhao, 2008). The pathogen was introduced to Portugal in 1999 (Rodrigues, 2008) and became a major quarantine species in Europe, subject to several EU regulations (e.g., Commission of the European Communities, 2009, 2015). While further expansion is currently being constrained by low summer temperatures (Rutherford and Webster, 1987), model projections indicate that climate change may facilitate the pathogen’s expansion into continental Europe (Hirata et al., 2017). However, its potential impacts on forest structure, demography, carbon, endemic disturbance regimes, and ecosystem resilience remain unclear.
The objectives of this study are (ⅰ) to gather and critically evaluate available information on the biology and population dynamics of the PWN to parameterize the individual processes of the BITE framework; (ⅱ) to carry out a sensitivity analysis to investigate the influence of individual parameters on the spread of the pathogen and the associated tree mortality; and (ⅲ) to use the developed implementation in a Central European forest landscape, likely within PWN’s reach in future decades, to assess possible impacts of PWN introduction on forest living carbon and main carbon fluxes, and evaluate the ecological plausibility of the simulated dynamics.
2.
Material and methods
2.1
Modeling framework
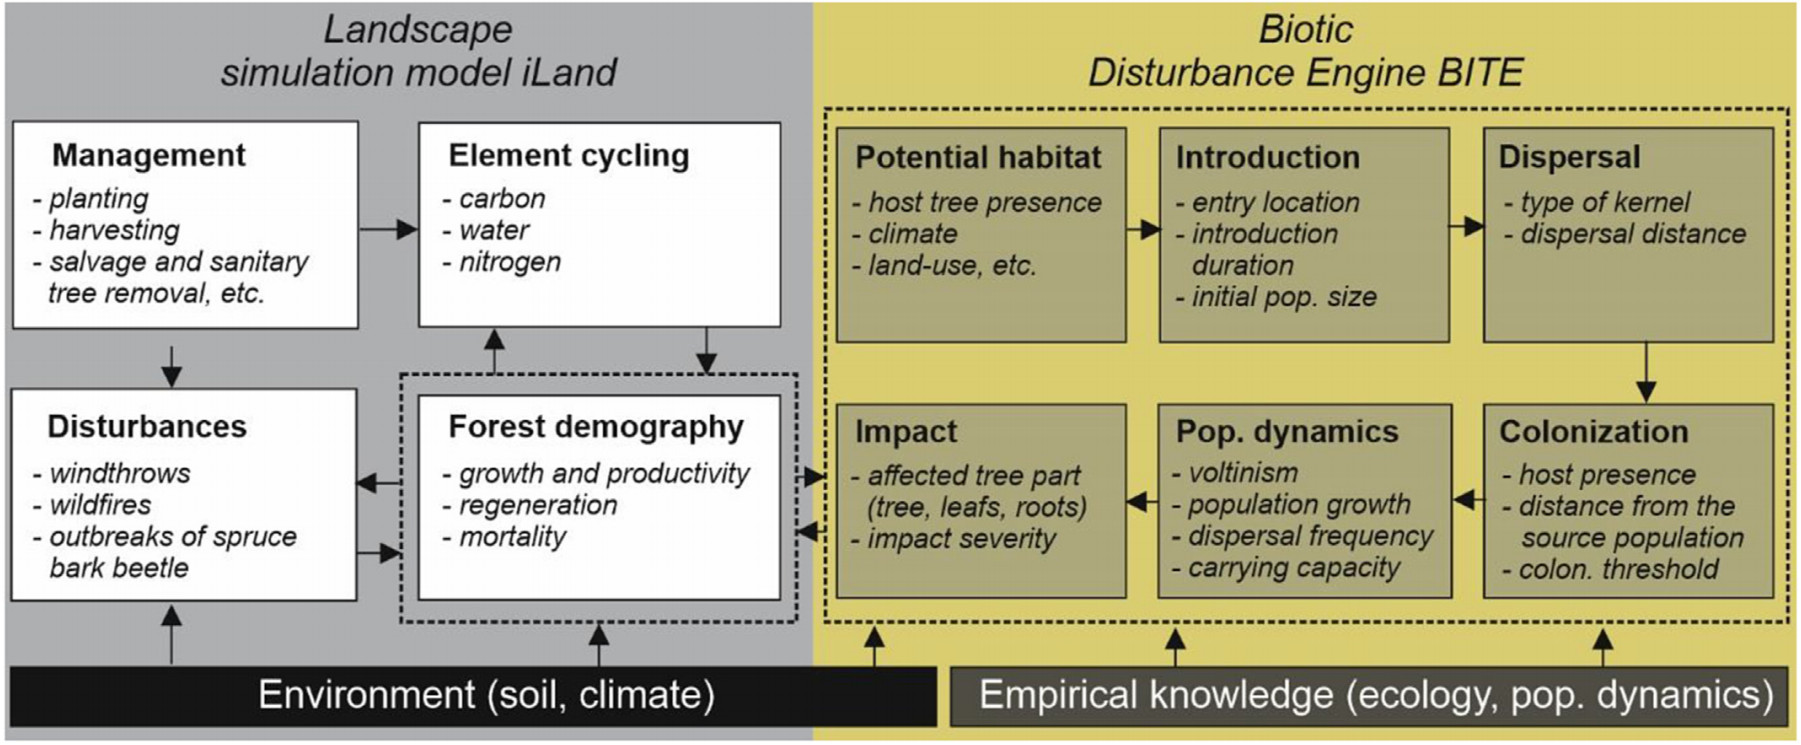
We applied the Biotic Disturbance Engine (BITE) (Honkaniemi et al., 2021) to parameterize individual processes of the PWN dynamics and evaluate the emergent colonization and mortality patterns. BITE consists of several modular blocks (Fig. 1) that simulate the distribution and impact of a biotic agent across a pre-defined grid. These include the characterization of the agent’s potential habitat, introduction type (single or multiple entry points, introduction duration, etc.), dispersal across the landscape, constraints to vegetation colonization, agent’s population dynamics, and the type of impact on the vegetation. Depending on the complexity of this knowledge, different assemblages of these modules can be employed. Each module contains several parameters that can be defined based on field and laboratory experiments with different levels of intricacy.
Figure
1.
Main components of and interface between the forest landscape model iLand and the Biotic Disturbance Engine (BITE).
BITE was designed to be coupled with any dynamic vegetation model that handles gridded data on host biomass that is available for the agent to consume. Here, we used iLand, a process-based forest model that simulates forest demographic processes at the level of trees on the scale of landscapes (Seidl et al., 2012; https://iland-model.org/). iLand simulates forest regeneration, growth, and mortality in a spatially explicit process-oriented manner. Tree productivity is modelled using a light-use efficiency approach, driven by environmental conditions and species traits (Landsberg and Waring, 1997). Assimilated carbon is allocated to trees and their compartments (stem, roots, branches, foliage) based on allometric equations. BITE can simulate tree mortality or the loss of certain tree components, such as foliage, which in turn can increase stress-related tree mortality. The interface between iLand and BITE thus enables the interaction between host availability and conditions provided by iLand, with the impacts on vegetation resulting from the activities of BITE agents. This framework is further extended through iLand’s ability to simulate the effect of different management operations that can alter host availability, including the sanitary removal of infected trees to prevent the agent’s spread (Rammer and Seidl, 2015). The agents introduced through BITE can interact with windthrows, outbreaks of bark beetle, and wildfires simulated by iLand (Seidl et al., 2012) (Fig. 1).
2.2
Pine wood nematode ecology
Bursaphelenchus xylophilus, native to North America, is the only species of wood nematode in the genus Bursaphelenchus known to cause mortality of host trees in the genus Pinus. The nematodes live in the xylem vessels of living trees and when populations reach high densities, they cause vessel blockage ultimately leading to tree mortality in the same or the following year. Nematodes of this species disperse to new host trees via transport by longhorn beetle vectors of the genus Monochamus. The nematodes enter the tracheae of the beetles in the pupal stage and are transported when the next beetle generation spreads to healthy pine trees during maturation feeding on pine needles (Linit, 1990). During the feeding, which damages the bark of tree branches, nematodes move out of their beetle vectors and enter the trees. Because Monochamus beetles depend on dead and dying pine trees for their own reproduction (adults oviposit on pine stems and larvae feed in pine cambium) (Akbulut and Stamps, 2011), the relationship between nematodes and beetle is mutualistic, potentially resulting in strong positive feedback and resultant widespread pine mortality. Evans et al. (1996) concluded that all conifer species appear to be susceptible to PWD but only pines succumb to the disease under natural conditions. Given the high suitability of Scots pine, Pinus sylvestris, as a host for PWN (Naves et al., 2006a) and the widespread occurrence of the longhorn beetle M. galloprovincialis across Europe (except for Ireland), the risks to European forests are considerable.
2.3
Literature review and parameter estimation
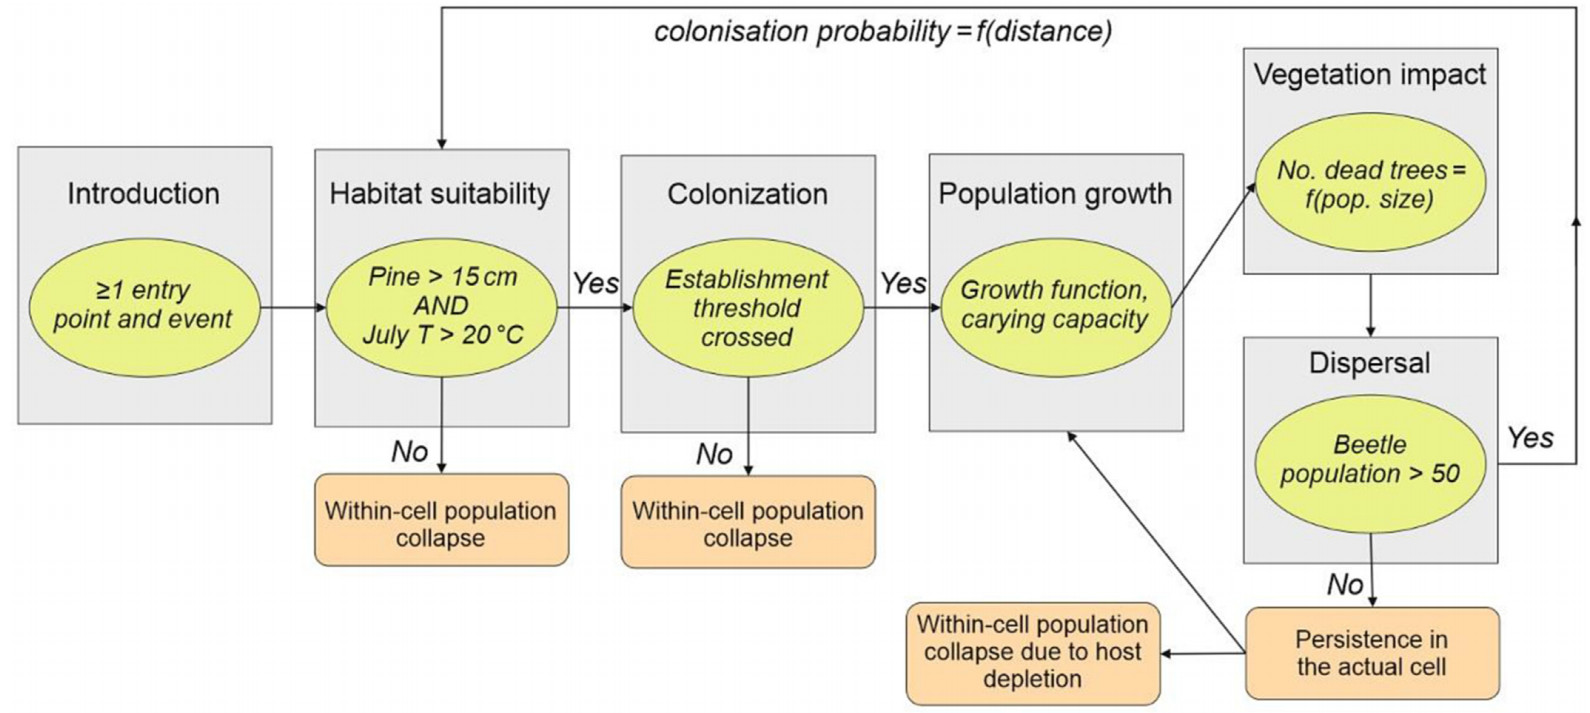
To derive the parameters of processes involved in the simulation of PWN dynamics, we reviewed a body of literature from Asia and Europe, encompassing field and laboratory experiments, and validated modelling studies. The population dynamics of vector beetles and nematodes were not explicitly simulated but instead they were represented in a combined model organism termed an “infected beetle”. Hence, processes related to dispersal and population growth were derived from the vector beetle’s ecology and population dynamics, whereas processes such as the agent’s impact on vegetation were defined based on the nematode’s biology and host-pathogen interactions. The developed implementation is summarized in Table 1 and Fig. 2.
Information from literature and assumptions adopted
Model representation
Lifecycle
A single generation of beetles per year across the entire geographic range where PWN-induced tree mortality can occur. One dispersal wave per season, peaking in June [1, 2]
A univoltine organism
Habitat requirements
All Pinus spp. can die from PWD [3] Pinus sylvestris was preferred in laboratory experiments [4, 5] The beetle only procreates in trees with stem diameter ≥15 cm [5, 6]
Only cells with Pinus sylvestris trees ≥15 cm can be colonized
Tree mortality can only occur under the average July temperature >20 ℃ [7]
July temperature >20 ℃ a
Introduction
Assumption-based. A single introduction point, a single introduction event, and the number of introduced beetles 2–400.
Number of beetles in the introduction point, Ninit = 2–400
Dispersal
Negative exponential kernel or 2Dt kernel [8, 9]. A simplified kernel representation in BITE allowed for using the Gaussian kernel instead of 2Dt.
Gaussian kernel
Mean natural dispersal distance: 205.8–816.44 m [8] Mean dispersal distance with human aid: 1,500 m [9, 10]
Assumption-based. Delay of the dispersal unless 50 beetles in a cell are reached.
Dispersal only when M ≥ 50
Colonization
Assumption-based degree of natural environmental resistance to colonization. Because higher values exerted a strong dampening effect on PWN dynamics, a hypothetical range of 0–1 was narrowed to 0.05–0.2 that showed a better correspondence with the expansion speed observed in Portugal [9].
Probabilistic colonization filter represented by a random value in the range 0.05–0.2.
Initial number of beetles (Minit) after colonization calculated as a product of colonization probability (pkernel) and Minit ranging from 2 to 400. Assumption-based as empirical evidence is lacking.
M = pkernel × Minit; Minit = 2–400
Population growth
One infected beetle produces 7–11 new beetles [9, 10]
2–20 beetles needed to induce tree mortality [11,12,13,14,15]. We narrowed this range to 2–8 beetles, assuming high initial mortality in newly colonized areas.
Impact = M/Mkill M, total amount of infected beetles in a cell; Mkill, the number of beetles required to kill a tree: 2–8
a Not used in the impact demonstration in the current study because the investigated landscape is not yet within the PWN climatic niche.
Figure
2.
A simplified diagram of processes involved in the simulation of pine wood nematode dynamics using the Biotic Disturbance Engine, processes interaction, and parameter values identified based on the literary review.
The life cycle of M. galloprovincialis differs depending on the regional climate; in colder climates the beetle produces one generation per two years (Tomminen, 1993), while it was found to produce one generation per year in other regions in Europe (e.g., Francardi and Pennacchio, 1996; Sláma, 1998). There is a consensus that the adult beetles disperse between May and September, with a distinct peak in June (e.g., Naves et al., 2006b). On this basis, we implemented PWN as a univoltine organism (Table 1).
2.3.2
Habitat suitability
Concerning the host tree definition, all pine species (Pinus spp.) were found susceptible to PWD (Evans et al., 1996). Laboratory experiments demonstrated a successful PWN inoculation to the prevalent European species, P. sylvestris (Naves et al., 2006a). A major difference between the European vector beetle M. galloprovincialis and other Monochamus species is that M. galloprovincialis lay their eggs in branches rather than in trunks of trees. Therefore, the beetle prefers higher dimension trees, with a stem diameter larger than 15 cm (Tomminen, 1993; P. Naves, personal communication). On this basis, P. sylvestris with a stem diameter >15 cm was defined as the PWN host. Concerning climatic suitability of PWN habitat, tree mortality due to the PWN infection was found to require an average daily July temperature above 20 ℃ (e.g., Gruffud et al., 2018).
2.3.3
Dispersal
The dispersal of the vector beetle M. galloprovincialis can be described with a negative exponential kernel or a negative 2Dt kernel (Extebeste et al., 2015). Based on mark-recapture experiments of the latter authors, the beetle’s median dispersal distance ranged between 205.8 and 816.44 m, while the maximum distance was 5.0 km. These values are slightly lower than the maximum annual dispersal of 6 and 7.5 km reported for the Asian M. alternatus (Takasu et al., 2000; Robinet et al., 2019). Field observations in Portugal, used in a simulation study by De la Fuente et al. (2018), showed that over the course of eight observation years the disease (i.e., actual tree mortality, not the beetles) progressed at an average rate of 5.3 km ⋅year−1, with the maximum progression of 8.3 km ⋅year−1. Based on this, the latter authors suggested that the negative 2Dt dispersal kernel with median and maximum dispersal distance of 1,500 m and 8.3 km, respectively, aligned with observed disease spread. The value of 1,500 m for the median distance corresponds to the findings of Pukkala et al. (2014), who also considered human-mediated dispersal. Here, we only considered the natural dispersal of the PWN, therefore, the dispersal was implemented based on the 2Dt kernel with a median dispersal distance varying between 200 and 800 m, and a maximum distance of 8,000 m (Table 2). Since the maximum dispersal distance is defined as a separate parameter in BITE (a kernel cap) and x is always 0, we used a Gaussian kernel instead (Koch et al., 2020):
p(x)=\mathrm{e}^{-\frac{x^2}{2 \mathtt{π} d^2}}
(1)
Table
2.
Parameter ranges used for the sensitivity analysis in an artificial forest landscape. The values in bold indicate the reference parameters which were held constant, while varying the values of another parameter. Parameters are the median radius of the dispersal function, establishment threshold, initial number of beetles in a colonized cell, population growth rate, and vegetation impact represented by the number of infected beetles required to kill a tree. The maximum dispersal distance was held constant at 8,000 m.
where p is the probability of colonization expressed as a function of distance, d is median dispersal distance ranging from 200 to 800 m.
The dispersal implementation was modified by introducing a threshold requiring a minimum of 50 infected beetles in a cell before permitting dispersal to other cells within the landscape. This threshold introduces a certain dampening effect on spread, accounting for situations where the low levels of host biomass in a cell limit that cell from acting as a source of spread. However, this value was set arbitrarily and requires further support from experimental studies.
2.3.4
Population growth
The growth rate of the infected beetle populations was set between 7 and 11, meaning that one infected beetle produces 7 to 11 infected beetles per year; this is based on experimental studies from Asia (Yoshimura et al., 1999; Togashi, 1985; Robinet et al., 2009) and a modelling study from Spain (Pukkala et al., 2014). These values also align with the field observations from Portugal (de la Fuente et al., 2018). We assumed that population growth of infected beetles after a successful colonization is governed by a logistic growth function:
where M is the total number of infected beetles in the cell and K is the carrying capacity of host trees in a cell (K = number of trees/consumption). Consumption is defined as the number of infected beetles, M, required to kill a tree by transmitting the PWD. The growth rate r is defined as the number of newly infected beetles that are generated from the previous generation of beetles that laid their eggs in the killed tree. The variable t is set to 1, representing a single developmental cycle per year.
2.3.5
Establishment
The existence of Allee dynamics is known to limit small population sizes in the studied system (Yoshimura et al., 1999; Takasu, 2009). Therefore, besides environmental requirements for colonization, such as climate and suitable host trees, we introduced a probabilistic threshold that represented the natural resistance of the environment due to factors such as predation and host tree resistance. It is represented by a random value generated from the prescribed range 0–n, with n ≤ 1, that must exceed the establishment threshold to allow for successful colonization. However, there is no empirical evidence about this effect’s strength. Our simulation experiment indicated that higher threshold values exerted a strong dampening effect on PWN dynamics, making the simulated progression lagging behind the observed progression of 5.3 km per year (de la Fuente et al., 2018). Therefore, we considered this effect’s strength with n ≤ 0.2 only, which better aligned the simulated dynamics with the observed progression.
2.3.6
Vegetation impact
To determine the PWD lethality (referred to as the vegetation impact in the BITE framework), we considered the minimum number of nematodes required to kill a healthy tree, and the number of nematodes found in infected beetles in various studies. The Asian studies by Togashi (1985) and Yoshimura et al. (1999) indicated that 1,000 to 10,000 nematodes are needed to kill a tree. Firminho et al. (2017) found that infected M. galloprovincialis in Portugal can carry up to 10,000 nematodes but this conclusion was based on four individuals caught in flight traps during the dispersal peak at the end of June. During the whole experiment, 40% of the 22 captured beetles contained 1,000 or more nematodes. Naves et al. (2007) found that the number of nematodes collected from pine branches (15,373–36,722) infected by 28 beetles that were previously caught in the field in Portugal, which amounts to 550–1,300 nematodes per infected beetle on average. With the estimated number of required nematodes reported by Togashi (1985) and Yoshimura et al. (1999) ranging from 1,000 to 10,000, we assume a possible range of 2–20 infected beetles to induce the lethality to the host tree. However, considering the 85% tree mortality reported by Naves et al. (2018) in Portugal, and assuming no initial tree resistance in newly colonized regions in Europe, we narrowed this range to 2–8 beetles (Table 1). Nevertheless, this parameter requires further empirical support.
2.4
Experimental design
2.4.1
Parameter sensitivity analysis
A sensitivity analysis was conducted to examine the effect of different parameter values on the number of years required to (ⅰ) colonize the 95% of cells on a model landscape and (ⅱ) kill 95% of all trees. A single value from the plausible range of each parameter was used as a reference that was held constant, while the values of a given parameter varied within the prescribed range (Table 2), exerting the change in the two response variables. Because of the assumed interaction of dispersal radius with the establishment threshold, we conducted an additional two-parameter sensitivity analysis covering these two factors.
Testing was conducted in a hypothetical gridded landscape with an area of 2,500 ha (5 km × 5 km), consisting of 1 ha grid cells. The landscape was populated with Scots pine trees with diameters ranging through an interval of 14.14–17.3 cm, resulting in 82.5% of trees above the minimum diameter threshold for colonization of 15 cm. The number of trees per ha was set to 1,795, which was set based on the Czech national forest yield tables (Černý and Pařez, 1996), resulting in a total of 1,120,000 trees. Management, background tree mortality, and regeneration were disabled during the simulation to isolate the effect of PWN on the tree pool. At the start of the simulation, 50 infected beetles were localized in a single cell in the center of the landscape, and the PWN dynamics was simulated for 100 years.
2.4.2
Impact on a real forest landscape
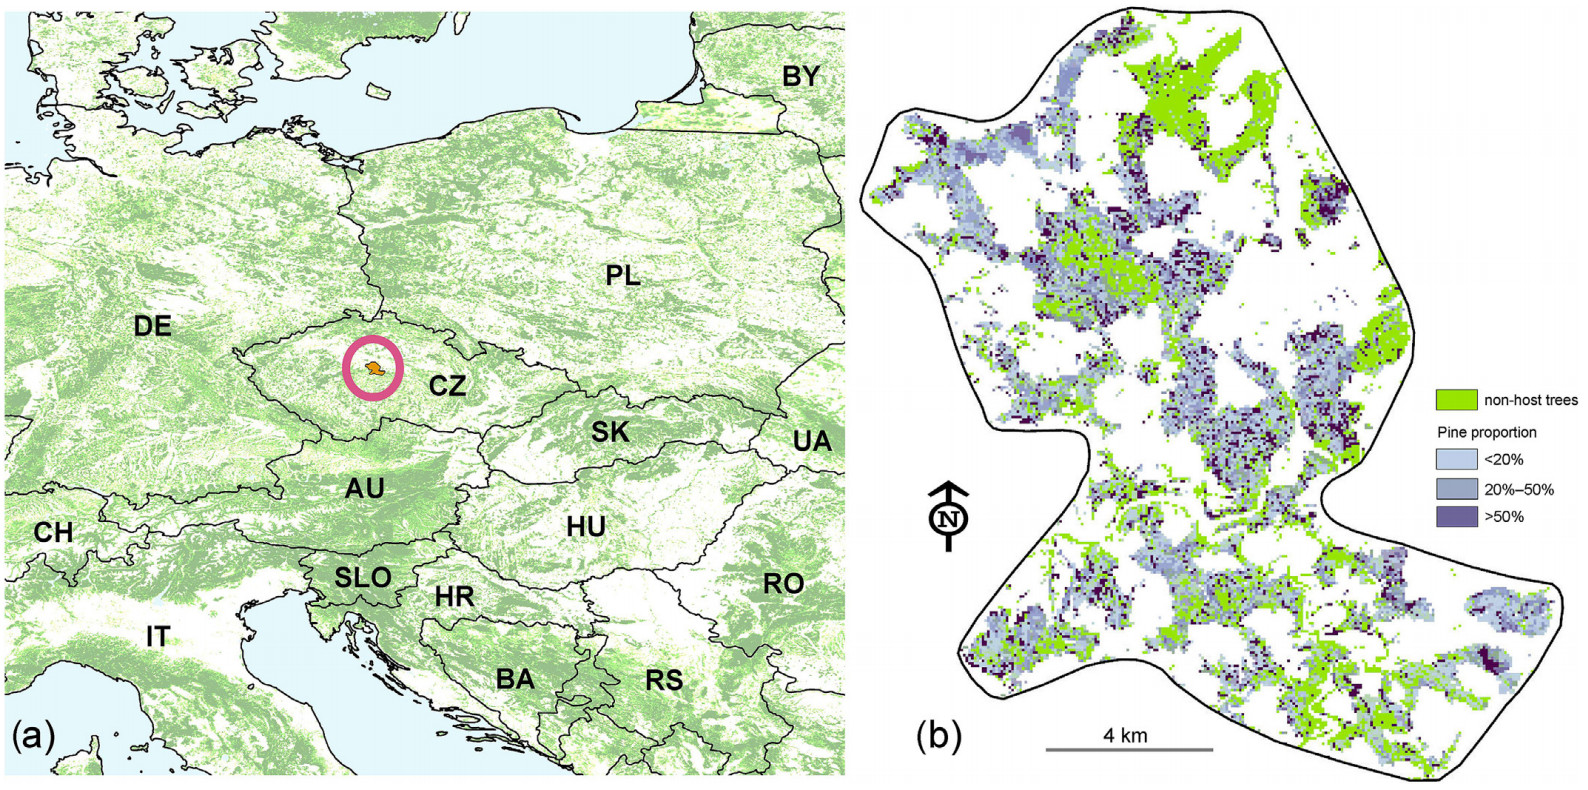
The study area (center coordinates: 49°95′ N, 14°78′ E; Fig. 3) is located in the Czech Republic, Central Europe that could potentially fall within PWN’s range over the next decades. Currently, summer temperatures in Central Europe are too low to support PWN populations (Rutherford and Webster, 1987), but projected future climate in the region is expected to be suitable for the pathogen’s establishment (Hirata et al., 2017). The size of the area is 40,928 ha with 45% forest cover (18,500 ha). Except for the PWN host, Scots pine (Pinus sylvestris, 10.7%), the current species composition consists of Picea abies (57.7%), Fagus sylvatica (7.6%), and oak species Quercus robur and Q. petraea (8.8%) (see Dobor et al., 2024 for more details).
Figure
3.
Position of the experimental forest landscape in Europe (a) and the distribution of stands with a certain proportion of Scots pine (b).
For facilitating the forest development simulations, soil depth, texture, and nitrogen content were defined on a spatial grid with a resolution of 100 m × 100 m (Source: Forest Management Institute of Czech Republic). The daily climatic data originated from the meteorological station located in the landscape, representing the period 1961–1990 (Source: Czech Hydrometeorological Institute). The station measurements were downscaled to the 100 m × 100 m environmental grid using the MT-CLIM software (Hungerford et al., 1989). The climate time series spanning the simulation period of 100 years was created by randomly sampling years with replacement from the 1961–1990 period to define stable growing conditions across the simulation period. This period contains only a negligible warming trend, and it is broadly used to define reference conditions in climate change impact studies. However, as the temperature during this period fell below the threshold for PWN-induced tree mortality (Table 1), the parameter defining the PWN climatic niche was not activated in the current experiment, making the entire study landscape climatically suitable.
Tree species, stand age, and basal area data required to initialize the vegetation in the model on a 10 m × 10 m grid were extracted from the regional Forest Management Plans, which described forest conditions in the period 2010–2014. More details about vegetation initialization in iLand can be found in Dobor et al. (2018, 2019, 2024). Management was implemented through the iLand’s Agent-Based Management Engine (Rammer and Seidl, 2015) in a way that approximates the current management practices in the study region. Sequences of planting, thinning, and harvesting operations were defined, which were dynamically adopted to actual conditions in forests stands across the landscape. No disturbance agent, except for the PWN, was introduced through iLand’s disturbance modules (Fig. 1).
Drawing from the sensitivity analysis, we selected three combinations of plausible parameter values that resulted in contrasting levels of impact in terms of the number of years required to kill 95% of all trees. Impact assessment has focused on the speed of colonization and mortality, represented by the time required to colonize all cell with the presence of pine and the amount of pine trees killed within 100 years of the simulation. The onset and duration of the main mortality wave were evaluated too. Because forest carbon cycle is a sensitive receptor of disturbance impacts, we evaluated the impact of PWN introduction on the total forest living carbon, the living carbon in pine trees, gross primary productivity (GPP), and heterotrophic respiration (Rh). Unlike the sensitivity analysis conducted with the hypothetical landscape, these simulations incorporated management and enabled natural mortality and regeneration, thereby representing a realistic forest development scenario.
3.
Results
3.1
Sensitivity analysis
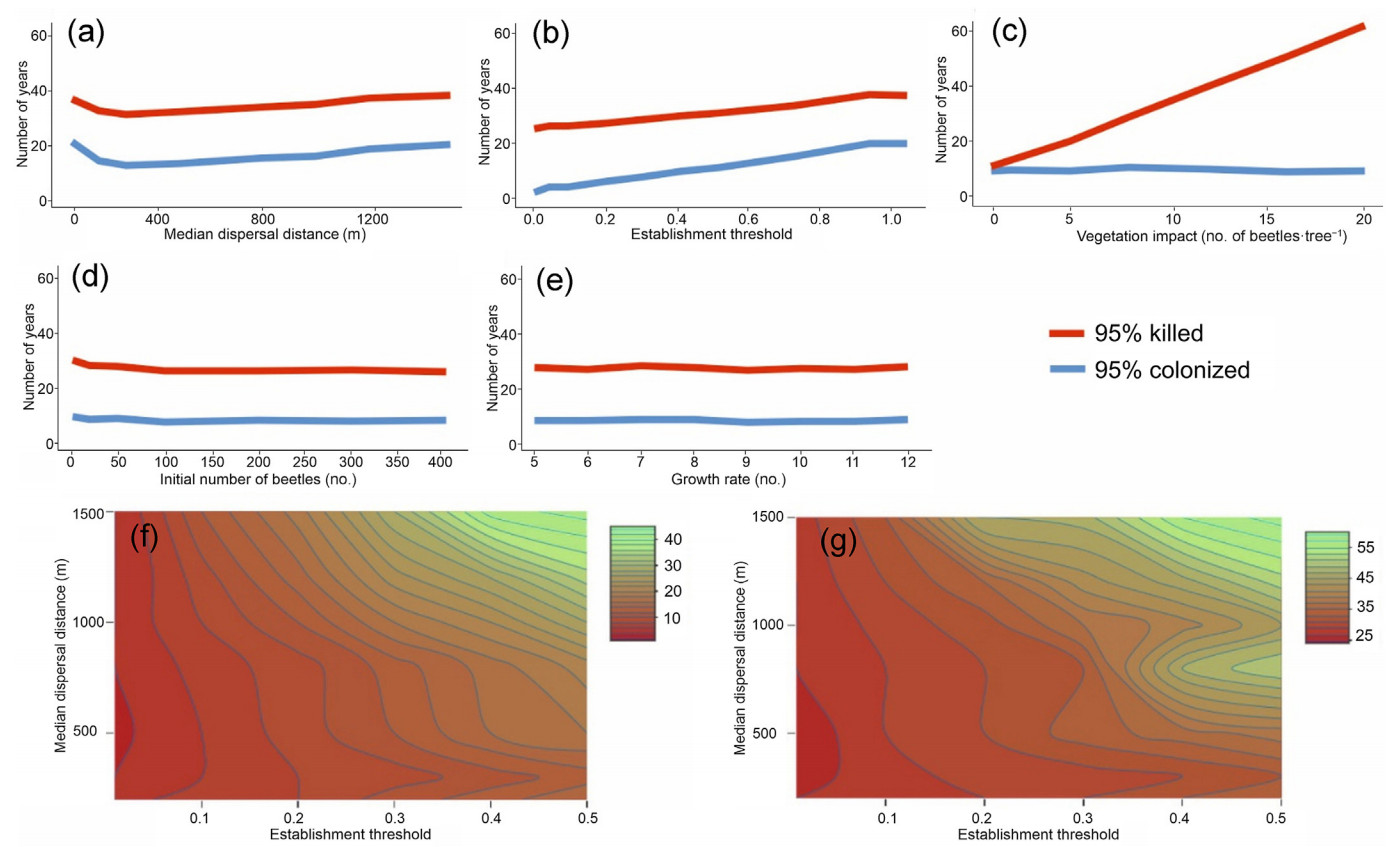
Both the initial number of beetles in a cell after the colonization (Fig. 4d) and the population growth rate (Fig. 4e) exerted a relatively minor influence on colonization progression and tree mortality. Specifically, irrespective of the value of these two parameters, the colonization of the 95% grid cells and the mortality of 95% of the trees were achieved within 12–13 years and 30–34 years, respectively, provided that all remaining parameters were held on their reference values (Table 2).
Figure
4.
Sensitivity analysis indicating the response of the number of years required to colonize 95% of grid cells and reach a 95% tree mortality to different parameter values. (a) Median dispersal distance; (b) establishment threshold; (c) vegetation impact; (d) initial number of beetles in a cell; e) population growth rate; (f–g) a two-fold analysis of mean dispersal distance and establishment threshold effect on cell colonization (f) and tree mortality (g).
The increase in median dispersal distance and in the establishment threshold had a dampening effect on mortality and colonization (Fig. 4a and b). It is noteworthy that the response to dispersal distance was non-linear, with the maximum impact (i.e., the smallest number of years to 95% colonization) produced at the distance of ca 200 m. This is due to the trade-off between the distance reached by dispersing beetles and the colonization probability assigned to individual cells; the longer the dispersal distance, the lower the probability assigned to individual cells.
The two-parameter sensitivity analysis of these two variables (Fig. 4f and g) indicated that the fastest colonization and mortality rates corresponded to a median dispersal radius between 300 and 700 m and an establishment threshold below 0.1. With the establishment threshold above 0.3, it took more than 10 years to colonize 95% of the landscape and more than 30 years to kill 95% of trees.
Finally, vegetation impact (representing the number of beetles required to cause tree death) was the most influential parameter, causing 95% mortality within 14–66 years, depending on its value. As this variable is not associated with any process affecting the colonization rate, this response was flat (Fig. 4c).
3.2
Impact assessment
We evaluated the PWN impact under three parameter scenarios, referred to as High, Medium, and Low Impact (HI, MI, LI), delivering contrasting tree mortality levels (Table 3). Drawing from the sensitivity analysis, we considered three parameters in scenario definition: median dispersal distance, vegetation impact, and the establishment threshold. Concerning the latter parameter, only the values >0.2 (i.e., >20% probability of by-chance colonization failure) were considered (Table 1), which generated mortality progression of around 1 km per year, better aligning with the field observations.
Table
3.
Three parameter settings generating contrasting mortality dynamics used for assessing the impact of pine wood nematode introduction. *maximum/median distance.
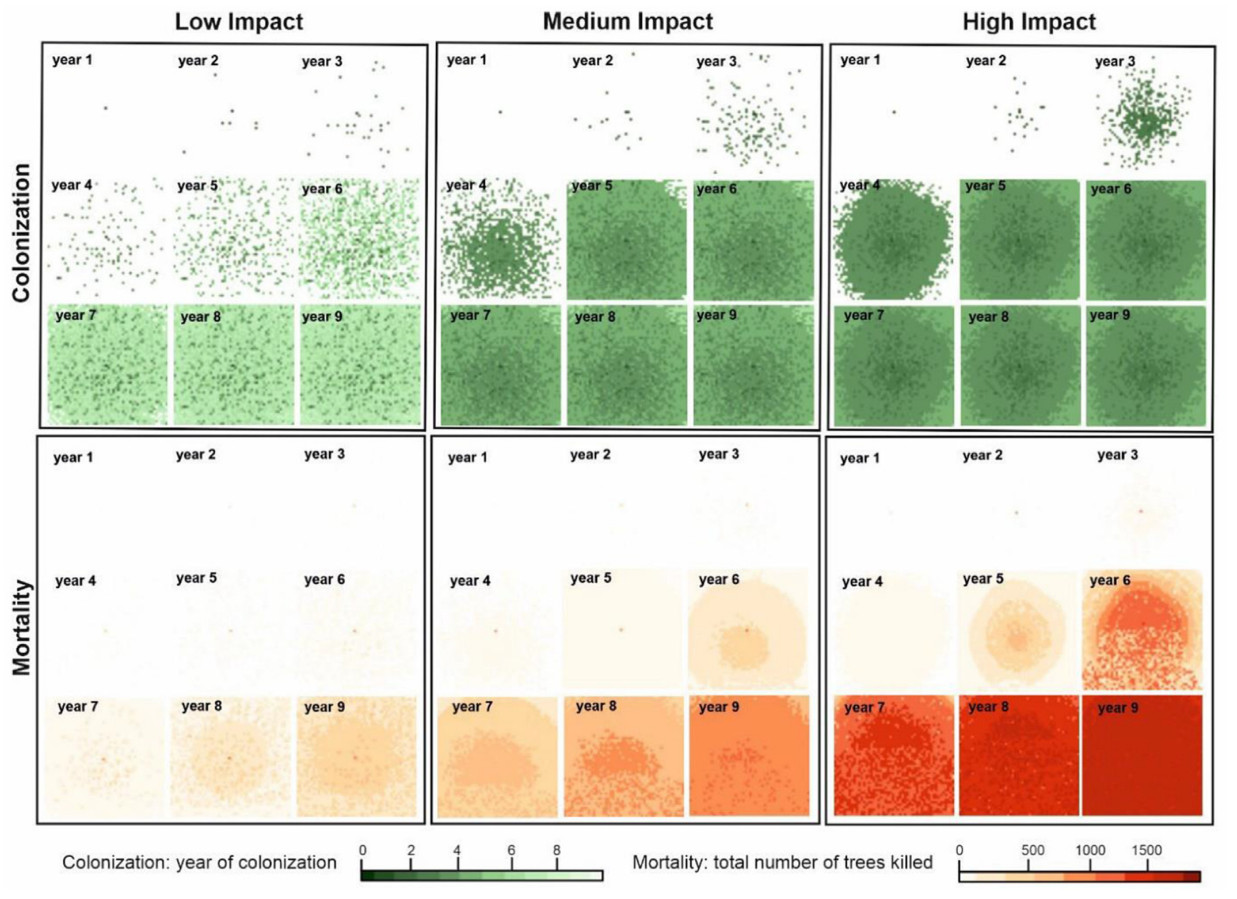
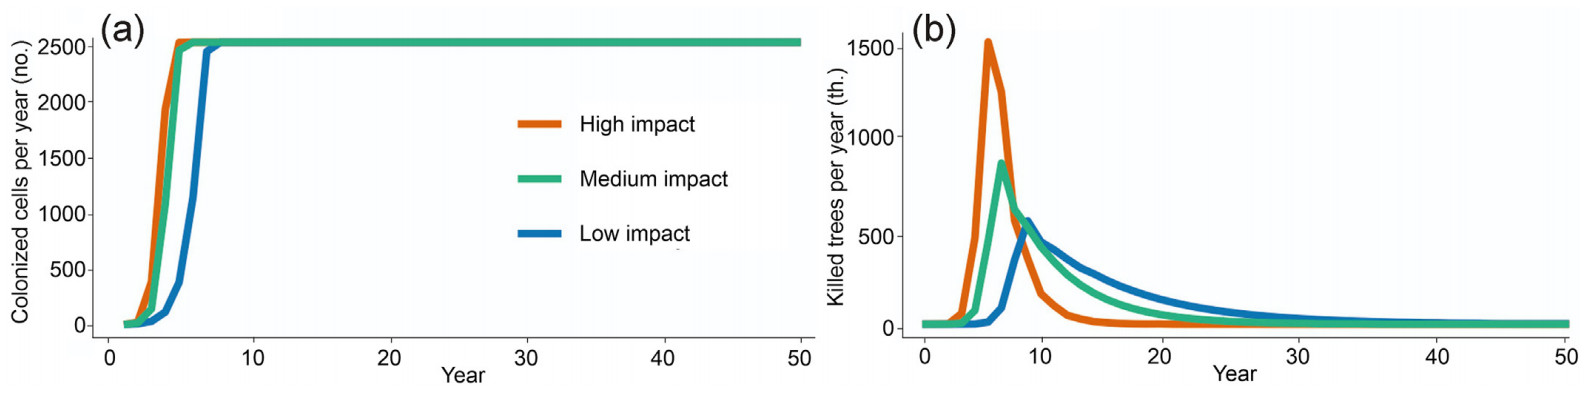
Simulations exhibited a distinct concentric spatial pattern that was more pronounced in tree mortality than in colonization dynamics (Fig. 5). The temporal trajectory of colonization (Fig. 6a) adhered to a sigmoidal pattern, reaching a plateau at 2,500 grid cells (equal to the size of the artificial landscape) under all scenarios. The number of years required to colonize the entire landscape varied from 6 to 11 years under HI and LI scenarios, respectively. The mortality progression (Fig. 6b) displayed a distinct peak under all three scenarios, with a varying onset of culmination and peak duration. Under the HI scenario, the mortality culminated 6 years post-introduction, while it culminated after 12 years with the LI scenario. The number of years required to kill all trees on the landscape was 56, 36 and 20, under the LI, MI, and HI scenarios, respectively. We note that this experiment did not enable tree regeneration; hence, the mortality patterns are limited to the initial cohort of trees.
Figure
5.
Pine wood nematode expansion across the artificial pine-dominated landscape large 5 km × 5 km under three settings of driving parameters specified in Table 2. The colors depict the onset of colonization (i.e., the number of years from the introduction) or tree mortality caused by the pathogen during nine years post-introduction. The introduction point is located in the center of the landscape. (For interpretation of the references to color in this figure legend, the reader is referred to the Web version of this article.)
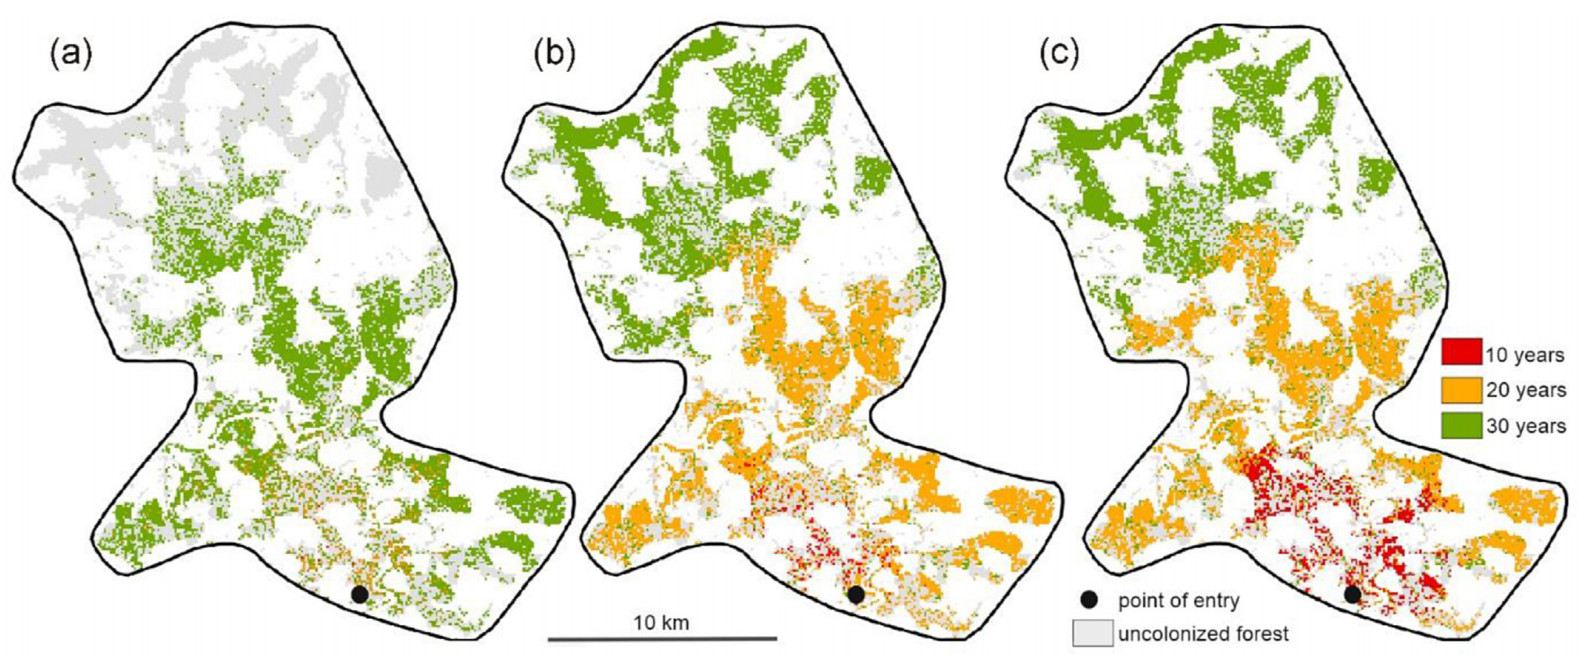
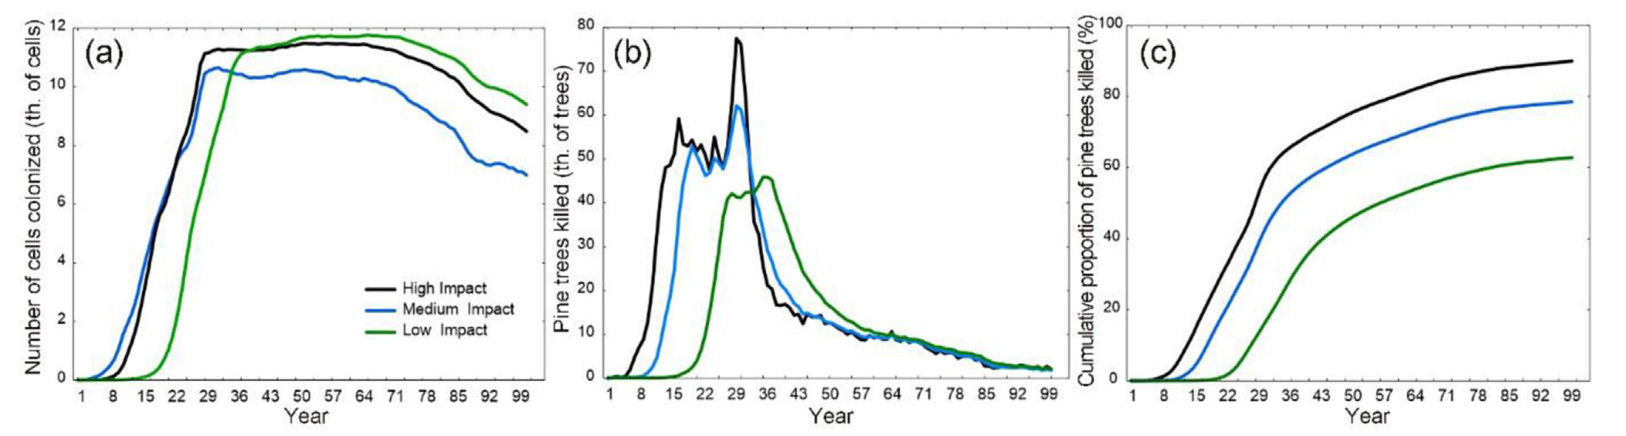
The cells with pines that were furthest from the point of first introduction (Fig. 7) were colonized after 28, 28, and 35 years, respectively, corresponding to an expansion rate of 0.9–1.1 km per year. Under the HI and MI scenario, most of the cells that contained pines were colonized within 30 years (Fig. 8a), while it took 37 years under the LI scenario. The progression of pine mortality (Fig. 8b) exhibited a distinct peak under all parameter settings, with the onset from the introduction year ranging between 16 (HI), 19 (MI), and 27 years (LI). A sharp increase between 29 (HI, MI) and 35 years (LI) indicates that the last major clusters of host trees were reached. Over the 100-year simulation period, the three tested parameter settings resulted in the mortality of 90.0%, 78.5%, and 62.8% of all mature pine trees on the landscape, respectively (Fig. 8c).
Figure
7.
Simulated progression of forest colonization by pine wood nematode in the Central European forest landscape during three time periods post-introduction under three scenarios representing different assumptions about underlying biological processes: (a) Low Impact; (b) Medium Impact; (c) High Impact (Table 2).
Figure
8.
(a) Simulated temporal progression of pine wood nematode in a Central European forest landscape in terms of the number of colonized grid cells. (b) Annual mortality of pine trees due to the introduction of pine wood nematode. (c) Cumulative proportion of the numbers of pine trees killed. High, Medium, and Low Impact scenarios represent three plausible settings of driving parameters generating contrasting mortality dynamics (Table 2).
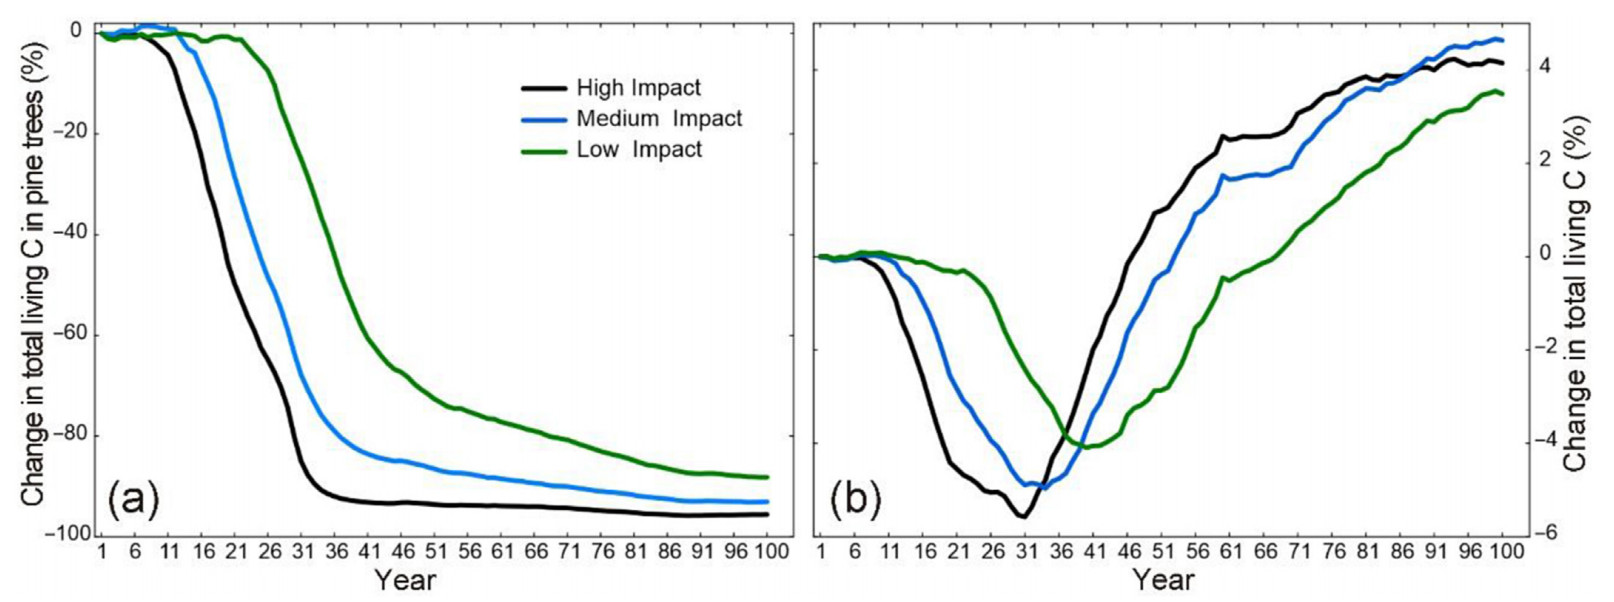
The three tested parameter settings delivered different impacts on the carbon stock in pine stands, which was nearly exhausted within 25–50 years post-introduction (Fig. 9a). By the end of the simulation period, the carbon loss in pine trees was between 88% (LI) and 96% (HI). In terms of the total living carbon in the landscape (i.e., all tree species considered) (Fig. 9b), the maximum annual loss under the three parameter settings was 5.6%, 4.9%, and 4.1%, respectively. The largest relative impact on the living carbon stock occurred 30-, 33-, and 39-years post-introduction. A robust carbon recovery was observed under all three impact scenarios due to the compensation for the loss of pines by non-host species, notably Picea abies and Fagus sylvatica.
Figure
9.
The effect of simulated pine wood nematode introduction on the amount of living forest carbon in pine stands (a), and the total forest living carbon (b). Relative differences of cases with and without introduction are shown.
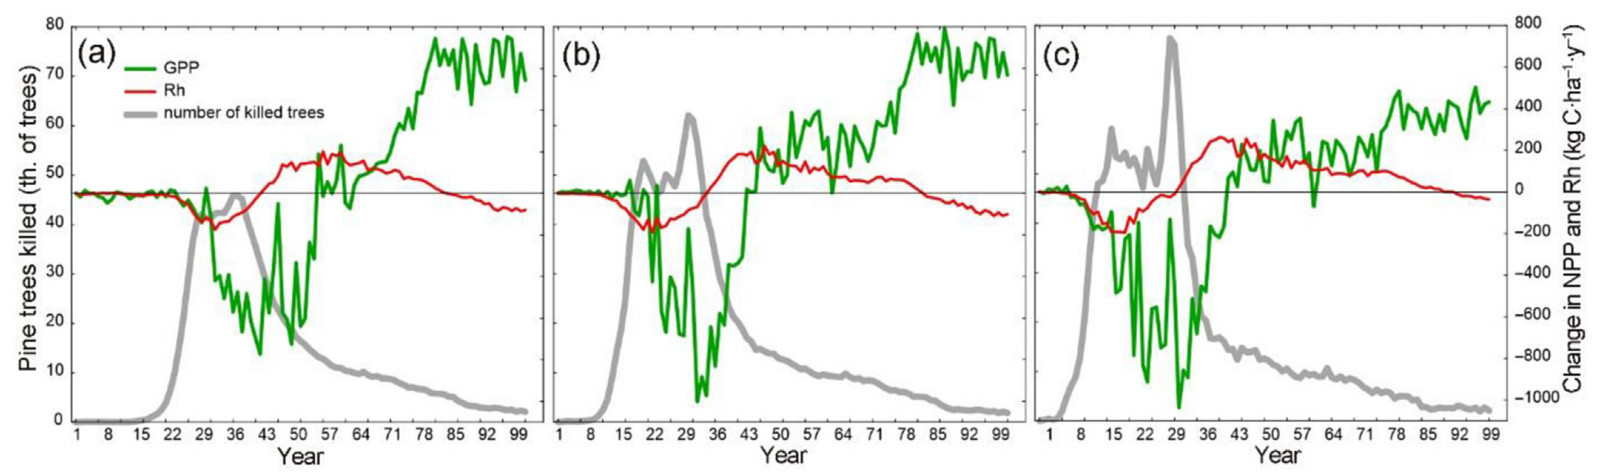
PWN introduction caused a drop in GPP that was aligned with the main mortality wave (Fig. 10), reaching as much as 1,000 kg C·ha−1·year−1 (ca 6%) under the HI scenario. In the post-mortality period, GPP exceeded its reference level (i.e., without PWN introduction) by up to 800 kg C·ha−1·year−1 (ca 4%); this effect was more distinct under LI and MI than under the HI scenario. Rh increased after the PWN introduction due to the increased accumulation of the decomposing debris. This increase was followed by an extended period with the reduced Rh in the post-outbreak period, likely resulting from the legacy changes in forest structure and composition. We note that Rh is a negative flux, therefore, its increase presented in Fig. 10 is represented by higher negative values.
Figure
10.
The effect of simulated introduction of pine wood nematode on Gross Primary Productivity (GPP) and heterotrophic respiration (Rh) (right axis) along with the tree mortality development (left axis). Values for GPP and Rh represent differences between the flux size with and without the introduction.
The rapid increase in biological invasions, the amplification of native biotic agents’ activity, and the emergence of novel disturbance regimes (Turner and Seidl, 2023) underscore the need for innovative tools to appraise future ecosystem dynamics. Species distribution models have historically provided insights into large-scale shifts in insect and disease distributions (Bebber, 2015; Lehman et al., 2020), while statistical models, correlating the occurrence of agents with their impacts, have been widely used in forest risk rating (Seidl et al., 2011). However, the correlative nature of these approaches and limited options for assessing impacts on forest carbon, demography, and a suite of ecosystem services have restricted their utility. The high sensitivity of biotic disturbance regimes to climate change has necessitated a shift towards application of process-oriented approaches. Being based on the first principles of ecology (Gustafson, 2013), these tools possess a better capacity to provide plausible information even under non-analogous conditions. Unlike correlative approaches, process-based models demand an in-depth understanding of the agent’s ecology and population dynamics (Cuddington et al., 2013). This information is typically available for a limited number of commercially significant species, whereas data are severely limited for species previously considered harmless but have escalated their virulence due to climate change. For invasive species establishing in new territories, this information is virtually non-existent. In the current study, we explored the potential dynamics of the PWN in Central Europe, a region without any historical exposure to this pathogen but identified as having a high risk of future invasion (Robinet et al., 2011; Hirata et al., 2017). We collated the fragmented knowledge of PWN dynamics with several phenomenological assumptions and integrated them in the modular platform of BITE (Honkaniemi et al., 2021). Such a solution can serve as a blueprint to improving biotic risk representation in ecosystem models under the conditions of high information uncertainty.
4.1
Implementation challenges
The most critical uncertainty in the current implementation arises from the unknown lethality of the PWN in Europe and limited options for adopting this information from the existing literature. For example, while pine mortality was negligible within the native range of PWN due to the resistance of the North American pines (Akbulut and Stamps, 2011), it has caused a vast forest devastation in Asia (Yoshimura et al., 1999). However, transferring knowledge about PWN impacts from Asia is problematic because it concerns different species of the vector beetle (M. alternatus) and different host species (e.g., P.thunbergia, P.densiflora). Despite nearly 25 years of experience with PWN in Portugal (Naves et al., 2018), the existing information about the impact of PWD is inadequate for parameterizing model processes. There, all PWD occurrences have been treated with heavy sanitary logging, removing forest stands around the infected area to create sanitary buffers (Calvão et al., 2019). These interventions compromise information about the PWN’s lethality, which, as we have demonstrated in the sensitivity analysis, is an essential parameter driving the mortality dynamics (Fig. 4c). Therefore, this part of the PWN parameterization will require support from experiments established across Europe, as PWN continues to expand its range. Future simulation experiments should also consider the possible existence of PWD resistance in a minor proportion of trees as has been identified in Japan (Futai, 2008). The inclusion of this parameter could play a significant role in modelling long-term ecosystem development, encompassing post-disturbance regeneration dynamics. However, such knowledge is presently lacking in Europe.
The PWN modelling is complicated by the involvement of two organisms – the pathogen and its carrying vector, the longhorn beetle. We opted to employ a simplified approach by conceptualizing a single entity referred to as an “infected beetle”. This required estimation of the “standard” quantity of nematodes within a beetle and the pathogen load necessary to cause tree mortality. Such conceptualization was necessary due to the limited understanding of processes governing the individual dynamics of the two organisms and their interaction (e.g., pathogen’s spread within the beetle’s population). A more complex and biologically explicit model could, for example, facilitate model simulations supporting forest risk management (e.g., Dobor et al., 2020), with different management operations targeting different components of the ecological system. Therefore, it may warrant consideration in future studies.
We have demonstrated how the actual information uncertainty impedes both the parameterization of processes and the evaluation of simulated patterns of mortality and colonization against observations. Hence, the current results should be regarded as a methodological advancement in developing a process-oriented PWN implementation, rather than an impact-oriented experiment. The parameterization presented herein can serve as an initial parsimonious approximation, which can be iteratively refined and validated as new empirical knowledge becomes available.
4.2
Mortality dynamics and impact on forest carbon
The simulated impact of PWN introduction on forest carbon in the real forest landscape was not severe, primarily due to the low proportion of host trees (10.7%). Depending on parameter settings used, most of the landscape was colonized within 29–35 years. However, the simulated progression of mortality fell behind observed rates reported in literature. In Portugal, the progression was approximately five times faster than in our experiment (5.3 km per year, on average; de la Fuente et al., 2018), while in Japan, host trees were eradicated within 10–20 years across large areas (Togashi and Shigesada, 2009, and references therein). This discrepancy can be partly attributed to the scattered distribution of host trees in the study landscape that may have retarded the expansion; however, it may also indicate a need to revise certain parameters.
The simulated effect on carbon pools and fluxes agreed with theoretical expectations and empirical evidence on carbon cycles under tree mortality events (Chapin et al., 2006; Goulden et al., 2010). Overall, forest living carbon was found to be resilient to the simulated PWN impact and carbon loss was fully compensated by the ingrowth of other tree species. Such compensatory dynamics following the impact of invasive species was documented by Fei et al. (2019) in the conterminous United States. The decrease in GPP aligned with the main mortality wave and accounted for the reduced leaf area and carbon uptake (e.g. Chapin et al., 2006). The increase in GPP after the main mortality pulse represented the so-called carbon legacy sink that has been documented in several empirical and model-based studies (Dobor et al., 2018; Yue et al., 2016). It mainly accounted for the shift of forest demography towards younger trees with a higher carbon uptake. Increased nutrient input from decomposing residues is another factor that can amplify the sink strength (Fernández-Martínez et al., 2014). However, this effect was not accounted for in our experiment as the modelling framework applied here does not include dynamic nitrogen cycle (Seidl et al., 2012). Tree mortality caused by PWN increased the rate of heterotrophic respiration during the main mortality episode, which accounted for the decomposition of the increased amount of detritus and dead logs (Lindroth et al., 2009). At the same time, the respiration decreased in forest recovery period. The reasons of this effect are less obvious and likely account for the legacy effect of the change in species composition and demography.
4.3
Future research priorities
Considering the significant role of dispersal-related parameters in modelling PWN dynamics, factors such as landscape host connectivity and the overall proportion of the host can be crucial in determining the final impact. In the current study, we conducted our simulations in a single landscape with a homogeneous host distribution and a single actual landscape with a fragmented host distribution. However, appraising the effect of different host configurations on PWN expansions could be an important contribution to understanding the susceptibility of European landscapes to invasions.
The sanitary removal of infested trees and establishment of sanitary buffers around infestation foci are widely used for pathogen control in Europe (Dobor et al., 2019). However, the efficiency of these strategies remains unknown; there are indications that even mass-scale sanitary actions have not prevented the PWN from expanding in Portugal (Firminho et al., 2017). Complex landscape-scale simulation models, such as the BITE – iLand framework, could potentially be used to model different sanitary operations and thus be instrumental in delivering this knowledge. This has been done, for example, to understand the effects of salvage logging on the dynamics of spruce bark beetle Ips typographus in Central Europe (Dobor et al., 2019, 2020; Augustynczik et al., 2021).
Finally, organisms such as the PWN can alter the historical disturbance regimes in temperate Europe, leading to unforeseen impacts on timber production, forest carbon, and demography (Seidl et al., 2018). The trajectories of post-disturbance recovery can be shifted by novel pathogens, extending beyond their historical variation. Hence, the integration of new pathogens into complex vegetation models is crucial for gaining new insights into the modification of existing disturbance regimes and ecosystem resilience – some of the most pressing inquiries in contemporary ecological research (Cumming and Peterson, 2017).
5.
Conclusions
The modular, process-oriented framework of BITE (Honkaniemi et al., 2021) has proven to be efficient in addressing scenarios where biological information about a disturbance agent is limited. Utilizing this platform to develop model representations of other potentially significant native and nonnative species could be instrumental in achieving a more comprehensive representation of forest biotic risks in ecosystem models. The PWN parameterization developed here can serve as a blueprint for incorporating other emerging organisms into ecosystem models, especially under conditions of high information uncertainty. We propose that interdisciplinary collaborative efforts should be initiated to gather driving parameters for different organisms and validate model simulations across different environments.
CRediT authorship contribution statement
Nick Schafstall: Writing – original draft, Visualization, Methodology, Investigation, Formal analysis, Data curation, Conceptualization. Laura Dobor: Visualization, Validation, Supervision, Software, Methodology, Formal analysis. Marco Baldo: Methodology, Data curation. Andrew M. Liebhold: Writing – review & editing, Validation, Methodology, Conceptualization. Werner Rammer: Writing – review & editing. Juha Honkaniemi: Writing – review & editing. Tomáš Hlásny: Writing – review & editing, Writing – original draft, Visualization, Validation, Supervision, Methodology, Conceptualization.
Declaration of competing interest
The authors declare that they have no known competing financial interests or personal relationships that could have appeared to influence the work reported in this paper.
Akbulut, S., Stamps, W.T., 2011. Insect vectors of the pinewood nematode: a review of the biology and ecology of Monochamus species. For. Pathol. 42 (2), 89–99. .
Augustynczik, A.L.D., Dobor, L., Hlásny, T., 2021. Controlling landscape-scale bark beetle dynamics: can we hit the right spot? Landsc. Urban Plan. 209, 104035. .
Bebber, D.P., 2015. Range-expanding pests and pathogens in a warming world. Annu. Rev. Phytopathol. 53, 335–356. .
Blanco, J.A., Lo, Y.-H., 2023. Latest trends in modelling forest ecosystems: new approaches or just new methods? Curr. For. Rep. 9, 219–229. .
Boyd, I.L., Freer-Smith, P.H., Gilligan, C.A., Godfray, H.C., 2013. The consequence of tree pests and diseases for ecosystem services. Science 342, 1235773. .
Calvão, T., Duarte, C.M., Pimentel, C.S., 2019. Climate and landscape patterns of pine forest decline after invasion by the pinewood nematode. For. Ecol. Manag. 433, 43–51. .
Černý, M., Pařez, J., 1996. Růstové a Taxační Tabulky Hlavních Dřevin České Republiky: (Smrk, Borovice, Buk, Dub). IFER, Jílové U Prahy.
Commission of the European Communities, 2009/420/EC (amending Decision 2006/133/EC).
Commission of the European Communities, 2015/226 (amending Implementing Decision 2012/535/EU).
Cuddington, K., Fortin, M.-J., Gerber, L.R., Hastings, A., Liebhold, A., O'Connor, M., Ray, C., 2013. Process-based models are required to manage ecological systems in a changing world. Ecosphere 4 (2), 1–12. .
Cumming, G.S., Peterson, G.D., 2017. Unifying research on social–ecological resilience and collapse. Trends Ecol. Evol. 32 (9), 695–713. .
De la Fuente, B., Saura, S., Beck, P.S.A., 2018. Predicting the spread of an invasive tree pest: the pine wood nematode in Southern Europe. J. Appl. Ecol. 55 (5), 2374–2385. .
Dobor, L., Hlásny, T., Rammer, W., Barka, I., Trombik, J., Pavlenda, P., Šebeň, V., Štěpánek, P., Seidl, R., 2018. Post-disturbance recovery of forest carbon in a temperate forest landscape under climate change. Agric. For. Meteorol. 263, 308–322. .
Dobor, L., Hlásny, T., Rammer, W., Zimová, S., Barka, I., Seidl, R., 2019. Is salvage logging effectively dampening bark beetle outbreaks and preserving forest carbon stocks? J. Appl. Ecol. 57 (1), 67–76. .
Dobor, L., Hlásny, T., Rammer, W., Zimová, S., Barka, I., Seidl, R., 2020. Spatial configuration matters when removing windfelled trees to manage bark beetle disturbances in Central European forest landscapes. J. Environ. Manag. 254, 109792. .
Dobor, L., Baldo, M., Bílek, L., Barka, I., Máliš, F., Štěpánek, P., Hlásny, T., 2024. The interacting effect of climate change and herbivory can trigger large-scale transformations of European temperate forests. Global Change Biol. 30 (2), e17194. .
Evans, H.F., McNamara, D.G., Braasch, H., Chadoeuf, J., Magnusson, C., 1996. Pest risk analysis (PRA) for the territories of the European Union (as PRA area) on Bursaphelenchus xylophilus and its vectors in the genus Monochamus. Bull. OEPP 26, 199–249. .
Extebeste, I., Sanchez-Husillos, E., Álvarez, G., Mas i Gisbert, H., Pajares, J., 2015. Dispersal of Monochamus galloprovincialis (Col.: cerambycidae) as recorded by mark–release–recapture using pheromone traps. J. Appl. Entomol. 140, 485–499. .
Fei, S., Morin, R.S., Oswalt, C.M., Liebhold, A.M., 2019. Biomass losses resulting from insect and disease invasions in US forests. Proc. Natl. Acad. Sci. U.S.A. 116 (35), 17371–17376. .
Fernández-Martínez, M., Vicca, S., Janssens, I.A., Sardans, J., Luyssaert, S., Campioli, M., Chapin III, F.S., Ciais, P., Malhi, Y., Obersteiner, M., Papale, D., Piao, S.L., Reichstein, M., Rodà, F., Peñuelas, J., 2014. Nutrient availability as the key regulator of global forest carbon balance. Nat. Clim. Change 4, 471–476. .
Firminho, P.N., Calvão, T., Ayres, M.P., Pimentel, C.S., 2017. Monochamus galloprovincialis and Bursaphelenchus xylophilus life history in an area severely affected by pine wilt disease: implications for forest management. For. Ecol. Manag. 389, 105–115. .
Forzieri, G., Girardello, M., Ceccherini, G., Spinoni, J., Feyen, L., Hartmann, H., Beck, P.S.A., Camps-Valls, G., Chirici, G., Mauri, A., Cescatti, A., 2021. Emergent vulnerability to climate-driven disturbances in European forests. Nat. Commun. 12, 1081. .
Francardi, V., Pennacchio, F., 1996. Note sulla bioecologia di Monochamus galloprovincialis (Olivier) in Toscana e in Liguria (Coleoptera: Cerambycidae). Redia 79 (2), 153–169.
Futai, K., 2008. In: Zhao, B.G., Futai, K., Sutherland, J.R., Takeuchi, Y. (Eds.), Pine Wilt in Japan: from First Incidence to the Present. Pine Wilt Disease, Springer, Tokyo. .
Goulden, M.L., McMillan, A.M.S., Winston, G.C., Rocha, A.V., Manies, K.L., Harden, J.W., Bond-Lamberty, B.P., 2010. Patterns of NPP, GPP, respiration, and NEP during boreal forest succession. Global Change Biol. 17, 855–871. .
Gruffud, H.R., Schröder, T., Jenkins, T.A.R., Evans, H.F., 2018. Modelling pine wilt disease (PWD) for current and future climate scenarios as part of a pest risk analysis for pine wood nematode Bursaphelenchus xylophilus (Steiner and Buhrer) Nickle in Germany. J. Plant Dis. Prot. 126, 129–144. .
Gustafson, E.J., 2013. When relationships estimated in the past cannot be used to predict the future: using mechanistic models to predict landscape ecological dynamics in a changing world. Landscape Ecol. 28 (8), 1429–1437. .
Hirata, A., Nakamura, K., Nakao, K., Kominami, Y., Tanaka, N., Ohashi, H., Takano, K.T., Takeuchi, W., Matsui, T., 2017. Potential distribution of pine wilt disease under future climate change scenarios. PLoS One 12 (8), 0182837. .
Hlasný, T., König, L., Krokene, P., Lindner, M., Montagné-Huck, C., Müller, J., Qin, H., Raffa, K.F., Schelhaas, M.-J., Svoboda, M., Viiri, H., Seidl, R., 2021. Bark beetle outbreaks in Europe: state of knowledge and ways forward for management. Curr. For. Rep. 7, 138–165. .
Honkaniemi, J., Rammer, W., Seidl, R., 2021. From mycelia to mastodons – a general approach for simulating biotic disturbances in forest ecosystems. Environ. Model. Softw. 138, 104977. .
Houston Durrant, T., de Rigo, D., Caudullo, G., 2016. In: San-Miguel-Ayanz, J., de Rigo, D., Caudullo, G., Houston Durrant, T., Mauri, A. (Eds.), Pinus Sylvestris in Europe: Distribution, Habitat, Usage and Threats, European Atlas of Forest Tree Species. Publ. Off. EU, Luxembourg, p. e016b94.
Hungerford, R.D., Nemani, R.R., Running, S.W., Coughlan, J.C., 1989. MTCLIM: a mountain microclimate simulation model. Res. Pap. INT-RP-414. Ogden, UT, U.S. Department of Agriculture, Forest Service, Intermountain Research Station, p. 52 .
Keane, R.E., Loehman, R.A., Holsinger, L.M., 2011. The FireBGCv2 Landscape Fire and Succession Model: a Research Simulation Platform for Exploring Fire and Vegetation Dynamics. General Technical Report RMRS-GTR-255. U.S. Department of Agriculture, Forest Service, Rocky Mountain Research Station, Fort Collins, p. 137.
Kobayashi, F., Yamane, A., Ikeda, T., 1984. The Japanese pine sawyer beetle as the vector of pine wilt disease. Annu. Rev. Entomol. 29 (1), 115–135. .
Koch, D.C., Lewis, M.A., Lele, S.R., 2020. A unifying theory for two-dimensional spatial redistribution kernels with applications in population spread modelling. J. R. Soc. Interface 17 (170). .
Landsberg, J.J., Waring, R.H., 1997. A generalised model of forest productivity using simplified concepts of radiation-use efficiency, carbon balance and partitioning. For. Ecol. Manag. 95 (3), 209–228. .
Lehmann, P., Ammunét, T., Barton, M., Battisti, A., Eigenbrode, S.D., Jepsen, J.U., Kalinkat, G., Neuvonen, S., Niemelä, P., Terblanche, J.S., Økland, B., 2020. Complex responses of global insect pests to climate warming. Front. Ecol. Environ. 18 (3), 141–150. .
Lindroth, A., Lagergren, F., Grelle, A., Klemedtsson, L., Langvall, O., Weslien, P., Tuulik, J., 2009. Storms can cause Europe-wide reduction in forest carbon sink. Global Change Biol. 15, 346–355. .
Linit, M.J., 1990. Transmission of pinewood nematode through feeding wounds of Monochamus carolinensis (Coleoptera: cerambycidae). J. Nematol. 22 (2), 231–236. PMID: 19287715.
Lovett, G.M., Canham, C.D., Arthur, M.A., Weathers, K.C., Fitzhugh, R.D., 2006. Forest ecosystem responses to exotic pests and pathogens in eastern North America. Bioscience 56 (5), 395–405. .
Mamiya, Y., 1988. History of pine wilt disease in Japan. J. Nematol. 20 (2), 219–226.
Mina, M., Messier, C., Duveneck, M.J., Fortin, M.-J., Aquilué, N., 2022. Managing for the unexpected: building resilient forest landscapes to cope with global change. Global Change Biol. 28 (14), 4323–4341. .
Naves, P.M., Camacho, S., De Sousa, E.M., Quartau, J.A., 2007. Transmission of the pine wood nematode Bursaphelenchus xylophilus through feeding activity of Monochamus galloprovincialis (Col., Cerambycidae). J. Appl. Entomol. 131 (1), 21–25. .
Naves, P.M., De Sousa, E.M., Quartau, J.A., 2006a. Feeding and oviposition preferences of Monochamus galloprovincialis for certain conifers under laboratory conditions. Entomol. Exp. Appl. 120 (2), 99–104. .
Naves, P.M., De Sousa, E.M., Rodrigues, J.M., 2006b. Biology of Monochamus galloprovincialis (Coleoptera, Cerambycidae) in the pine wilt disease affected zone, southern Portugal. Silva Lusit. 16 (2), 133–148.
Naves, P.M., Bonifacio, L., Inacio, M.L., De Sousa, E.M., 2018. Integrated management of pine wilt disease in Troia. Rev. Ciencias Agrar. 41, 11–20. .
Patacca, M., Lindner, M., Lucas-Borja, M.E., Cordonnier, T., Fidej, G., Gardiner, B., Hauf, Y., Jasinevičius, G., Labonne, S., Linkevičius, E., Mahnken, M., Milanovic, S., Nabuurs, G.-J., Nagel, T.A., Nikinmaa, L., Panyatov, M., Bercak, R., Seidl, R., Sever, M.Z.O., Socha, J., Thom, D., Vuletic, D., Zudin, S., Schelhaas, M.-J., 2022. Significant increase in natural disturbance impacts on European forests since 1950. Global Change Biol. 29 (5), 1359–1376. .
Peltzer, D.A., Allen, R.B., Lovett, G.M., Whitehead, D., Wardle, D.A., 2010. Effects of biological invasions on forest carbon sequestration. Global Change Biol. 16 (2), 732–746. .
Powell, A., Bentz, B.J., 2014. Phenology and density-dependent dispersal predict patterns of mountain pine beetle (Dendroctonus ponderosae) impact. Ecol. Model. 273, 73–185. .
Pukkala, T., Möykkynen, T., Robinet, C., 2014. Comparison of the potential spread of pinewood nematode (Bursaphelenchus xylophilus) in Finland and Iberia simulated with a cellular automaton model. For. Pathol. 44, 341–352. .
Rammer, W., Seidl, R., 2015. Coupling human and natural systems: simulating adaptive management agents in dynamically changing forest landscapes. Global Environ. Change 35, 475–485. .
Ramsfield, T.D., Bentz, B.J., Faccoli, M., Jactel, H., Brockerhoff, E.G., 2016. Forest health in a changing world: effects of globalization and climate change on forest insect and pathogen impacts. Forestry 89 (3), 245–252. .
Robinet, C., van Opstal, N., Baker, R., Roques, A., 2011. Applying a spread model to identify the entry points from which the pine wood nematode, the vector of pine wilt disease, would spread most rapidly across Europe. Biol. Invasions 13, 2981–2995. https://doi: .
Robinet, C., David, G., Jactel, H., 2019. Modeling the distances traveled by flying insects based on the combination of flight mill and mark-release-recapture experiments. Ecol. Model. 402, 85–92. .
Rodrigues, J.M., 2008. National Eradication Programme for the Pinewood Nematode. In: Mota, M.M., Vieira, P. (Eds.), Pine Wilt Disease: A Worldwide Threat to Forest Ecosystems. Springer, Dordrecht, pp. 5–14.
Rutherford, T.A., Webster, J.M., 1987. Distribution of pine wilt disease with respect to temperature in North America, Japan and Europe. Can. J. For. Res. 17, 1050–1059. .
Schelhaas, M.J., Kramer, K., Peltola, H., van der Werf, D.C., Wijdeven, S.M.J., 2007. Introducing tree interactions in wind damage simulation. Ecol. Model. 207, 197–209. .
Schumacher, S., Bugmann, H., Mladenoff, D.J., 2004. Improving the formulation of tree growth and succession in a spatially explicit landscape model. Ecol. Model. 180 (1), 175–194. .
Seidl, R., Rammer, W., 2017. Climate change amplifies the interactions between wind and bark beetle disturbances in forest landscapes. Landscape Ecol. 32, 1485–1498. .
Seidl, R., Fernandes, P.M., Fonseca, T.F., Gillet, F., Jönsson, A.M., Merganičová, K., Netherer, S., Arpaci, A., Bontemps, J.-D., Bugmann, H., González-Olabarria, J.R., Lasch, P., Meredieu, C., Moreira, F., Schelhaas, M.-J., Mohren, F., 2011. Modelling natural disturbances in forest ecosystems: a review. Ecol. Model. 222, 903–924. .
Seidl, R., Rammer, W., Scheller, R.M., Spies, T.A., 2012. An individual-based process model to simulate landscape-scale forest ecosystem dynamics. Ecol. Model. 231, 87–100. .
Seidl, R., Rammer, W., Blennow, K., 2014. Simulating wind disturbance impacts on forest landscapes: tree-level heterogeneity matters. Environ. Model. Softw. 51, 1–11. .
Seidl, R., Thom, D., Kautz, M., Martin-Benito, D., Peltoniemi, M., Vacchiano, G., Wild, J., Ascoli, D., Petr, M., Honkaniemi, J., Lexer, M.J., Trotsiuk, V., Mairota, P., Svoboda, M., Fabrika, M., Nagel, T.A., Reyer, C.P.O., 2017. Forest disturbances under climate change. Nat. Clim. Change 7, 395–402. .
Seidl, R., Klonner, G., Rammer, W., Essl, F., Moreno, A., Neumann, M., Dullinger, S., 2018. Invasive alien pests threaten the carbon stored in Europe's forests. Nat. Commun. 9, 1626. .
Sláma, M.E.F., 1998. Tesaříkovití – Cerambycidae České Republiky a Slovenské Republiky/Cerambycidae of the Czech Republic and Slovak Republic. Milan Sláma private printing, Krhanice, pp. 278–279.
Sturtevant, B.R., Gustafson, E.J., Li, W., He, H.S., 2004. Modeling biological disturbances in LANDIS: a module description and demonstration using spruce budworm. Ecol. Model. 180, 153–174. .
Takasu, F., 2009. Individual-based modeling of the spread of pine wilt disease: vector beetle dispersal and the Allee effect. Popul. Ecol. 51, 399–409. .
Takasu, F., Yamamoto, N., Kawasaki, K., Togashi, K., Kishi, Y., Shigesada, N., 2000. Modeling the expansion of an introduced tree disease. Biol. Invasions 2, 141–150. .
Togashi, K., 1985. Transmission curves of Bursaphelenchus xylophilus from its vector, Monochamus alternatus, to pine trees with reference to population performance. Appl. Entomol. Zool. 20, 246–251. .
Togashi, K., Shigesada, N., 2009. Spread of the pinewood nematode vectored by the Japanese pine sawyer: modeling and analytical approaches. Popul. Ecol. 48 (4), 271–283. .
Tomminen, J., 1993. Development of Monochamus galloprovincialis Olivier (Coleoptera, Cerambycidae) in cut trees of young pines (Pinus sylvestris L.) and log bolts in southern Finland. Entomol. Fennica 4 (3), 137–142. .
Turner, M.G., Seidl, R., 2023. Novel disturbance regimes and ecological responses. Annu. Rev. Ecol. Evol. Syst. 54, 63–83. .
Yoshimura, A., Kawasaki, K., Takasu, F., Togashi, K., Futai, K., Shigesada, N., 1999. Modeling the spread of pine wilt disease caused by nematodes with pine sawyers as vector. Ecology 80, 1691–1702. .
Yue, C., Ciais, P., Zhu, D., Wang, T., Peng, S.S., Piao, S.L., 2016. How have past fire disturbances contributed to the current carbon balance of boreal ecosystems? Biogeosciences 13, 675–690. .
Zhao, B., 2008. Pine Wilt Disease in China. In: Zhao, B.G., Futai, K., Sutherland, J.R., Takeuchi, Y. (Eds.), Pine Wilt Disease. Springer, Tokyo, pp. 18–25.
Information from literature and assumptions adopted
Model representation
Lifecycle
A single generation of beetles per year across the entire geographic range where PWN-induced tree mortality can occur. One dispersal wave per season, peaking in June [1, 2]
A univoltine organism
Habitat requirements
All Pinus spp. can die from PWD [3] Pinus sylvestris was preferred in laboratory experiments [4, 5] The beetle only procreates in trees with stem diameter ≥15 cm [5, 6]
Only cells with Pinus sylvestris trees ≥15 cm can be colonized
Tree mortality can only occur under the average July temperature >20 ℃ [7]
July temperature >20 ℃ a
Introduction
Assumption-based. A single introduction point, a single introduction event, and the number of introduced beetles 2–400.
Number of beetles in the introduction point, Ninit = 2–400
Dispersal
Negative exponential kernel or 2Dt kernel [8, 9]. A simplified kernel representation in BITE allowed for using the Gaussian kernel instead of 2Dt.
Gaussian kernel
Mean natural dispersal distance: 205.8–816.44 m [8] Mean dispersal distance with human aid: 1,500 m [9, 10]
Assumption-based. Delay of the dispersal unless 50 beetles in a cell are reached.
Dispersal only when M ≥ 50
Colonization
Assumption-based degree of natural environmental resistance to colonization. Because higher values exerted a strong dampening effect on PWN dynamics, a hypothetical range of 0–1 was narrowed to 0.05–0.2 that showed a better correspondence with the expansion speed observed in Portugal [9].
Probabilistic colonization filter represented by a random value in the range 0.05–0.2.
Initial number of beetles (Minit) after colonization calculated as a product of colonization probability (pkernel) and Minit ranging from 2 to 400. Assumption-based as empirical evidence is lacking.
M = pkernel × Minit; Minit = 2–400
Population growth
One infected beetle produces 7–11 new beetles [9, 10]
2–20 beetles needed to induce tree mortality [11,12,13,14,15]. We narrowed this range to 2–8 beetles, assuming high initial mortality in newly colonized areas.
Impact = M/Mkill M, total amount of infected beetles in a cell; Mkill, the number of beetles required to kill a tree: 2–8
a Not used in the impact demonstration in the current study because the investigated landscape is not yet within the PWN climatic niche.
Table
2.
Parameter ranges used for the sensitivity analysis in an artificial forest landscape. The values in bold indicate the reference parameters which were held constant, while varying the values of another parameter. Parameters are the median radius of the dispersal function, establishment threshold, initial number of beetles in a colonized cell, population growth rate, and vegetation impact represented by the number of infected beetles required to kill a tree. The maximum dispersal distance was held constant at 8,000 m.
Table
3.
Three parameter settings generating contrasting mortality dynamics used for assessing the impact of pine wood nematode introduction. *maximum/median distance.

 DownLoad:


 Email Alerts
 RSS Feeds