Figure
1.
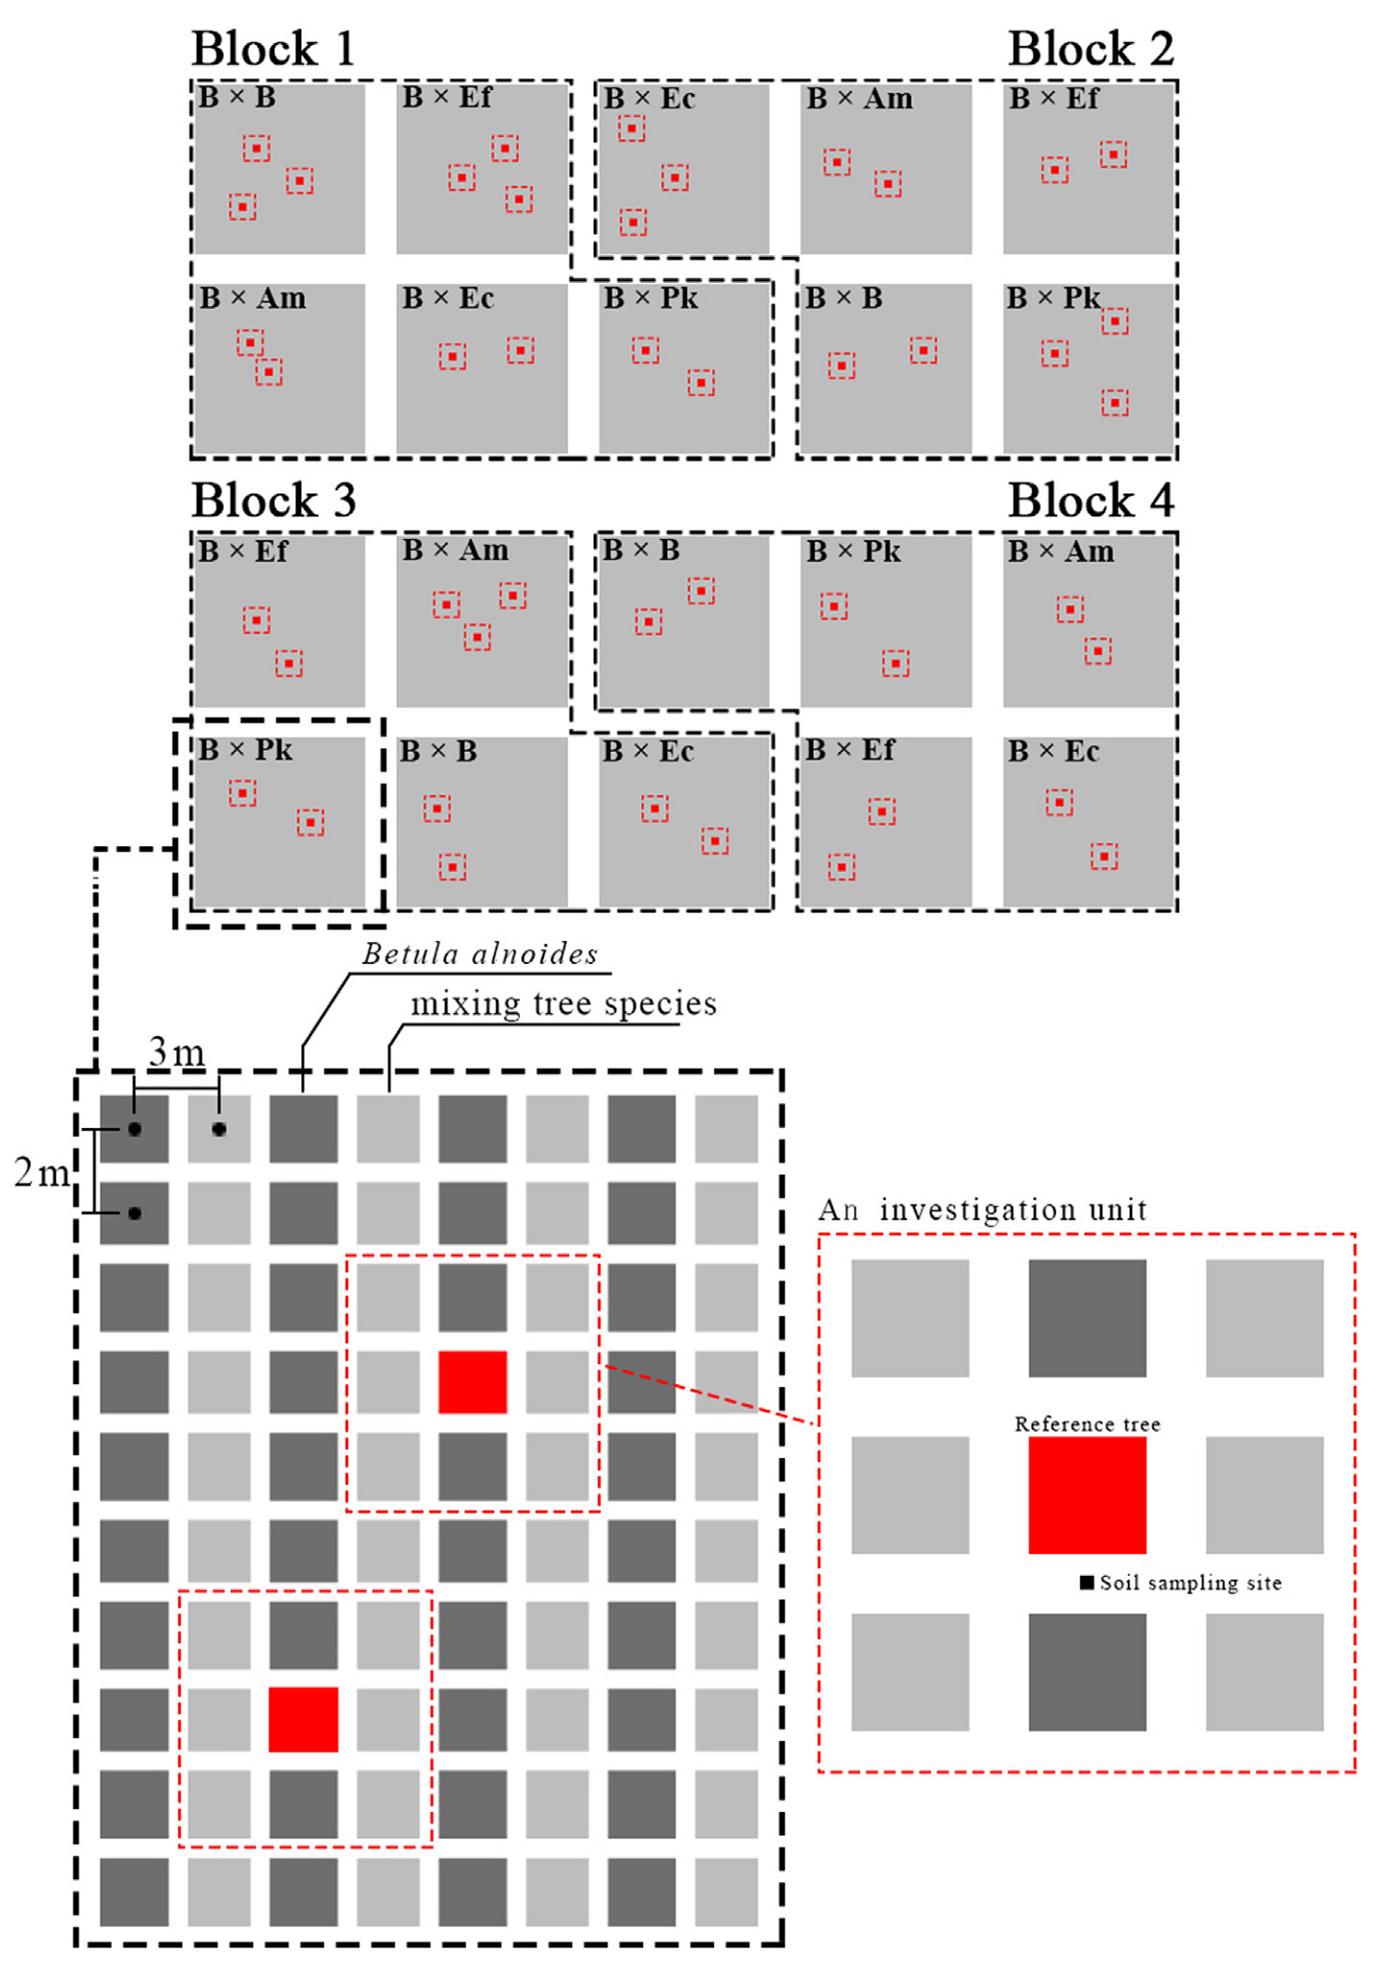
Diagram of the experimental and investigation unit design.
| Citation: |
Boyao Chen, Kaili Liu, Chunsheng Wang, Junjie Guo, Junkun Lu, Lin Chen, Zhigang Zhao, Jie Zeng. Tree allometry responses to competition and complementarity in mixed-species plantations of Betula alnoides[J]. Forest Ecosystems, 2024, 11(1): 100207. DOI: 10.1016/j.fecs.2024.100207

|
Tree allometry plays a crucial role in tree survival, stability, and timber quantity and quality of mixed-species plantations. However, the responses of tree allometry to resource utilisation within the framework of interspecific competition and complementarity remain poorly understood. Taking into consideration strong- and weak-space competition (SC and WC), as well as N2-fixing and non-N2-fixing tree species (FN and nFN), a mixed-species planting trial was conducted for Betula alnoides, a pioneer tree species, which was separately mixed with Acacia melanoxylon (SC + FN), Erythrophleum fordii (WC + FN), Eucalyptus cloeziana (SC + nFN) and Pinus kesiya var. langbianensis (WC + nFN) in southern China. Six years after planting, tree growth, total nitrogen (N) and carbon (C) contents, and the natural abundances of 15N and 13C in the leaves were measured for each species, and the mycorrhizal colonisation rates of B. alnoides were investigated under each treatment. Allometric variations and their relationships with space competition and nutrient-related factors were analyzed. The results showed a consistent effect of space competition on the height-diameter relationship of B. alnoides in mixtures with FN or nFN. The tree height growth of B. alnoides was significantly promoted under high space competition, and growth in diameter at breast height (DBH), tree height and crown size were all expedited in mixtures with FN. The symbiotic relationship between ectomycorrhizal fungi and B. alnoides was significantly influenced by both space competition and N2 fixation by the accompanying tree species, whereas such significant effects were absent for arbuscular mycorrhizal fungi. Furthermore, high space competition significantly decreased the water use efficiency (WUE) of B. alnoides, and its N use efficiency (NUE) was much lower in the FN mixtures. Structural equation modeling further demonstrated that the stem allometry of B. alnoides was affected by its NUE and WUE via changes in its height growth, and crown allometry was influenced by the mycorrhizal symbiotic relationship. Our findings provide new insights into the mechanisms driving tree allometric responses to above- and below-ground resource competition and complementarity in mixed-species plantations, which are instructive for the establishment of mixed-species plantations.
Compared with monocultures, mixed-species forests generally exhibit advantages in terms of productivity and ecological functions (Binkley, et al., 1992a; Bauhus et al., 2004; Erskine et al., 2006; Piotto, 2008; Suz et al., 2017). These advantages could be attributed to interspecific complementarity and facilitation as well as the biodiversity-productivity relationship (Bertness and Callaway, 1994; Pretzsch et al., 2013; Feng et al., 2022), making mixed-species management widely adopted in practice (Nichols et al., 2006; Hulvey et al., 2013; Forrester and Bauhus, 2016). Tree allometry influences growth and survival through its effects on tree vigor, light interception, and resistance to mechanical damage. Differences in tree allometry among coexisting species have proven to be relevant to species position (i.e. niche) in forests (King, 1991; Osada, 2011). A number of studies have found that tree allometry differs significantly between monocultures and mixtures, and these differences are species-specific (Pretzsch, 2014; Forrester et al., 2017; Jucker et al., 2017). However, in practice, such variations in tree allometry do not always contribute positively to the long-term survival, mechanical stability, and timber quality of tree species (Knoke et al., 2008; Pretzsch and Rais, 2016; Zhang et al., 2020). Exploring the allometric responses of certain tree species to different accompanying species is critical for the sustainable development of mixed-species plantations with high productivity and stability.
It has been documented that allometric variations are also closely linked to tree species composition in mixtures (Laclau et al., 2008; Pretzsch et al., 2015; Forrester et al., 2017). When mixed with tall trees, due to the increasing competition of light, trees would allocate more carbon to tree height growth than to tree diameter to maintain their position in the canopy (Ghorbani et al., 2018). Austin et al. (1997) also reported that in mixtures with N2-fixing species, the optimal predictor for E. grandis biomass is the diameter at breast height (DBH) rather than its height, because of the flexibility of tree height growth to various interspecific competition patterns. These studies underscored the importance of interspecific competition patterns in modifying tree allometry when mixed with N2-fixing species. Additionally, allometric relationship variations for stem and crown variables were observed between monocultures and mixtures, and among mixtures (Bauhus, et al., 2004; Thorpe et al., 2010; Metz et al., 2013; Pretzsch, 2014; Forrester et al., 2017). Nevertheless, in mixed-species forests, competition and complementarity (facilitation and competitive reduction) interactions may occur both above- and below-ground between species (Bauhus et al., 2000; Forrester et al., 2004; Valiente-Banuet and Verdú, 2008; Pretzsch et al., 2017).
Regarding underground resources, changes in the soil water content and competition patterns can prompt specific tree species to modify their water use efficiency (WUE) and adapt to different growth environments (Binkley et al., 2004; Forrester et al., 2010; Marron and Epron, 2019; Thomas et al., 2022). Variations in WUE are closely associated with changes in tree growth indicators, such as mean tree size (Forrester, 2015) and biomass (Thomas et al., 2022), because water can be more efficiently utilised for growth, particularly in water resource shortages or competitive environments. Generally, there is a trade-off between nitrogen use efficiency (NUE) and WUE (Sheng et al., 2011; Dijkstra et al., 2016), and changes in NUE are influenced by soil nutrient availability and mixture patterns (Binkley et al., 1992b; Zeugin et al., 2010; Choi and Rom, 2011). This implies that the effects of WUE and NUE on tree allometry may be different. Furthermore, mycorrhizae contribute to the assimilation, transportation, and metabolism of water and nutrient (Nehls and Plassard, 2018; Rotter et al., 2020). Mycorrhizal fungal communities between or among mixtures are greatly affected by differences in host preferences and nutrient conditions, especially between mixtures of N2-fixing and non-N2-fixing tree species (Liese et al., 2018; Weemstra et al., 2020). However, knowledge gaps still exist regarding the effects of these factors on allometric variation, which is crucial for predicting mixed-species forest development (Forrester and Pretzsch, 2015).
Betula alnoides Buch.-Ham. ex D. Don is a valuable, and fast-growing deciduous tree species indigenous to Southeast Asia and Southern China. Its wood is of moderate density, less likely to crack and warp, and is easily manufactured. It is extensively used for making floorboards, panels, and high-grade furniture, and is also an ideal material for high-class interior decorations and overlaid veneers. B. alnoides is shade intolerant and has wide adaptability to soil type, altitude and climatic conditions (Zeng et al., 1999). It has been widely planted for large-sized timber production with a rotation of approximately 25 years in the tropical and warm subtropical areas of southern China. Acacia melanoxylon and Eucalyptus cloeziana are exotic fast-growing tree species (Unwin et al., 2006; Alcorn et al., 2013), whereas Erythrophleum fordii and Pinus kesiya var. langbianensis are indigenous slow-growing tree species (Zhao et al., 2021). These are the main timber species in southern China, A. melanoxylon and Eu. Cloeziana normally grew faster while Er. Fordii and P. kesiya var. langbianensis grew slower than B. alnoides, and A. melanoxylon and Er. Fordii are N2-fixing species. In this study, an experiment was conducted for separate mixtures of B. alnoides with A. melanoxylon, Er. Fordii, Eu. Cloeziana, and P. kesiya var. langbianensis, taking fast- and slow-growing as well as N2-fixing and non-N2-fixing tree species into consideration. This study aimed to determine how the tree allometry of B. alnoides responds to different interspecific interactions in its mixtures, to reveal potential environmental factors influencing allometric variations, and to verify the following hypotheses: (ⅰ) space competition plays a pivotal role in the tree allometry of B. alnoides in its mixtures whether with N2-fixing or non-N2-fixing tree species; (ⅱ) the allometric relationship of B. alnoides is also influenced by competition and complementarity of underground resources; and (ⅲ) mycorrhizal symbiosis alleviates the effect of resource competition on the tree allometry of B. alnoides.
This study was conducted at Xiaoheijiang Forest Farm of Weiguo Forest Bureau, located in Southwest China (23°08′08″ N, 100°49′49″ E). The experimental region falls within subtropical monsoon climate zone with an elevation of 1,237 m, characterised by an annual mean air temperature of 18.2 ℃. Monthly temperatures range from a minimum of 12 ℃ to a maximum of 22 ℃. The mean annual precipitation is 1,414.9 mm, with more than 80% concentrated during the rainy season from June to October. The soil is latosol, originating from Triassic sandstones of the Jurassic and Cretaceous periods in the Mesozoic zone.
The experimental plantations were established on cutover lands of Pinus kesiya var. langbianensis in July 2015. The experiment included five treatments: a monoculture of Betula alnoides (B × B) and four separate mixtures of B. alnoides with Acacia melanoxylon (B × Am), Erythrophleum fordii (B × Ef), Eucalyptus cloeziana (B × Ec) and P. kesiya var. langbianensis (B × Pk). It was arranged in a randomised block design with four replicates on south or southeast slopes with gradients between 12° and 25°. Each plot was approximately 0.4 ha in size. The planting spacing was 2 m × 3 m (1,111 stems per hectare), and the tree species were mixed row by row in a 1:1 ratio. Seedlings of B. alnoides and A. melanoxylon were tissue culture seedlings provided by the Experimental Center of Tropical Forestry and the Research Institute of Tropical Forestry, Chinese Academy of Forestry, respectively. The seedlings of Eucalyptus cloeziana, Erythrophleum fordii and P. kesiya var. langbianensis were cultivated in a local nursery from seeds.
In May 2021, the height and DBH of each B. alnoides tree were measured in each plot. Their means (±SD) were 9.0 ± 1.6 m and 8.5 ± 1.8 cm in its monocultures, and 11.1 ± 2.2 m and 9.3 ± 2.3 cm, 10.2 ± 1.9 m and 7.6 ± 1.1 cm, 6.8 ± 1.0 m and 7.3 ± 1.5 cm, 8.0 ± 0.9 m and 8.6 ± 1.5 cm in its mixtures with A. melanoxylon, Eu. Cloeziana, P. kesiya var. langbianensis and Er. Fordii, respectively. Two or three average-sized B. alnoides trees were randomly selected as the reference trees in each plot. One reference tree and its eight nearest accompanying trees were considered as an investigation unit (Fig. 1). In total, 45 investigation units were defined across all five treatments. The height, diameter at breast height, and canopy area were measured for all trees as well as the distance between each accompanying tree and the reference tree, and fine root samples were collected from the reference tree in each investigation unit. A 20 cm × 20 cm × 20 cm cubic soil block was dug 1 m away from the reference tree in downhill direction, and fine roots samples (diameter less than 2 mm) of B. alnoides were collected. B. alnoides roots were mainly identified on the basis of their special smell, which is quite strong, and is similar to the scent of essential balm ("fengyoujing" in Chinese spelling). Fine root samples were used to determine the rate of mycorrhizal colonisation. Additionally, approximately 15 leaves were collected from the middle-upper crowns of the reference trees in each investigation unit to measure their carbon (C) and nitrogen (N) contents and stable isotope natural abundances of C and N. Leaves from the accompanying tree species within each investigation unit were also collected for C and N measurement.
To describe the size of B. alnoides crowns in various mixtures, the crown shape was considered an ellipsoid, and the maximum cross-sectional area of this ellipsoid was the crown projection area (CPA), which was considered an ellipse. Crown volume (CV) and CPA were calculated using the following Equations:
| Crownvolume(CV)=4πabc |
| Crownprojectionarea(CPA)=πbc |
where a is half of the crown lengths (CL), and b and c are the semi-major and semi-minor axes of the maximum horizontal cross-section of the crown, respectively.
The total space competition index (CItotal) of the reference trees was calculated as follows:
| CI=∑8j=1hjCPAjcdjdj |
where j represents the eight nearest accompanying trees for each reference tree, h is tree height, and cd and d are compass directions (0.5 for north, 1.5 for south-east and south-west, 1.0 for the rest directions) and the distance between the accompanying tree and reference tree, respectively (Van de Peer et al., 2017). The competition sources of each reference tree were classified as CIintra and CIinter based on whether the accompanying tree was of the same species as the reference tree.
Foliage was dried under 60 ℃ for at least 48 h until a constant weight was reached (Yu et al., 2022). Then, C and N contents and their stable isotope abundance were measured by isotope ratio mass spectrometer (IRMS) (Delta C Finnigan MAT, Germany). C or N isotope natural abundances were expressed as δ13C and δ15N, which were calculated with the following equation:
| δ=1000(Rsample −Rstandard )Rstandard |
where Rsample is the C or N isotope abundance of each sample, and Rstandard is the reference value of N isotope from atmospheric N2 or that of C isotope from Vienna Pee Dee Belemnite.
The fine roots of each reference tree were washed with water and randomly separated into two parts. One part of the roots was decolourised by 10% KOH at 90 ℃ for 30 min and cut into 1-cm-long segments. Two hundred segments were collected and stained using the ink-vinegar staining method, and the arbuscular mycorrhizal (AM) colonisation of each segment was observed using the gridline intersection method under 200× magnification (Gianinazzi et al., 2010). For the other parts of the roots, the root tips were used to assess ectomycorrhizal (ECM) colonisation at 40× magnification. Mycorrhizal tissues were identified as described by Brundrett et al. (1996). The AM and ECM colonisation rates were calculated using the following equation:
| Mycorrhiza colonisation rate (%)=100%nmycor ntotal |
where nmycor is the number of tips or segments with fungal structures, and ntotal is the sum of all tips or segments.
Foliage δ13C was utilised to represent water use efficiency (WUE) because of the close correlation between them (Forrester, 2015; Liu et al., 2020). Active photosynthesis usually implies that more N is allocated to the leaves (Reich et al., 1997), resulting in a reduction of the foliage C to N ratio. This parameter has been widely used to assess NUE of trees (Livingston et al., 1999; Sheng et al., 2011; Su and Shangguan, 2020). The percentage of N derived from atmospheric N2 (Ndfa%) for N2-fixing tree species (A. melanoxylon and Erythrophleum Fordii) was also calculated, with the reference value for non-N fixing tree species being the foliage δ15N of B. alnoides in monoculture (Forrester et al., 2007). The N-free reference value was zero due to the lack of published data on Erythrophleum spp. (Hamilton et al., 1993). Since the difference in N2 fixation ability between tree species usually causes an obvious gap in foliage δ15N, this gap can be used to test whether the atmospheric N transported from N2-fixing to non-N2-fixing tree species by comparing their foliage δ15N (Van Kessel et al., 1994). Hence, the foliage δ15N of B. alnoides in monoculture and its mixtures with non-N2-fixing species were compared with those in its mixtures with N2-fixing species, to detect whether the above-mentioned transportation of atmospheric N occurred.
General linear model (GLM) with multiple range tests (least significant difference) was used to examine the differences in growth performance, nutrient conditions, resource utilisation efficiency, and mycorrhizal colonisation rate among the treatments. In these analyses, treatments and blocks were selected as fixed factors and the investigation units were designated as random factors. Pearson's correlation analysis was conducted to quantify the relationships between the morphological, competitive, and nutrient parameters of the reference trees. Multivariate fitting model was also applied to test the co-effects of the corresponding independent variables on the allometric parameters. Structural equation modeling is a powerful statistical method to integrate multivariates and their relationships in a single hypothesised network (Mensah et al., 2016; Das Gupta and Pinno, 2020), and it was further conducted to elaborate the relationship between tree allometry and underground factors. All analyses were performed using R software v.4.2.2.
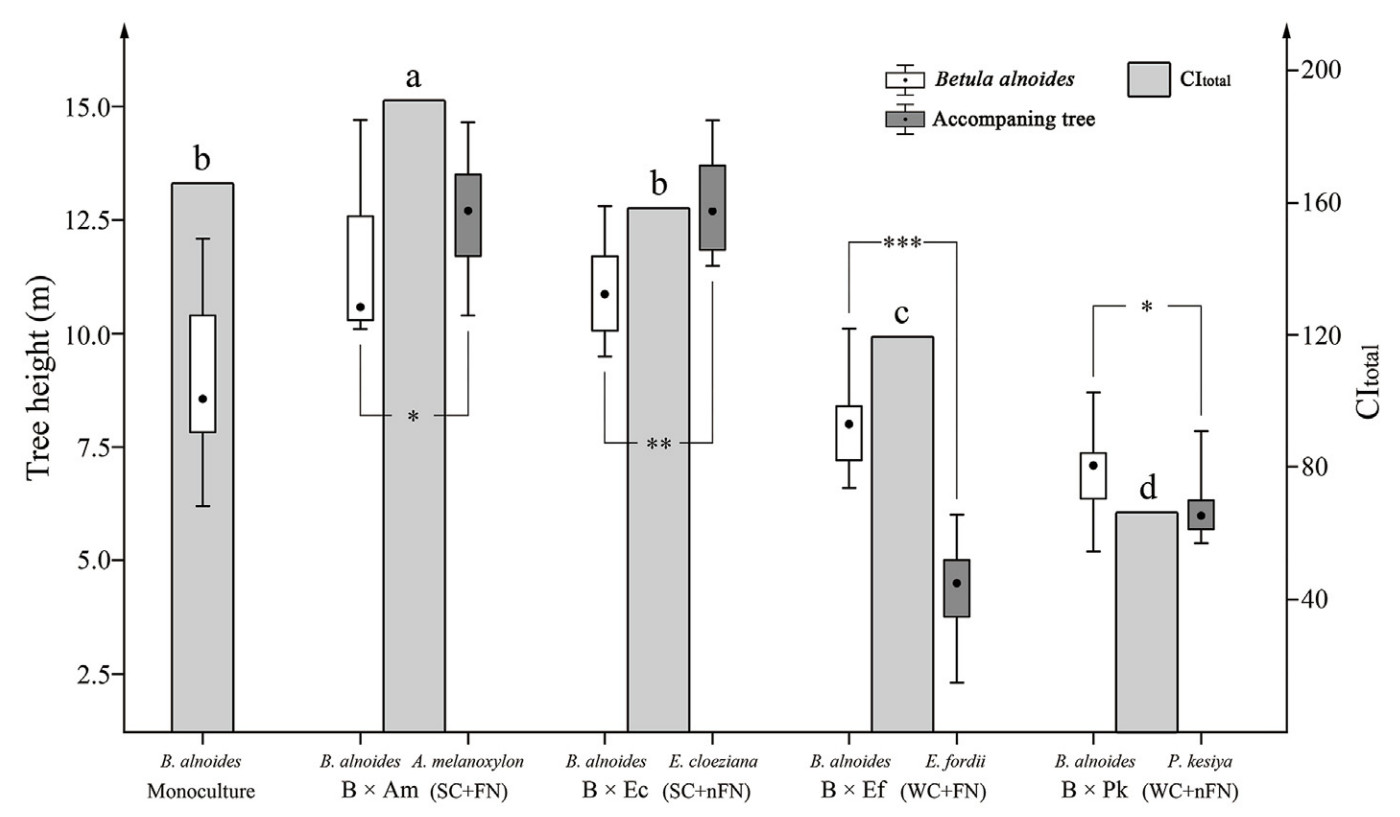
The results showed that Acacia melanoxylon and Eucalyptus cloeziana grew faster, while Erythrophleum fordii and Pinus kesiya var. langbianensis grew slower than Betula alnoides in their respective mixtures, which was expected. The total space competition intensity (expressed as CItotal) of the reference tree (B. alnoides) was also significantly (p < 0.05) stronger in its mixtures with A. melanoxylon (B × Am) or Eu. Cloeziana (B × Ec) than in its mixtures with Er. Fordii (B × Ef) or P. kesiya var. langbianensis (B × Pk) (Fig. 2). Therefore, considering the growth performances and N2 fixation ability of the accompanying tree species, four mixing patterns of B. alnoides (reference tree) were defined: strong competition + N2-fixing species (SC + FN, B × Am), weak competition + N2-fixing species (WC + FN, B × Ef), strong competition + non-N2-fixing species (SC + nFN, B × Ec), and weak competition + non-N2-fixing species (WC + nFN, B × Pk).
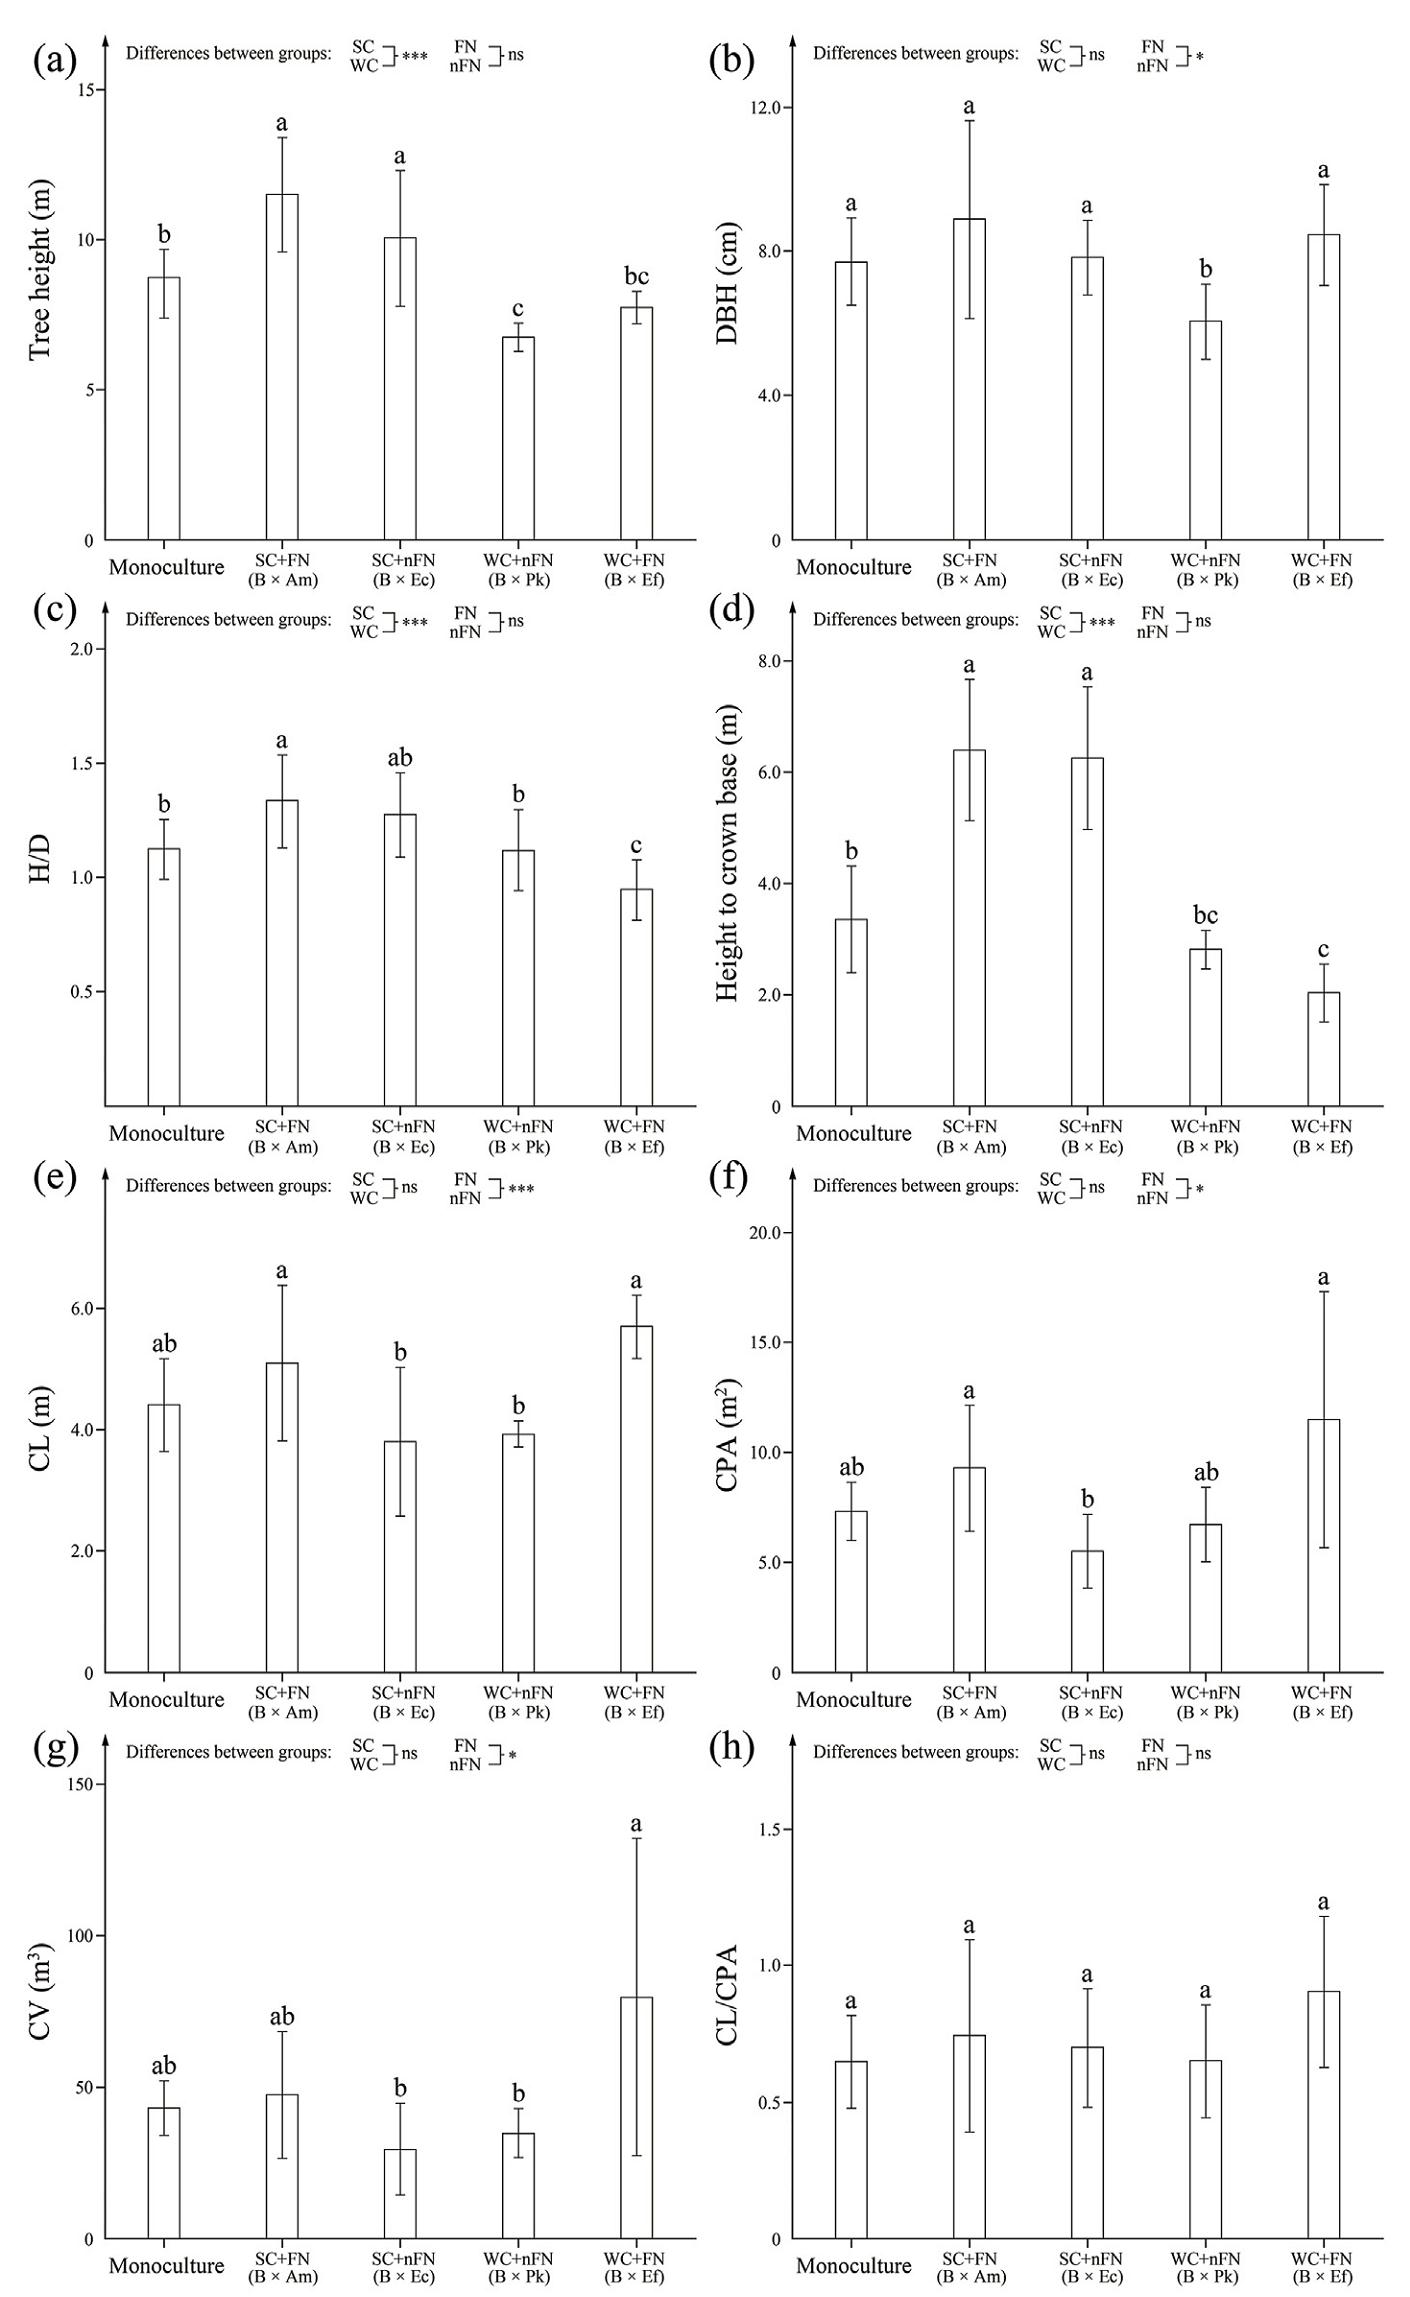
The tree height of B. alnoides in monoculture was significantly lower than that in its mixtures with SC (B × Am and B × Ec; p < 0.05), and higher than that in its mixtures with WC (B × Pk and B × Ef) (Fig. 3a). There was no significant difference in tree height between its mixtures with FN (B × Am and B × Ef) and nFN (B × Ec and B × Pk; Fig. 3a). For diameters at breast height (DBH) of B. alnoides, there was no significant difference between its mixtures with SC and WC (p ≥ 0.05), while the DBH was significantly larger in its mixtures with FN than nFN (Fig. 3b). Consequently, the ratio of tree height to DBH (HD) of B. alnoides in its mixture with SC was significantly higher than that in its monoculture and mixtures with WC, and there was no significant difference in the HD between its mixtures with FN and nFN (Fig. 3c).
The morphological parameters of the crowns for B. alnoides varied across the mixing treatments. The variation trend of height to crown base was similar to that of tree height (Fig. 3d). Both crown length (CL) and crown projection area (CPA) of B. alnoides were significantly lower in its mixtures with nFN than FN (Fig. 3e and f), and the variation pattern of crown volume (CV) followed a similar trend (Fig. 3g). There were no significant differences in CLCPA among the treatments (Fig. 3h).
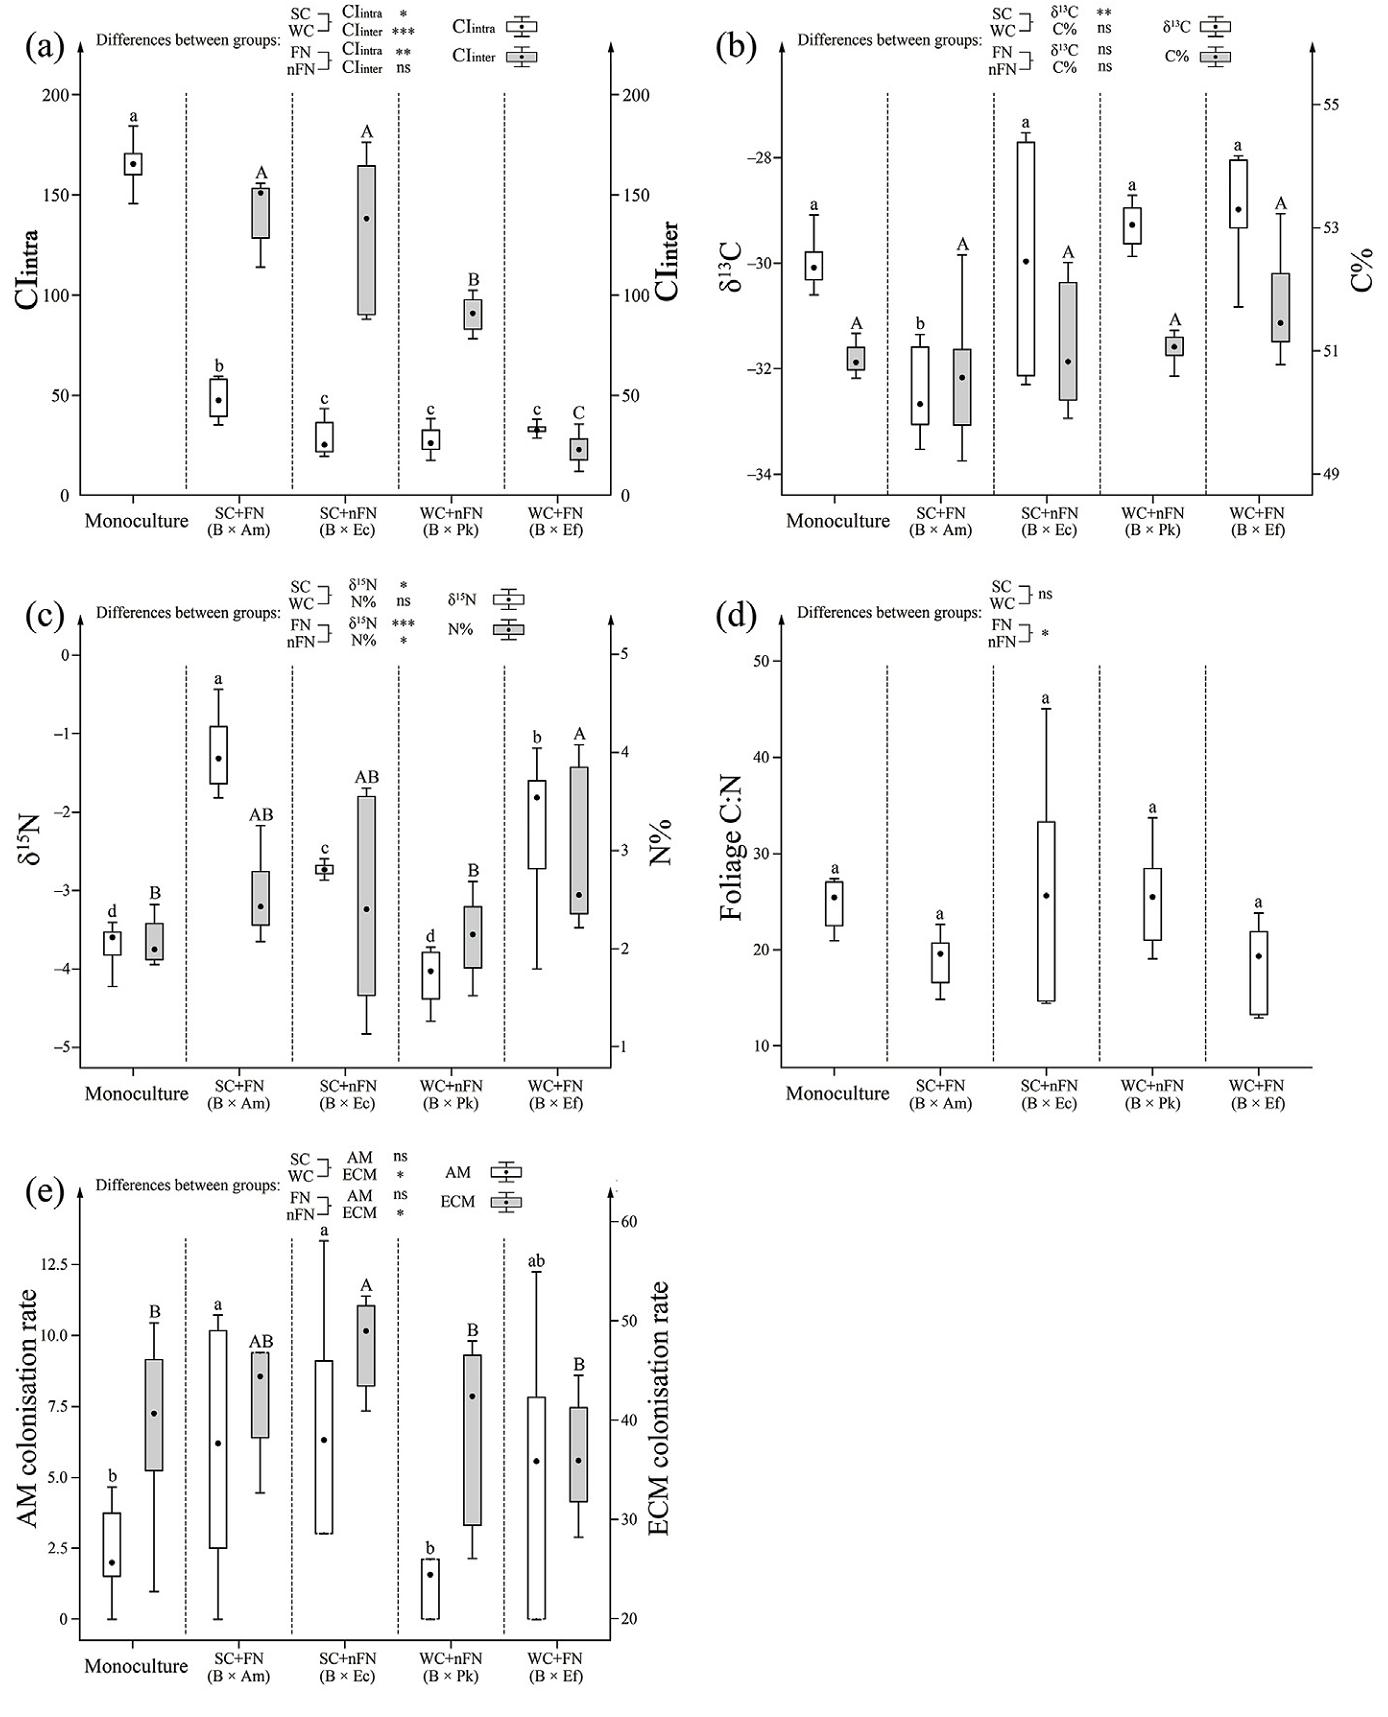
The total space competition intensity of the reference tree was (expressed as CItotal) much stronger in its monoculture than in its mixture with WC (Fig. 2), while it was significantly weaker than that in B × Am, and did not differ significantly from that in B × Ec (Fig. 2). Specifically, the intraspecific space competition (CIintra) of B. alnoides was significantly stronger in its mixtures with SC than WC, and in its mixtures with FN than nFN (Fig. 4a). Additionally, interspecific space competitions (CIinter) of B. alnoides in its mixture with SC were also significantly higher than that with WC. In most mixing treatments, CIinter was notably higher than CIintra, except for B × Ef (Fig. 4a).
The water use efficiency (WUE, expressed as foliage δ13C) of the reference tree was significantly lower in its mixtures with SC than WC, while a significant difference in its foliage C% was absent between them (Fig. 4b). N derived from atmospheric N2 (Ndfa%) in A. melanoxylon and Er. Fordi were 40.5% and 49.7%, respectively (Table 1). Their foliage δ15N was significantly higher than that of B. alnoides in monoculture and mixtures with non-N2-fixing species (p < 0.001). The foliage δ15N and N% of B. alnoides in its mixtures with FN were significantly higher than those in its monoculture and mixtures with nFN (Fig. 4c). This suggested that the atmospheric N is supplemented to B. alnoides from N2-fixing species in their mixtures. However, the N use efficiency (NUE, expressed as foliage C: N), was significantly lower in mixtures with FNs than nFN (Fig. 4d).
| Species | δ15N | N% | δ13C | C% | C: N | Ndfa% |
| Acacia melanoxylon | −2.27 ± 0.30 b | 2.41 ± 0.14 b | −31.52 ± 0.30 c | 54.96 ± 0.51 a | 22.84 ± 0.38 b | 40.49% |
| Erythrophleum fordii | −1.92 ± 0.36 a | 3.27 ± 0.43 a | −29.63 ± 0.24 a | 53.30 ± 0.94 b | 16.60 ± 2.36 c | 49.73% |
| Eucalyptus cloeziana | −2.05 ± 0.26 ab | 1.97 ± 1.27 c | −30.29 ± 1.87 b | 51.21 ± 1.14 c | 26.00 ± 6.92 a | – |
| Pinus kesiya var. langbianensis | −3.98 ± 0.36 c | 2.26 ± 0.32 bc | −29.85 ± 0.34 ab | 49.98 ± 0.18 c | 22.44 ± 3.95 b | – |
 DownLoad:
CSV
DownLoad:
CSV
Regarding the symbiont relationship between the reference trees and mycorrhizal fungi, the colonisation rates of AM and ECM fungi were 5.2% and 49.0%, respectively. The colonisation rate of AM fungi was significantly lower in its monoculture than in most of its mixtures, except B × Pk, and a significant difference was absent between its mixtures with SC and WC, as well as between its mixtures with FN and nFN. The colonisation rate of ECM was significantly higher in its mixtures with nFN than FN, and in its mixtures with SC than WC (Fig. 4e).
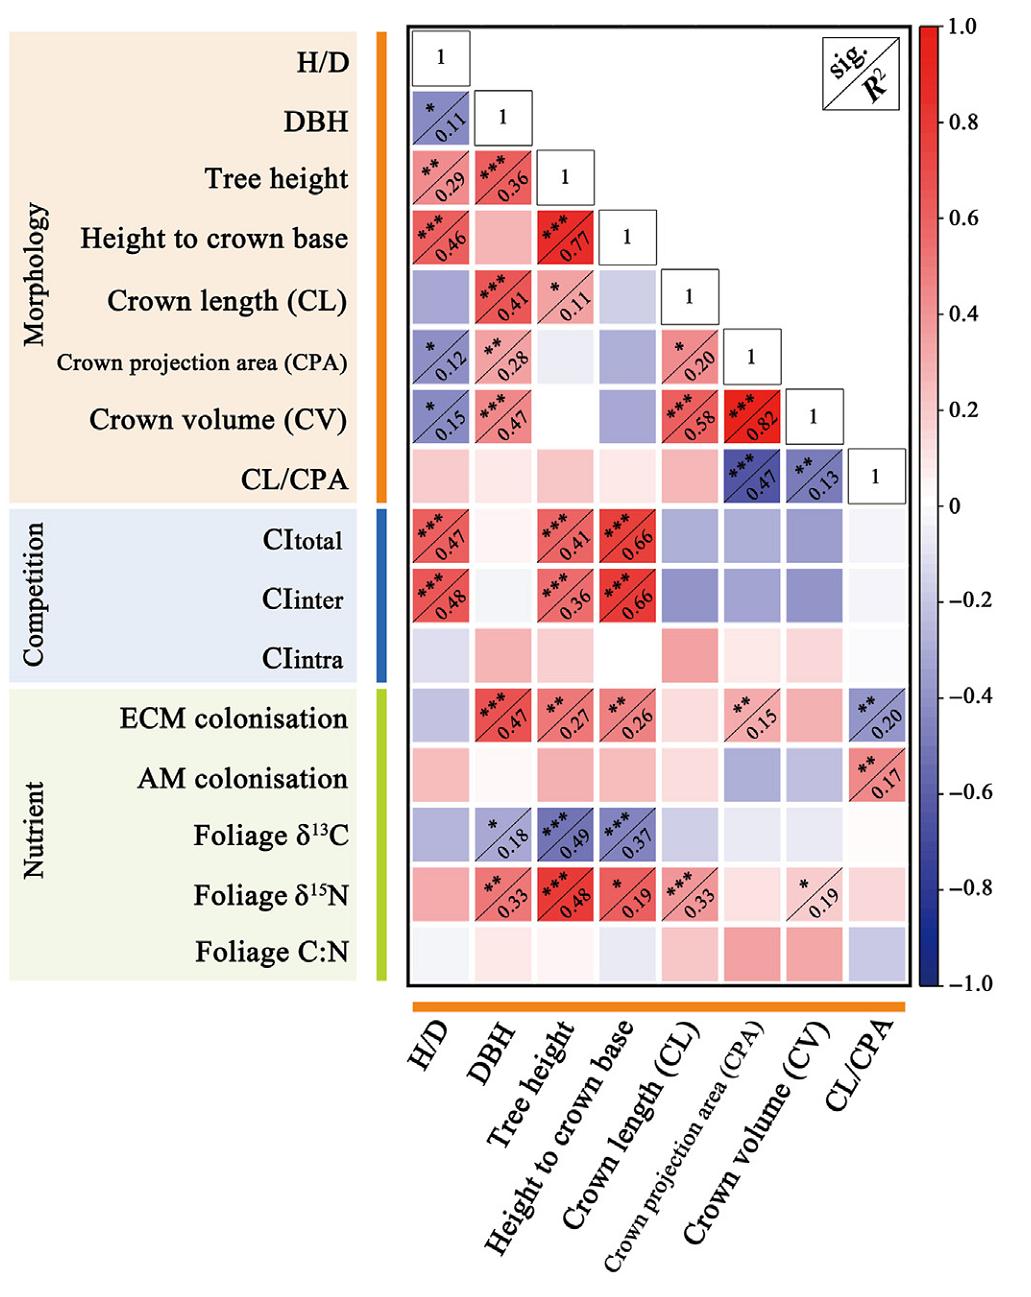
The results of the correlation analysis indicated that tree height and DBH were all significantly positively correlated with the ECM colonisation rate and foliage δ15N, and negatively correlated with foliage δ13C (Fig. 5). The tree height was positively correlated with CItotal and CIinter. The multivariate fitting model revealed that 75.9% of tree height variances could be explained by CItotal, δ15N, δ13C and ECM colonisation rate, and 57.6% of DBH variances could be explained by δ15N, δ13C and ECM colonisation rate (Table 2).
| Multivariate fitting model | Adj.R2 | n |
| Tree height = 0.012CItotal + 0.89δ15N – 0.235δ13C + 0.809ECM – 0.807 | 0.7592 | 36 |
| DBH = 0.653δ15N – 113δ13C + 0.13ECM +0.672 | 0.5763 | 36 |
DownLoad:
CSV
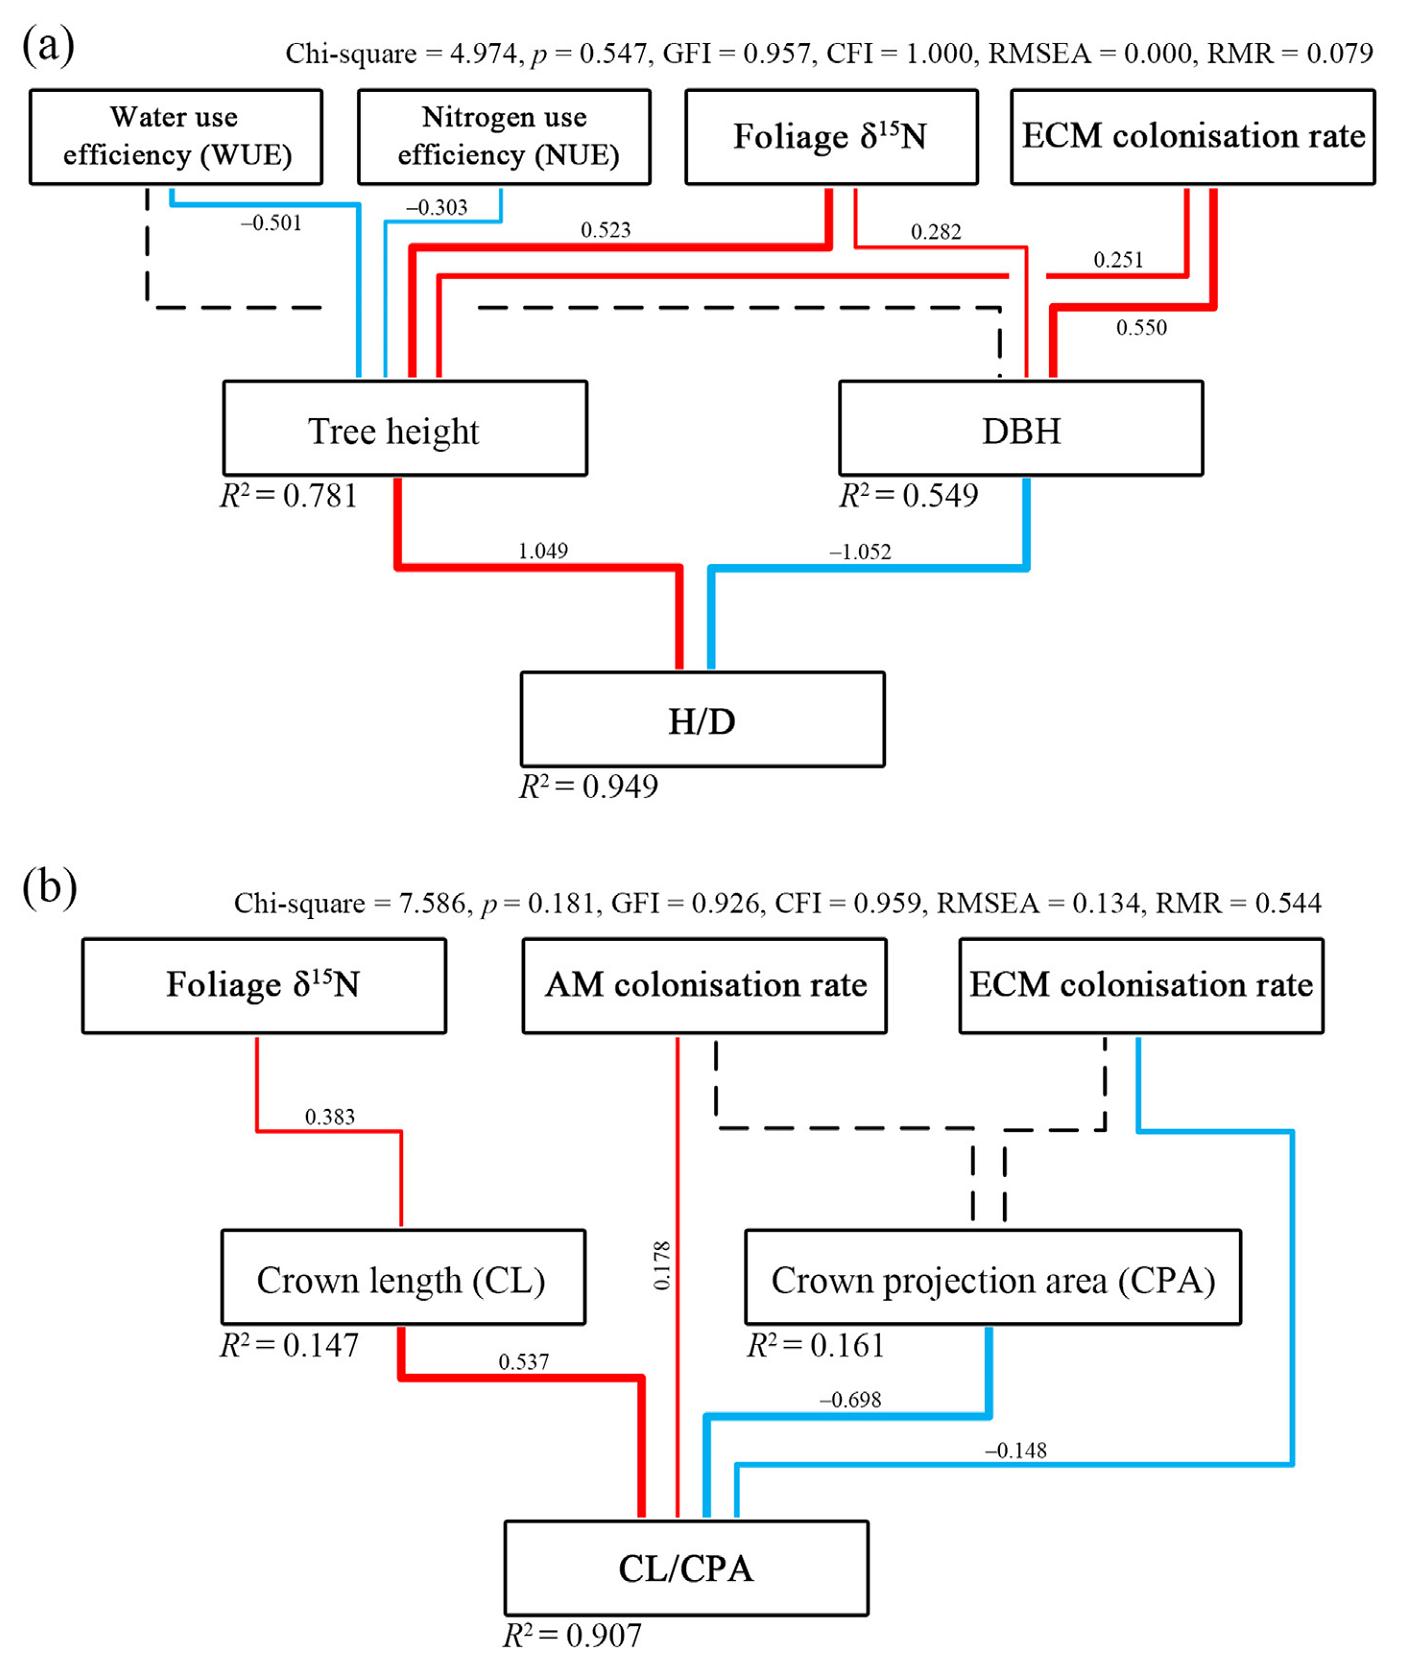
HD was significantly positively correlated with height to crown base, CItotal and CIinter, but was negatively correlated with CPA and CV. This inferred that a slender crown was shaped simultaneously with a slender stem for the reference tree in the mixtures. Structural equation modeling (SEM) further confirmed the above results of stem allometry (Fig. 6a), with the model's chi-square, p value, goodness-of-fit index and comparative fit index of 4.974, 0.547, 0.957 and 1.000, respectively.
Crown allometric relationships were correlated with both space competition and nutrient status. The height of crown base was positively related to space competition parameters (CItotal and CIinter). CL and CV were significantly correlated with foliage δ15N (Fig. 5). CLCPA was significantly negatively correlated with ECM colonisation rate, and positively correlated with AM colonisation rate (Fig. 5). This finding was supported by the SEM results, where the path significance of AM and ECM colonisation rates – CPA was absent, but they directly affected CLCPA (Fig. 6b). The model's chi-square, p value, goodness-of-fit index and comparative fit index were 7.586, 0.181, 0.926 and 0959, respectively.
In the present study, the growth performance of Betula alnoides (reference tree) showed distinct responses to space competition intensity and N2 fixation of the accompanying tree species in the mixtures. The tree height growth of B. alnoides was significantly accelerated in its mixtures with strong space competition (SC). This was attributed to the shade intolerance of B. alnoides, which drove its tree height growth to occupy the upper growth space in mixed plantations (Rodrigues et al., 2019). The height growth might take precedence over the growth of DBH to escape "light cage" for B. alnoides (Santos et al., 2016; Ghorbani et al., 2018; Paula et al., 2018), and its response of tree height growth to spatial competition from neighboring trees is the primary factor driving the tree morphological variation under such aboveground growth competition. This can be defined as an adaptation of trees to different competition patterns in the mixtures (Forrester et al., 2017; Van de Peer et al., 2017; Rodrigues et al., 2019; Carr et al., 2020). However, tree height growth could not be deemed as the cost of DBH reduction to cope with strong space competition in the present study. The potential reason might be linked to the inherent characteristics of B. alnoides. On one hand, the accelerated tree height growth facilitated the capture of additional light for photosynthesis; on the other hand, diameter growth was less affected for large diameter trees in competition with taller neighbours (Commes and Allen, 2007). In addition, the facilitation of tree height growth was also correlated with the significantly lower WUE of B. alnoides in its mixtures with SC. WUE is regulated by stomatal limitation (Ares and Fownes, 1999), the high-intensity shading from taller neighboring trees in its mixture with SC resulted in the increase of stomatal conductance, and thus in low WUE (Huang et al., 2022).
Generally, an increase in DBH is accompanied by an increase in CPA, this phenomenon has been widely reported for several tree species (Erickson et al., 2009; Forrester et al., 2017; Pretzsch, 2019). In the present study, mixing with N2-fixing tree species significantly promoted the DBH, CL and CPA growth of the reference tree. This may be because photosynthesis rate of a tree species is usually limited by N, and the improved N conditions in lower-position branches increased their photosynthetic ability in its mixture with N2-fixing tree species (Yoshimura, 2010), which could support the survival of these branches for a longer time.
The covariation in growth traits under different space and nutrient competition and complementarity conditions resulted in changes in tree allometry of B. alnoides in the present study. Similar variation trends in CL and CPA resulted in the absence of significant differences in CLCPA among the treatments. HD increased under strong space competition and decreased under weak space competition, regardless of whether in mixtures of FN or non-N2-fixing tree species (nFN). This was consistent with previous studies conducted on eucalypts and poplar, where HD increased in mixtures with taller tree species whether they are N2-fixing tree species or not (Parrotta, 1999; Ghorbani et al., 2018; Benomar et al., 2013; Forrester and Smith, 2012). The increase in HD under strong space competition reflects its survival strategy, whereas the decrease in HD under weak space competition might be a trade-off for better stand stability (Osunkoya et al., 2007).
Allometric variations of B. alnoides were also modified through changing its nutrient and water utilisation strategies. As revealed by structural equation modeling (SEM), the variation in HD was influenced by water use efficiency and nitrogen use efficiency, which influenced tree height. This might be due perhaps to the fact that carbon assimilation rate is closely correlated with foliar nutrient concentration and water availability in soil (Huang et al., 2022), while species mixing enhances soil water and nutrient availability through complementarity effect, and then decreases the resource utilisation efficiency of individual trees and communities (Chaves et al., 2021). This was confirmed by the significant increase of foliage N%, and decrease of NUE and WUE for B. alnoides in the mixture. The foliar δ15N of B. alnoides was significantly (at the level of 0.001) higher in its mixtures with FN than nFN, which inferred that nitrogen fixed by FN was transferred to B. alnoides and improved its nitrogen nutrient in its mixtures with FN (Van Kessel et al., 1994). In addition, the decrease of ECM colonisation rate could also be attributed to that better N conditions reduced tree reliance on ECM symbionts, and the C investments to sustain such symbiotic relationships were reduced by the host trees (Johnson, 2010; Suz et al., 2017). It could also be assumed that tree hosts may regulate crown structure to assimilate more C to exchange nutrients from ECM symbiotic partners under limited soil nutrient conditions and increase N content mainly through fine-roots under rich nutrient conditions. Bzdyk et al. (2019) also reported that ECM colonisation was negatively related to crown health status. The colonisation rate of AM was much higher in its mixtures with SC than its monoculture. This might be caused by the co-effects of interspecific space competition pressure and mycorrhizal preference of accompanying tree species. Among the four accompanying tree species, Acacia melanoxylon and Eucalyptus cloeziana are of the same mycorrhiza type as B. alnoides, which are dual mycorrhizal (ECM and AM) (Zou and Zeng, 2018; Teste et al., 2020). This might increase colonisation rates of both AM and ECM for B. alnoides in its mixture with them. Pinus kesiya var. langbianensis and Erythrophleum fordii are ECM and AM tree species, respectively, this might be the reason that the significant differences in AM and ECM colonisation rates of B. alnoides were absent between its monoculture and its mixture with them. Therefore, the mycorrhiza type of mixed tree species should also be considered in establishment of mixed-species plantations.
Tree allometry of Betula alnoides (reference tree) was greatly modulated by resource competition and complementarity in its mixed forests. Mixing with N2-fixing tree species improved its nitrogen conditions, and increased its DBH and crown size. Under strong space competition, its tree height growth took precedence, but not at the expense of its DBH growth. The accompanying tree species influenced the tree allometry of B. alnoides mainly by changing the resource (water, nutrient and space) utilisation strategies, which was mainly correlated with ECM symbiosis. Therefore, it is important to successfully establish mixed plantations by considering both nutrient improvement and proper competition intensity when selecting accompanying tree species for a certain tree species. Furthermore, future development of allometric models should simultaneously consider both above- and below-ground resource competition and complementarity, and more attention should also be paid to long-term observations for the mixing experiment.
Data are available on request from the authors.
Boyao Chen: Writing – original draft, Methodology, Investigation, Data curation. Kaili Liu: Methodology, Investigation, Data curation. Chunsheng Wang: Writing – review & editing, Project administration, Methodology, Investigation. Junjie Guo: Resources, Investigation, Conceptualization. Junkun Lu: Supervision. Lin Chen: Supervision. Zhigang Zhao: Investigation, Conceptualization. Jie Zeng: Writing – review & editing, Supervision, Methodology, Conceptualization.
The authors declare no conflicts of competing interest.
We apologize to those whose work could not be cited because of space restrictions. We would like to thank Weiguo Forest Bureau for providing the experimental site and Jiwei Liu for his assistance in trial plantation investigation and sampling. Lastly, we thank the reviewers and the editor for their valuable assistance.
Figures(6) / Tables(2)


Supported by: Beijing Renhe Information Technology Co. Ltd. Technical support: info@rhhz.net
| Species | δ15N | N% | δ13C | C% | C: N | Ndfa% |
| Acacia melanoxylon | −2.27 ± 0.30 b | 2.41 ± 0.14 b | −31.52 ± 0.30 c | 54.96 ± 0.51 a | 22.84 ± 0.38 b | 40.49% |
| Erythrophleum fordii | −1.92 ± 0.36 a | 3.27 ± 0.43 a | −29.63 ± 0.24 a | 53.30 ± 0.94 b | 16.60 ± 2.36 c | 49.73% |
| Eucalyptus cloeziana | −2.05 ± 0.26 ab | 1.97 ± 1.27 c | −30.29 ± 1.87 b | 51.21 ± 1.14 c | 26.00 ± 6.92 a | – |
| Pinus kesiya var. langbianensis | −3.98 ± 0.36 c | 2.26 ± 0.32 bc | −29.85 ± 0.34 ab | 49.98 ± 0.18 c | 22.44 ± 3.95 b | – |
DownLoad:
CSV
| Multivariate fitting model | Adj.R2 | n |
| Tree height = 0.012CItotal + 0.89δ15N – 0.235δ13C + 0.809ECM – 0.807 | 0.7592 | 36 |
| DBH = 0.653δ15N – 113δ13C + 0.13ECM +0.672 | 0.5763 | 36 |
DownLoad:
CSV

 Email Alerts
 RSS Feeds