Álvaro Rubio-Cuadrado, Iciar Alberdi, Isabel Cañellas, Fernando Montes, Jesús Rodríguez-Calcerrada, Rosana López, Guillermo G. Gordaliza, María Valbuena-Carabaña, Nikos Nanos, Ramón Perea, Luis Gil. Twenty years of population dynamics in European beech-oak forest at their rear range margin anticipate changes in its structure and composition[J]. Forest Ecosystems, 2024, 11(1): 100197. DOI: 10.1016/j.fecs.2024.100197
Citation:
Álvaro Rubio-Cuadrado, Iciar Alberdi, Isabel Cañellas, Fernando Montes, Jesús Rodríguez-Calcerrada, Rosana López, Guillermo G. Gordaliza, María Valbuena-Carabaña, Nikos Nanos, Ramón Perea, Luis Gil. Twenty years of population dynamics in European beech-oak forest at their rear range margin anticipate changes in its structure and composition[J]. Forest Ecosystems, 2024, 11(1): 100197. DOI: 10.1016/j.fecs.2024.100197
Álvaro Rubio-Cuadrado, Iciar Alberdi, Isabel Cañellas, Fernando Montes, Jesús Rodríguez-Calcerrada, Rosana López, Guillermo G. Gordaliza, María Valbuena-Carabaña, Nikos Nanos, Ramón Perea, Luis Gil. Twenty years of population dynamics in European beech-oak forest at their rear range margin anticipate changes in its structure and composition[J]. Forest Ecosystems, 2024, 11(1): 100197. DOI: 10.1016/j.fecs.2024.100197
Citation:
Álvaro Rubio-Cuadrado, Iciar Alberdi, Isabel Cañellas, Fernando Montes, Jesús Rodríguez-Calcerrada, Rosana López, Guillermo G. Gordaliza, María Valbuena-Carabaña, Nikos Nanos, Ramón Perea, Luis Gil. Twenty years of population dynamics in European beech-oak forest at their rear range margin anticipate changes in its structure and composition[J]. Forest Ecosystems, 2024, 11(1): 100197. DOI: 10.1016/j.fecs.2024.100197
Departamento de dinámica y gestión forestal, Instituto de Ciencias Forestales (ICIFOR-INIA), CSIC, Ctra. La Coruña km 7.5, 28040, Madrid, Spain
b.
Departamento de Sistemas y Recursos Naturales, Escuela Técnica Superior de Ingeniería de Montes, Forestal y del Medio Natural, Universidad Politécnica de Madrid. Ciudad Universitaria s/n, 28040, Madrid, Spain
c.
School of Forestry and Natural Environment, Aristotle University of Thessaloniki, University Campus, 54124, Thessaloniki, Greece
There is an increasing interest in restoring degraded forests, which occupy half of the forest areas. Among the forms of restoration, passive restoration, which involves the elimination of degrading factors and the free evolution of natural dynamics by applying minimal or no management, is gaining attention. Natural dynamics is difficult to predict due to the influence of multiple interacting factors such as climatic and edaphic conditions, composition and abundance of species, and the successional character of these species. Here, we study the natural dynamics of a mixed forest located in central Spain, which maintained an open forest structure, due to intensive use, until grazing and cutting were banned in the 1960s. The most frequent woody species in this forest are Fagus sylvatica, Quercus petraea, Quercus pyrenaica, Ilex aquifolium, Sorbus aucuparia, Sorbus aria and Prunus avium, with contrasting shade and drought tolerance. These species are common in temperate European deciduous forest and are found here near their southern distribution limit, except for Q. pyrenaica. In order to analyze forest dynamics and composition, three inventories were carried out in 1994, 2005 and 2015. Our results show that, despite the Mediterranean influence, the natural dynamics of this forest has been mainly determined by different levels of shade tolerance. After the abandonment of grazing and cutting, Q. pyrenaica expanded rapidly due to its lower shade tolerance, whereas after canopy closure and forest densification, shade-tolerant species gained ground, particularly F. sylvatica, despite its lower drought and late-frost tolerance. If the current dynamics continue, F. sylvatica will overtake the rest of the species, which will be relegated to sites with shallow soils and steep slopes. Simultaneously, all the multi-centennial beech trees, which are undergoing a rapid mortality and decline process, will disappear.
Forests are estimated to cover 31% of the global land area, that is, 4.06 billion ha (FAO, 2020), of which nearly 2 billion ha are degraded (Minnemayer et al., 2011), needing major restoration efforts by governments and other institutions. Among the different types of restoration, passive (spontaneous) approaches, in which the only intervention is removing degrading activities to allow natural succession, are becoming increasingly common (Atkinson and Bonser, 2020). As long as there are nearby seed sources, the result of cessation of these activities generally leads to an increase in forest density until the canopy closes (Marchetti et al., 2018; Martín-Forés et al., 2020). The process of densification depends on many factors, such as the standing species distribution, their seed production, their shade tolerance, topography, climate, soil, etc. The complex interaction of these factors makes the evolution and dynamics of the forest difficult to predict.
One of the most important factors determining forest dynamics is shade tolerance. Colonizing shade-intolerant species will benefit in treeless or low-density areas. On the contrary, shade-tolerant species will benefit in areas with high competition for light and gap dynamics (McCarthy, 2001). In mixed forests, where species with different shade tolerances coexist, the dynamics in the absence of disturbance usually lead to the displacement of species with lower tolerance and the formation of nearly or completely monospecific forests, as commonly occurs in mixed beech forests (Petritan et al., 2017; Knapp and Pallardy, 2018; Rubio-Cuadrado et al., 2018). Another factor related to shade tolerance is the competitive ability of the species, i.e. the ability to maintain higher relative growth rates than other species under conditions of high competition. In this sense, beech also tends to have a higher competitive ability than the coexisting species (Hein and Dhôte, 2006; Manso et al., 2015; Rubio-Cuadrado et al., 2020a). The positive correlation between growth and vigor (Camarero et al., 2015) results in loss of vigor of species with less competitive capacity and, eventually their displacement by more competitive species.
An additional element that conditions the dynamics of densification is the adaptation of species to an ongoing rapid climate change. In southern Europe rising temperatures and increased drought, will negatively affect temperate species located at the southern limit (rear edge) of their distribution range (Hampe and Petit, 2005), favoring Mediterranean species better adapted to drier and warmer conditions (Rubio-Cuadrado et al., 2018; Perea et al., 2020). Other phenomena, like higher frequency of late frosts, can also alter the forest dynamics by shifting relative competitive abilities amongst the tree species (Sangüesa-Barreda et al., 2021; Rubio-Cuadrado et al., 2021a).
Another important factor to take into account is the regeneration capacity of the different species present prior to the cessation of the degrading activity. In this sense, the regeneration problems that some Quercus species tend to have are well known, whether due to lower seed production, high seed predation and herbivory, or competition with other plants in the understory (Shaw, 1968; Mellanby, 1968; Lorimer et al., 1994; Perea et al., 2020). This may result in these species not expanding or densifying where they are present (Marchetti et al., 2018). Soil characteristics (depth, nutrients, water retention capacity, etc.) also influence the dynamics of the forest, favoring the establishment and expansion of some species or others according to their requirements (Shibata and Nakashizuka, 1995; Masaki et al., 2005; Diaci et al., 2020). In degraded forests, loss of the fertile topsoil in eroded areas can hamper recruitment of species established prior to degradation and may be replaced by other, less demanding species.
In this work, we studied a mixed forest located in central Spain, in which seven tree species co-occur: Fagus sylvatica L., Quercus petraea (Matt.) Liebl., Quercus pyrenaica Willd., Ilex aquifolium L., Sorbus aucuparia L., Sorbus aria (L.) Crantz and Prunus avium (L.) L. The forest has been exploited since at least 1,460 for firewood and cattle grazing (Gil et al., 2009). This has resulted in an open woodland structure with scarce tree regeneration and scattered large, mature and multi-centennial trees regularly pollarded to obtain firewood. However, for conservation purposes, cattle grazing was banned in 1961 and the last logging operation was carried out in 1962 (López Santalla et al., 2003; Gil et al., 2009), favouring a rapid densification, increasing competition, and generating the current uneven-aged structure and species mixing. The forest was declared of national interest in 1974 and, together with other neighboring forests, it was declared UNESCO Biosphere Reserve since 2005. In this area, temperatures are increasing since the 1970s (Rubio-Cuadrado et al., 2020a), a trend that has been accentuated in the last decade (Rubio-Cuadrado et al., 2021a). In addition, the frequency of late-spring frosts is increasing (Sangüesa-Barreda et al., 2021). Taking into account the differences among species in shade and drought tolerance (Niinemets and Valladares, 2006), late frost susceptibility (Rubio-Cuadrado et al., 2021a), and competitive abilities (Hein and Dhôte, 2006; Manso et al., 2015), we aimed to study the effects of passive restoration on forest dynamics over the last decades. Our specific objectives were: (ⅰ) to characterize the current forest structure and composition, (ⅱ) to study the natural dynamics of the forest structure after its abandonment, (ⅲ) to identify the main structure drivers, and (ⅳ) to forecast a range of possible forest futures, including potential alterations to the current dynamics. Our hypotheses were:
H1 Due to the open forest structure at the time of the grazing and logging cessation, we expect that less shade-tolerant species (Q. petraea and especially Q. pyrenaica) initially increase their abundance until canopy closure is complete.
H2 After canopy closure, more shade-tolerant species (I. aquifolium and F. sylvatica) benefit the most, because (H2a) they are able to increase their recruitment and abundance in the juvenile classes, and (H2b) adult trees are better able to withstand increased competition with no loss of vigor and little mortality.
H3 Less drought-tolerant species, F. sylvatica and S. aucuparia, will tend to occupy higher altitudes and be more conditioned by soil depth due to ongoing climate change.
2.
Material and methods
2.1
Study site
The study site, "El Hayedo de Montejo", is a mixed forest of 125 ha located at the "Sistema Central" mountain range in central Spain (41°07′ N, 3°30′ W; Fig. S1), between 1,250 and 1,500 m above sea level (a.s.l.). The site aspect is mainly east and the dominant species are Quercus pyrenaica, Fagus sylvatica and Quercus petraea. The medium-sized deciduous trees Sorbus aucuparia, Sorbus aria and Prunus avium, and the medium-sized evergreen tree Ilex aquifolium are present to a lesser extent, and other species such as Crataegus monogyna L., Taxus baccata L., Fraxinus excelsior L., Salix ssp. or Betula ssp. are marginally present. Except for the Mediterranean Q. pyrenaica, all other species are typical of temperate European climates and are in this forest near their southwestern distribution limit, especially in the case of F. sylvatica and Q. petraea (Fig. S2). Fagus sylvatica, Q. petraea, S. aucuparia, S. aria and P. avium, as well as most individuals of Q. pyrenaica originated from natural seedling in the studied forest, in contrast with the resprouting origin of Q. pyrenaica coppice stands so abundant in Central Spain (Valbuena-Carabaña et al., 2008). Ilex aquifolium originated mainly by stem sprouting, although individuals with seed origin also occur, so that vegetative reproduction is not a problem for genetic diversity in this forest (Vega et al., 2022).
All species show moderate to high shade tolerance. The most tolerant species is F. sylvatica, followed by I. aquifolium, P. avium, S. aria, S. aucuparia, Q. petraea and Q. pyrenaica. In terms of drought tolerance, these species show moderate to low tolerance. The most drought-tolerant species is Q. pyrenaica, followed by S. aria, I. aquifolium, Q. petraea, P. avium, F. sylvatica and S. aucuparia (Table S1) (Niinemets and Valladares, 2006; Rodríguez-Calcerrada et al., 2015).
The climate is Continental-Mediterranean, with 900 mm of mean annual rainfall and a prolonged dry period during July and August. The mean annual temperature is 9.5℃ (climate data from a meteorological station located in the forest and managed by the "Functioning of Forest Systems in a Changing Environment, FORESCENT" research group of the "Universidad Politécnica de Madrid"). The soil has been classified as humic cambisol and a horizon reaches 50 cm of depth on average, enabling considerable water storage during dry periods (Pardo et al., 1997).
2.2
Forest monitoring
We recovered the first inventory carried out in the study site, which dates back to 1909 when the forest was kept as a woodland pasture for livestock grazing (de Madariaga, 1909). This inventory consisted in a full-cover inventory in which only F. sylvatica trees were measured. More recently, three forest inventories were carried out in 1994, 2005 and 2015. In each inventory, 125 circular plots were systematically distributed on a square grid of 100 m × 100 m covering the entire forest area (Fig. S3). In the 1994 inventory, a plot radius of 12.6 m was used (plot area of 500 m2) for measuring the diameter at breast height (DBH) of trees with DBH greater than 5 cm. Fagus sylvatica, Q. petraea, Q. pyrenaica, I. aquifolium, S. aucuparia, S. aria and P. avium tree number per ha and basal area were assessed. In addition, to characterize the natural regeneration of the forest, a concentric subplot of 8 m radius was located within every plot to measure plant height and plant basal diameter of the saplings, ranging from newly germinated plants up to a DBH of 5 cm.
In the 2005 inventory, the plot radius was increased to 15 m (plot area of 707 m2), for measuring DBH of all trees with a minimum threshold of 5 cm, including snags and logs. Plots, as well as live trees, snags and stumps within the plots, were georeferenced. Vigor of all trees was noted as dead, for individuals with no living buds; very decaying, for individuals structurally damaged (i.e. decapitated and/or with dried main stem branches and/or severe rot infection) but with some living branches; decaying, for individuals with generalized top drying and/or some dead main branches and/or medium pathogen infection; and vigorous or very vigorous, for individuals with few or no signs of decay. Since 2005, plots were permanent, so the plots in the second and third inventories were at the same locations.
Finally, in the 2015 inventory, the plot design was based in two concentric circles of radius 10 and 15 m. All living and dead trees with a DBH between 5 and 20 cm were measured within the small circle and all living and dead trees with DBH larger than 20 cm were measured within the larger circle. As in the 2005 inventory, the vigor of all trees was recorded using the same scale. To characterize the natural regeneration of the forest, 40 plots among those 125 plots inventoried, were randomly selected and one belt transect (20 m × 4 m) was established along the North-South diameter of the plot. Species identification, plant height and plant basal diameter were recorded for each sapling (see Perea et al., 2020). Soil depth was also measured in the 125 plots. For this purpose, a 1-m long metal bar was hammered into four points in each plot. The bar was driven until there was a noticeable increase in penetration resistance, due to the bar reaching the lower horizon, which was highly compacted, with a high proportion of silts and clays, and often with the presence of disaggregated rock derived from the shale parent rock. For each plot, altitude, slope and aspect were obtained from a Digital Terrain Model (PNOA, Instituto Geográfico Nacional, Spain) with a spatial resolution of 25 m.
Additionally, two full-cover inventories in 2009 and 2019, evaluated all trees with DBH larger than 40 cm (estimated to be centennial). In the 2009 inventory, F. sylvatica, Q. petraea and Q. pyrenaica were evaluated, but in the 2019 inventory, only F. sylvatica were considered. The location, DBH and vigor status of the trees were measured. The vigor status was classified as dead (dead trees were only counted for F. sylvatica); very decaying; decaying; vigorous, for individuals with partial top drying and/or low pathogen affection; and very vigorous, for individuals with no sign of decay.
The sampling design was modified by using different plot sizes and spatial arrangement. These changes may affect the estimation error, however, due to the relatively high sampling intensity (one plot per hectare), the inventory result can be considered representative of the actual forest composition and therefore comparisons between inventories can be considered reliable, except for low abundance and heterogeneously distributed species and DBH classes.
2.3
Statistical analysis
To analyze the natural dynamics of the forest, values of tree number per ha (N) and basal area (BA) per diameter classes were calculated for each species in each inventory. To avoid DBH classes with too few trees, an increasing diameter class size was established. A total of 8 DBH classes were established: 5–10, 10–15, 15–20, 20–30, 30–40, 40–60, 60–80 and > 80 cm. In the case of regeneration, three height classes were established: < 0.3, 0.3–1.5 and > 1.5 m.
Differences between inventories were calculated using the Mann Whitney U test for independent samples and the Wilcoxon test for related samples (specifically to compare the 2005 and 2015 inventories, since both were measured at the same points). When the frequency of zeros was high in one of the groups (i.e., a diameter or height class is not represented by any tree in a high proportion of plots in one of the inventories), the differences between groups were analyzed with hurdle models using the pscl package (Zeileis et al., 2008) in R statistical software (R Development Core Team, 2022). The hurdle regression is a two-component model: a truncated count component is employed for positive counts, and a hurdle component models zero vs. larger counts. The year of inventory has been included as the only predictor in both components of the model. A negative binomial and a binomial distribution were employed for the count and hurdle components respectively. In those cases where the negative binomial distribution was not met by data, the count component of the hurdle model was replaced by the Mann Whitney U test.
Relationships between the different RE indexes obtained (see section 2.4 below), and between the mortalities of the different species, and the influence of stand and physiography on mortality and RE indexes, were analyzed by means of Spearman correlations. Data from all plots (one value per variable and plot) from the 2015 inventory are used for this purpose.
Hurdle regression models have been fitted in order to analyze the relationship between physiographic, soil and competition variables, as predictors, and BA and regeneration of each species and total (the aggregate of all the species), as response variables. As physiographic predictors in these models, altitude, slope and aspect of each plot (the latter variable transformed by means of the cosine to obtain values between +1 and −1, corresponding to north and south, respectively), were used. In addition, average soil depth per plot, and basal area of the different species per plot, as a proxy of competition, were used as predictors. In models of regeneration, the recruitment of species other than the one considered in the response variable was also included as predictors, to take into account the possible aggregation between species. Hurdle models were selected both to correctly address the high proportion of zeros in the response variables, and to be able to independently analyze the predictors that influence the two components of the models. Within the hurdle component, the relationships between the response variables and the BA and regeneration predictors indicate aggregation or rejection relationships among species, i.e., whether the increased presence of a species increases (positive coefficient) or decreases (negative coefficient) the probability of presence of the species considered in the response variable. The sign of any one of these relationships is independent of the competition effect in the count component, since, for example, an aggregation relationship may indicate competition for space. A negative binomial and a binomial distribution were employed for the count and hurdle components, respectively. When the response variable is aggregated (as occurs for total basal area or total regeneration, which result from the sum of the values of these variables for all the species), we adjusted negative binomial generalized linear models, using the MASS package in R (Venables and Riplley, 2002), because in these cases there were a low proportion of zero values. To identify the best-supported model, we constructed all possible combinations of alternative models from the full model (including all predictors), and then selected the best model by minimizing AIC. The existence of multicollinearity among explanatory variables was evaluated by calculating the variance inflation factor (VIF) using the packages performance (Lüdecke et al., 2021), for the hurdle models, and car (Fox and Weisberg, 2011) for the negative binomial generalized linear models. We used a threshold value of 4 for VIF to avoid the collinearity among predictors (Dormann et al., 2013). The goodness of fit of the models was assessed using the R2, understood as the square of the correlation between the actual values in the plots and those predicted by the model. For the hurdle models, R2 was calculated for the count component and the percentage of correct predictions was calculated for the hurdle component.
2.4
Species Replacement Indexes
To evaluate the species dynamics, in particular the substitution of one species for a different one, we calculated the Species Replacement Indexes (REglobal; Ledo et al., 2009), which reflect the changes in species dominance based on the differences in diameter between pairs of trees belonging to the same or different species from a single inventory data. To obtain REglobal, the first step is to calculate the rglobal(Δ) function, which is based on the average conditional density (Stoyan and Stoyan, 1994). The rglobal(Δ) function averages a weighting function f(i, j), which assess the differences in composition, for all the pairs of trees i, j with a diameter difference Δ within the plot. In practice, f(i, j) is averaged over a bandwidth δ around Δ:
(1)
where n is the number of trees in a plot; Δ is the diameter difference; f(i, j) is the weighting function (that compares all pairs of trees in a plot for a given Δ), which takes value −1 when tree i (i = 1, 2, …, n) and tree j (j = i + 1) belong to the same species and 1 if the i species does not coincide with j; and the Iij (Δ ‒ δ, Δ + δ) function gives 1 if the diameter difference between tree i and j is within the (Δ ‒ δ, Δ + δ) interval or 0 if not (to include only those diameter differences that fall within the interval considered). The term Iij(Δ ‒ δ, Δ + δ) in the denominator ensures that rglobal(Δ) is unaffected by tree density within the plot. We used diameter difference intervals (Δ ‒ δ, Δ + δ) of 0.05 m width centered on Δ = 0.05, 0.10, 0.15, …, 0.80 m.
The r function can be calculated globally to assess any change in species composition (r(Δ)global) or, alternatively, it can be used to analyze the species A replacement with species B (r(Δ)A-B). In the case of r(Δ)A-B, f(i, j) takes value 1 if the tree with the smallest diameter is of the species B, and it takes value −1 when the smallest diameter is of the species A, and 0 if the pair of trees does not belong to the two considered species.
The value of the r(Δ)global function is close to −1 when, for a given Δ, we find conspecific pairs of individuals, and the value is close to 1 when trees belong to different species. In a similar way, the value of the r(Δ)A-B function is close to −1 when, for a given Δ, species A dominates among the trees with smaller diameters, and the value is close to 1 when species B dominates among the trees with smaller diameters (i.e. species B is replacing species A).
Finally, the Replacement Species Index (RE) is defined for each plot and inventory as the sum of the r(Δ) functions weighted by Δ:
where Δi is the center of the diameter difference interval i, i is the distinct diameter difference intervals present on the plot considered (normally only some of the preset intervals appear on each plot), and t is the largest diameter difference interval, which is set at 0.8 m, so that all those differences greater than 0.8 m were included in Δ = 0.8. This maximum was established to avoid giving excessive weight to larger trees, with low presence in the studied forest. We obtain the replacement index REglobal or REA-B, for r(Δ)global or r(Δ)A-B respectively. RE is not dimensionless and the result depends on the Δ units. In this study, Δ values used for weighting were measured in meters. Moreover, the absolute value of these indexes (REglobal and REA-B) increases with the width of range of diameter values in the plot.
Since the values across which these indexes move are not bounded, in order to interpret them reliably, it is necessary to analyze their evolution over time. An increasing value over time in REglobal indicates increasing different-species pairs of trees between smallest and largest diameter classes, whereas an increasing value over time in REA-B indicates that species B is becoming more abundant among the trees with smaller diameters (in the lower strata) in those areas where A was dominant. Note that REA-B = ‒ REB-A. To facilitate understanding of these indexes, some examples are provided in section 8.3 within the Supplementary Material.
3.
Results
3.1
Current forest structure
According to the inventory of 2015, F. sylvatica and Q. pyrenaica were the most abundant species, with 30% and 27% of total trees (N) and 23% and 45% of the basal area (BA), respectively (Figs. 1 and S3, Tables S2 and S3). Fagus sylvatica was the most abundant species in the lower diameter classes and the second most abundant in the upper diameter classes, while Quercus pyrenaica was the most abundant species above 20 cm of DBH. Q. petraea and I. aquifolium showed a similar abundance, ca. 18%. However, whereas Q. petraea was homogeneously distributed across all diameter classes, I. aquifolium was mostly present in DBH classes below 30 cm. Finally, S. aucuparia, P. avium and S. aria were the least abundant species, with 3.2%, 2.8% and 0.4% of N respectively, and with trees only in the lower and intermediate diameter classes (< 40 cm). While P. avium and S. aria were homogeneously distributed among these diameter classes, most individuals of S. aucuparia belonged to the 5–10 and 10–15 cm diameter classes.
Figure
1.
Stand structure in 2015 across diameter at breast height classes for all species pooled (a) and differentiating between species (b and c). Data are means (± standard error in a) for basal area (BA in m2·ha−1) and density (N in trees·ha−1). Note that standard errors are not shown in b and c to improve legibility.
In the historical inventory carried out in 1909, the density of F. sylvatica was 49.2 trees·ha−1 and the BA 9.2 m2·ha−1 (Table S4). De Madariaga (1909) expressly noted that Q. petraea and Q. pyrenaica were almost all large, old, without regeneration, and considerably less abundant than F. sylvatica. In addition, I. aquifolium was abundant at that time.
In 1994, thirty years after grazing and logging cessation, Q. pyrenaica was the most abundant species, representing 28% of the total number of trees (Table S2). The diameter distribution showed in 1994 a gradual increase in the proportion of Q. pyrenaica from the highest diameter class to the 30–40 cm diameter class, where this species represented 29% and 68% of the trees, respectively (Fig. 2 and Table S2). Below this diameter class, the trend is reversed, with an abrupt fall in the proportion of Q. pyrenaica in the lowest diameter classes, where it represents 20% of the trees. In contrast, the proportions of F. sylvatica and especially Q. petraea showed the opposite distribution along the diameter classes.
Figure
2.
Relative density across diameter at breast height classes for the different species in 1994 and in 2015. To improve the visualization of S. aria, the least abundant species, its relative density has been marked in color (dark blue); the rest of the species are represented in grayscale.
Between 1994 and 2005, there was a generalized increase in density and BA (Fig. S4 and Table S5). However, from 2005 to 2015 the increase occurred only in the intermediate diameter classes, between 15 and 40 cm, with a decrease in the number of trees in the smallest diameter class (5–10 cm), which results in an increase in basal area between these two inventories, but a stagnation in density.
The long-term census data show a shift in species-specific relative abundance towards larger diameter classes between 1994 and 2015 due to the growth of trees between inventories (Fig. 2). The most interesting changes in relative densities between species occurred at the two extremes of diameter size classes. While in 1994 the proportion of F. sylvatica, Q. petraea and Q. pyrenaica was balanced for the smallest and largest diameter classes (32%, 18% and 20% of trees of 5–10 cm DBH vs 31%, 40% and 29 % of trees > 80 cm DBH belonged to these species, respectively; Table S2), in 2015 there was a significant increase in the proportion of F. sylvatica for the smallest diameter classes and the proportion of Q. pyrenaica for the largest diameter classes (Table 1). Indeed, while Q. petraea dominated the largest diameter class according to the 1994 inventory, when 40% of the trees belonged to this species, in 2015 this proportion dropped to 18%. In contrast, Q. pyrenaica increased from 29% to 55% in this diameter class, due to the incorporation of new trees from intermediate diameter classes. In the > 80 cm DBH class, the absolute density of Q. pyrenaica steadily increased by 112% between 1994 and 2015, while F. sylvatica (−4%) stagnated, and Q. petraea (−50%) decreased sharply (Table S5). It should be noted though, that these differences may partly be due to differences between the sampled locations in the 1994 and 2015 inventories, since it was not until the 2005 inventory that the permanent plots were installed. The different location of the plots may affect the proportion of trees in higher diameter classes due to their low density and uneven distribution in the forest. This seems to be the case for Q. petraea, where a drop in density in the largest diameter class was observed from 1994 to 2005 but did not change between 2005 and 2015 (Table S2). In the case of F. sylvatica, there was an increase in density in the largest diameter class between 1994 and 2005, possibly due to differences in the sampled area, but a sharp drop in density in 2015 due to mortality. Finally, the diameter class > 80 cm for Q. pyrenaica followed the same upward trend across the three inventories.
Table
1.
Change in relative density for the seven tree species from 1994 to 2015 for each diameter class (see absolute values of relative density in Table S2). Positive values are increments in relative density and negative values are decrements.
Diameter class (cm)
F.sylvatica
Q.petraea
Q.pyrenaica
I.aquifolium
S.aucuparia
S.aria
P.avium
5–10
0.06+*
−0.03–*
0.01
0.03
–-0.06+*–x
0.000
−0.01
10–15
0.04+*
−0.08–*
0.02
−0.01
0.03+*
−0.002–*
0.00
15–20
0.12+x
0.04
−0.12
−0.07
0.00
0.001
0.03
20–30
0.09+x
0.11+x
−0.15–*+x
−0.05–*
0.00
−0.005
−0.01
30–40
0.05+x
0.16+x
−0.15–*+x
−0.05–*
0.00
0.007
−0.01
40–60
−0.04
0.06+x
0.01+x
−0.01
−0.01
0.000
0.00
60–80
0.00
−0.11
0.12+x
0.01
0.00
0.000
−0.02
> 80
−0.04
−0.22
0.26+x
0.00
0.00
0.000
0.00
Asterisks (*) indicate significant differences using Mann Whitney U test for the values larger than zero and symbols (X) indicate significant differences in the hurdle component of the hurdle regression (zero vs. larger values). Symbol (+) indicates greater presence (that is, a lower proportion of zeros) or greater relative density of the species considered (without considering the zeros), depending on the test considered. Symbol (−) indicates the opposite. When p-value is between 0.05 and 0.1 the asterisk/symbols has been underlined; otherwise p-value is less than 0.05.
The relative density of big I. aquifolium trees decreased from 1994 to 2015 (Table 1). While in 1994 its relative density represented 19% and 12% of the trees in the diameter classes 20–30 and 30–40 cm, respectively; in 2015, it represented 14% and 8%, respectively, reflecting an increase in density over time lower than that of other species (Table S5). However, this species showed the second highest increase (after F. sylvatica) in relative density for the 5–10 cm DBH class. Sorbus aucuparia displayed a decrease in absolute (Table S5) and relative density (Table 1) in the smallest diameter class. In contrast, there was a significant increase in the relative density of S. aucuparia for the diameter class 10–15 cm, with the rest of the diameter classes remaining unchanged. Sorbus aria showed a decrease in relative density for diameter class 10–15 cm (Table 1), although in absolute terms density in S. aria increased (Table S5). Finally, P. avium showed no significant changes in relative density. Fagus sylvatica, I. aquifolium and S. aria were the only species that showed significant increases in (absolute) density in the smallest diameter class (5–10 cm; Table S5).
The replacement index (RE) values obtained from the 1994 inventory data showed a very similar species composition between the largest and smallest DBH. However, already in this year REQ. pyrenaica–F. sylvatica showed a higher proportion of F. sylvatica among the trees with small diameter (Table 2). In the 2005 inventory a clear differentiation of species according to the diameter class was observed, a trend that was more evident in the 2015 inventory. Fagus sylvatica was replacing Q. pyrenaica and, to a lesser extent, Q. petraea in stands where they were mixed. Quercus petraea was also replacing Q. pyrenaica where they grew together.
Table
2.
Average values of replacement indexes for each of the three inventories. REglobal and REA-B are the replacement indexes, calculated globally for all species or directed to analyze the replacement between two species, respectively. Only the three dominant species were considered (Fagus sylvatica, Quercus petraea and Q. pyrenaica).
In the 2015 inventory, four species showed a significant increase in density of recruits (compared to 1994; Fig. 3 and Table S6). Fagus sylvatica was the species with the highest density of regeneration (1,125 saplings·ha−1 considering the three types of regeneration together), and had increased its presence by 70% since 1994; Q. petraea, with 653 saplings per ha, increased by 150%; I. aquifolium, with 369 saplings per ha, increased 24%; and S. aria, with 38 saplings per ha, increased 64%. In contrast, Q. pyrenaica, with 459 saplings per ha, lost 52% saplings since 1994, when it was the species with most recruits; and S. aucuparia, with 66 saplings per ha, also decreased ca. 36%. Prunus avium had 347 saplings per ha, showing no variation since 1994. Considering only the largest height class, which is the most likely to survive the competition and growth up to the canopy, F. sylvatica represented 78% of the saplings, followed by Q. pyrenaica (12%), I. aquifolium (6%) and Q. petraea (4%) (Fig. 3d).
Figure
3.
Sapling density of the different species in 2015 for each of the three height classes considered (a; saplings·ha−1), total sapling density (without differentiating between species) in 1994 and 2015 for each of the height classes considered (b; saplings·ha−1; mean ± standard error; asterisks indicate significant differences between years using Mann Whitney U test), and relative density in 1994 (c panel) and 2015 (d panel) for each of the height classes considered. Note that standard errors are not shown in panel a to increase legibility.
Fagus sylvatica showed a low mortality in DBH classes below 40 cm, and > 10% above this diameter class, reaching 37% for the largest diameter class (Table 3; note that the comparison was only between the 2005 and 2015 inventories, as the same permanent plots were measured in both years). On the contrary, Q. pyrenaica showed low mortality in diameter classes larger than 20 cm, but high mortality in the lower diameter classes, especially for the 5–10 cm diameter class. Quercus petraea is the species that showed, together with S. aria, the lowest mortality, being only important in the smallest diameter class. Ilex aquifolium and, especially, S. aucuparia and P. avium showed high levels of mortality in practically all diameter classes.
Table
3.
Density of trees dead in 2015 that were alive in 2005 (in trees·ha−1), for each diameter class and species. Diameters correspond to those measured in 2005. The percentage of dead to total trees inventoried for each diameter class and species in 2005 is shown in parentheses. Dashes indicate that there were no inventoried individuals of a given diameter in 2005.
All species, except for I. aquifolium and S. aria, showed a decrease in vigor in the lowest diameter classes (Fig. 4; note that this figure considers vigor and mortality in both 2005 and 2015). In the rest of the diameter classes, large differences were found among species. Fagus sylvatica showed a significant drop in vigor in upper diameter classes. While the number of very vigorous trees of F. sylvatica decreased by 9.5% in the full-cover inventory, and the number of vigorous trees decreased by 34.2%, the number of very decaying trees increased by 64.1% and mortality was close to 10%, reaching 14.4% for trees of F. sylvatica over 80 cm DBH (Table S7). On the contrary Q. petraea showed only slight (but significant; Fig. 4) declines in vigor below 20 cm DBH. Quercus pyrenaica showed the greatest loss of vigor, being generalized for all DBH classes, except for the highest (> 80 cm; Fig. 4). Ilex aquifolium showed considerable mortality in both 2005 and 2015 (Fig. 4), with significant increases in the intermediate diameter classes. Sorbus aucuparia and P. avium also showed declines in vigor in the intermediate diameter classes, although not significant due to the scarce presence of these species for these sizes.
Figure
4.
Proportion of trees in each of the vigor classes considered in 2005 (left column of each pair) and 2015 (right column), for each species and diameter class. Asterisks indicate significant decreases in vigor in 2015 with respect to 2005 (significant decreases in the proportion of vigorous trees and/or significant increases in the proportion of decaying, very decaying, or dead trees). The analyses were performed with the Wilcoxon test, independently for each combination of diameter class, vigor level, and species, considering, in each analysis, only those plots with presence of trees in the corresponding combination. In the 2005 inventory all dead trees were counted, whether standing, fallen or with only the stump remaining, while in the 2015 inventory only those trees that were still alive in 2005 were counted as dead.
3.5
Factors affecting species distribution and dynamics (H3)
Basal area of each species was inversely related to the BA of the rest of species, especially in the case of F. sylvatica, Q. petraea and Q. pyrenaica, as a result of competition for space (count component in Table 4). In the case of I. aquifolium and P. avium, the only species that competes with them for space was Q. pyrenaica (Table 4). Fagus sylvatica and Q. pyrenaica showed a rejection relationship with each other, while F. sylvatica showed a tendency to aggregate with Q. petraea (hurdle component in Table 4). Also I. aquifolium showed a tendency to aggregate with F. sylvatica and Q. petraea, while S. aucuparia showed rejection with F. sylvatica and Q. pyrenaica. Finally, BAother (result of the sum of the BA of I. aquifolium, S. aucuparia, S. aria, P. avium and other species with lesser presence in the forest) was directly related to the probability of occurrence of F. sylvatica, Q. petraea and P. avium (excluding P. avium from BAother when fitting P. avium model). The absence of predictors in the S. aria model cannot be interpreted as independence with respect to the variables considered; rather, it reflects the low abundance of the species.
Table
4.
Coefficients and standard errors (in parentheses) of the hurdle regressions for the best models of basal area as depending on the different physiographic, soil and forest predictors. The models were obtained for the different species based on the data of the 2015 inventory. Top and bottom panels show the count and hurdle components of the hurdle regressions, respectively. Significance levels: · P < 0.10, *P < 0.05, **P < 0.01 and ***P < 0.001, respectively.
Basal area. Count componenta
F.sylvatica
Q.petraea
Q.pyrenaica
I.aquifolium
S.aucuparia
S.aria
P.avium
All speciesb
BAF.sylvaticac
−0.35 (0.16)*
−0.24 (0.08)**
BAQ.petraeac
−0.28 (0.14)*
−0.31 (0.13)*
BAQ.pyrenaicac
−0.79 (0.17)***
−0.66 (0.18)***
−0.65 (0.22)**
−1.16 (0.61)·
Altitude
−0.58 (0.20)**
−0.36 (0.09)***
−0.16 (0.06)**
Slope
1.03 (0.27)***
0.85 (0.42)*
Aspect
Soil depth
0.32 (0.14)*
0.96 (0.43)*
0.19 (0.06)**
R2
0.42
0.14
0.37
0.47
0.31
–
0.17
0.11
Basal area. Hurdle (zero) componenta
F.sylvatica
Q.petraea
Q.pyrenaica
I.aquifolium
S.aucuparia
S.aria
P.avium
BAF.sylvaticac
−1.29 (0.32)***
0.39 (0.21)·
−1.38 (0.82)·
BAQ.petraeac
0.78 (0.33)*
0.86 (0.25)***
BAQ.pyrenaicac
−0.77 (0.27)**
−1.56 (0.74)*
BAotherc
0.43 (0.26)·
0.62 (0.27)*
0.43 (0.22)·
Altitude
−1.21 (0.3)***
0.92 (0.23)***
−2.63 (0.49)***
Slope
−0.35 (0.21)·
0.38 (0.21)·
Aspect
0.84 (0.33)*
Soil depth
0.37 (0.22)·
0.58 (0.24)*
% correct
79
71
83
73
86
–
67
a Predictors were standardized previously to fit the models. Note that positive coefficients in the hurdle component indicate that an increase in the factor increases the probability of a non-zero count. The goodness of fit of the model is shown by the R2 in the count component and the percentage of correct predictions in the hurdle component. b For the total basal area (considering all species) a negative binomial generalized linear model, instead of the hurdle model, was fitted due to the low proportion of plots where the response variable takes a value of 0. c BA is the basal area of the different species, with BAother being the total BA of the least abundant species (I.aquifolium, S.aucuparia, S.aria, P.avium and other species with lesser presence in the forest, but excluding, when apply, the species that correspond to the response variable, i.e., if the response variable is BAI.aquifolium, then BAother results from the sum of the basal areas of S.aucuparia, S.aria, P.avium and the other species with lesser presence in the forest).
Fagus sylvatica and Q. pyrenaica were more abundant at lower elevations (Table 4) whereas Q. petraea mostly appeared at higher elevations. Slope had a positive direct relationship with the BA of I. aquifolium and S. aucuparia, but negative with F. sylvatica. Aspect was only related to Q. pyrenaica, a species that appears mostly in the northern orientation, contrary to what was expected since this is the most Mediterranean species in the forest. Finally, deeper soils were directly related to a greater presence of F. sylvatica, I. aquifolium and P. avium.
The occurrence and abundance of saplings taller than 1.5 m of the most shade tolerant species, F. sylvatica, I. aquifolium and P. avium, showed a positive relationship with the presence of the conspecific species, even if there is high competition (Table S8). Regeneration of the less shade-tolerant species did not occur or did not thrive under the conspecific canopy. In addition, there was an inverse relationship in the hurdle component between Q. pyrenaica regeneration and BA of F. sylvatica (i.e., the presence of F. sylvatica inhibits the occurrence of Q. pyrenaica regeneration). Altitude had a similar effect on the regeneration models as on the BA models, except for the case of F. sylvatica which, although present to a greater extent at lower elevations (Table 4), regenerated more at higher elevations (Table S8), indicating an expansion of beech towards higher altitudes. Regarding the other physiographic variables, slope was inversely related to the abundance of F. sylvatica regeneration, and the north-facing slope was positively related to the abundance of F. sylvatica and Q. petraea regeneration and to the presence of I. aquifolium. Counterintuitively, soil depth was inversely related to the abundance or presence of F. sylvatica, Q. petraea and S. aria regeneration (Table S8).
Mortality was related to increased competition, especially from the same species (Table S9). In areas with F. sylvatica, the high presence of species other than F. sylvatica reduces F. sylvatica mortality (Table S9). In general, mortality is lower in northerly aspects, in sites with deep soils, high altitudes and shallow slopes (Table S9).
In general, species replacement was favored in areas with higher competition and deep soils (see REglobal results in Table S10). Particularly, the replacement of Q. pyrenaica by F. sylvatica is favored by increased competition, whether of Q. pyrenaica or F. sylvatica (Table S10). However, high densities of Q. petraea and Q. pyrenaica in a given stand may delay their replacement by F. sylvatica and Q. petraea, respectively (Table S10).
4.
Discussion
4.1
Forest densification and expansion of Quercus pyrenaica (H1)
At the end of the 1950s, the forest had an open structure over most of its area (Fig. S5), similar to the structure in 1909 (de Madariaga, 1909). After the prohibition of grazing, a densification of the forest took place (Figs. S3 and S4), from which Q. pyrenaica specially benefited. While in 1909 the most abundant species was F. sylvatica, in 1994 the most abundant species was Q. pyrenaica, with 28% of the trees and 42% of the basal area (Tables S2 and S3). The results of the full-cover inventory conducted in 2009 followed the same lines, and almost half of the trees were F. sylvatica (45%), even more so if we take into account the large number of dead trees of this species (see foot of Table S7). In this inventory, all trees of F. sylvatica, Q. petraea and Q. pyrenaica larger than 40 cm were sampled. Based on a previous study conducted at the same site and in which dominant trees were bored, it can be assumed that trees with DBH greater than 40 cm were generally established prior to 1961 (Rubio-Cuadrado et al., 2020a; see data used in Rubio-Cuadrado et al., 2020b). Therefore, we can consider this inventory of 2009 as an estimate of the abundance of these species prior to 1961.
The methodological differences between the inventories and the heterogeneous distribution of species in the forest (Fig. S3) make comparisons between inventories somewhat imprecise. However, this does not affect the interpretation of the trends found. Effectively, considering only the 1994 inventory, a gradual increase in the proportion of Q. pyrenaica is shown from the largest diameter class to the 30–40 cm diameter class, indicating an expansion of this species (Fig. 2). However, this trend is blurred in the 2015 inventory due to the mortality suffered by F. sylvatica in the higher diameter classes (Table 3 and Table S7).
Once grazing was banned, the open forest structure benefited Q. pyrenaica, the species with the lowest shade tolerance and higher light requirements of seedlings (Niinemets and Valladares, 2006; Rodríguez-Calcerrada et al., 2007, 2010). The light requirements of regeneration in this species leads to episodic expansion processes in open forest or in treeless areas, forming unimodal age cohorts, with tree recruitment decreasing drastically as the canopy closes (Camisón et al., 2015). In contrast, we found no evidence that Q. petraea, the second species present in the study area with the lowest shade tolerance, expanded after grazing ceased. In fact, its proportion remains more or less constant across all diameter classes (Fig. 2), which would indicate a constant and low level of recruitment, probably due to the higher water and nutrient requirements of Q. petraea saplings, in addition to differences in shade tolerance (Rodríguez-Calcerrada et al., 2008).
4.2
High competitiveness and expansion of Fagus sylvatica (H2)
After canopy closure, the stand continued to densify until 2005, when the excess of competition leads to density stabilization (Fig. S4a) due to the balance between regeneration and mortality (Yaussy et al., 2013). At this point, the most competitive and shade-tolerant species, especially F. sylvatica (Manso et al., 2015; Table S1), out-persisted the rest of species. In temperate forests with full canopy, small forest gaps are filled with shade tolerant species that, either established and persisted as advance regeneration in the understory and regain growth as competition was released (Fig. 3; McCarthy, 2001), or colonize rapidly the small gaps created. In the studied forest, the RE index shows that during the first decades after the grazing ban, the same species present in the upper canopy regenerated under and around the adult trees (values close to zero for 1994 in Table 2). However, after stand densification, the more shade-tolerant species took advantage and regenerated under the canopy of the more intolerant species (see values for 2015 in Table 2), as shown by the increasing density in the lower diameter classes of F. sylvatica, I. aquifolium and S. aria, between 1994 and 2015 (Table S5). However, for I. aquifolium this increase was not reflected in the intermediate and upper diameter classes due to mortality (Table 3), probably caused by competition, although the influence of other factors, such as pests, could not be discarded (Castillo et al., 2009; McGregor et al., 2016). The relative density of F. sylvatica increased in all diameter classes below 40 cm (Table 1) and it is expected that in the future it will also increase in the higher diameter classes as the trees grow (Fig. 2). Increasing dominance of F. sylvatica would not be surprising in mixed beech-oak forests of central Europe (Petritan et al., 2014), but it was less expected in this rear-edge population, where summer drought is recurrent and occasionally severe. Fagus sylvatica is spreading in Central Spain despite being a species more sensitive to drought (Aranda et al., 2000, 2005; Piovesan et al., 2008) and late frosts (Rubio-Cuadrado et al., 2021b, 2021a) than oaks (Q. petraea and Q. pyrenaica) with which it competes, showing that the greater tolerance to low light of F. sylvatica is the determining factor explaining its dynamics in this forest (Rubio-Cuadrado et al., 2020a; de Tomás Marín et al., 2023). There are other factors that may also contribute to F. sylvatica expansion, such as the rapid growth in height of its saplings, which allows them to outgrow the saplings of the other species with which they compete and thus "win" the competition for light (Ligot et al., 2013; Van Couwenberghe et al., 2013), or the increasing populations of wild herbivores, preferring Quercus, Sorbus and Prunus over Fagus for browsing (Perea et al., 2020; Carpio et al., 2021).
The inventories showed a long-term decline of S. aucuparia, P. avium and Q. pyrenaica, and a stagnation of Q. petraea. The species with greater basal area is currently Q. pyrenaica; however, since 1994, it declined in relative density, especially in the lower-intermediate diameter classes (Fig. 2), pointing to lower establishment and loss of vigor (Figs. 3 and 4; see also Petritan et al., 2014). Sorbus aucuparia, P. avium and Q. petraea showed increases in density in the intermediate diameter classes, but decreases in the upper (in S. aucuparia and P. avium but not in Q. petraea; see differences between 2005 and 2015 in Table S2) and lower diameter classes (Table S5), with high mortality rates in S. aucuparia and P. avium (Table 3). Again, this is possibly related to increased competition, relatively low shade tolerance of these species (Table S1), and their progressive competitive exclusion by F. sylvatica and other trees dominating the canopy.
4.3
Factors influencing stand structure and dynamics (H3)
The most important factor determining the dynamics in the studied forest is the shade tolerance of the species, as shown by the expansion of the shade intolerant Q. pyrenaica when grazing was banned and the later expansion of the shade tolerant species, specially F. sylvatica, as canopy closed. Among the other secondary factors that influence the stand dynamic and structure, soil depth, slope and altitude stand out. Species distributions may be strongly driven by soil conditions (Diekmann et al., 2015; Walthert and Meier, 2017). In the studied forest, due to the relationship between soil depth, slope and water holding capacity and between climate and altitude, the less drought tolerant species, especially F. sylvatica, were more abundant and/or regenerated better in areas with gentle slopes, northerly aspects, deep soils and high altitude (Table 4, Tables S8 and S9; de Tomás Marín et al., 2023). Therefore, where these conditions are met, the replacement of less shade tolerant species with more shade tolerant species was accelerated (Table S10).
Ilex aquifolium tends to appear mixed with F. sylvatica and Q. petraea and, to a lesser extent, with P. avium (Table 4; note that I. aquifolium is, among the species included in the BAother variable, the most abundant, with the greatest BA, and therefore, with the largest weight in this variable). This is probably the result of facilitation between species, an effect already noted for I. aquifolium, whose seeds are dispersed by birds perching on trees and herbivores searching refuge under the canopy (Arrieta and Suárez, 2001, 2005).
Historical management is another important factor in explaining stand structure and dynamics. Fagus sylvatica is the dominant species with the highest mortality and loss of vigor in all the upper diameter classes (above 40 cm; Table 3 and Table S7). Indeed, de Madariaga (1909) counted 2,384 F. sylvatica trees over 40 cm DBH, most of which were > 70 cm DBH (Table S4), while in 2009 only 546 F. sylvatica trees over 40 DBH were counted. This situation could be explained by old age itself and, besides, traditional tree uses, as pruning, pollarding and topping for decades [potentially centuries (Pardo and Gil, 2005)] and competition from their own recruits. Nowadays, these centennial trees often show stem rots and symptoms of decay.
Regarding drought sensitivity, one may think that, being F. sylvatica the most sensitive species of the studied forest and being this forest at the meridional limit of the distribution of F. sylvatica, this species would grow under limiting climatic conditions and would suffer from low resilience and high mortality. This is what occurs in fir (Abies alba) forests and in some Scots pine populations located in their southernmost distribution limit (Oliva and Colinas, 2007; Giuggiola et al., 2010; Gazol et al., 2020). However, previous studies carried out in the same forest on trees established after the cessation of grazing, have shown higher vigor of F. sylvatica than other coexisting dominant species (Rubio-Cuadrado et al., 2020a), possibly due to drought adaptations specific to this F. sylvatica population (Aranda et al., 2015). This result is consistent with current expansion of F. sylvatica in other Spanish populations (Sánchez de Dios et al., 2016, 2020) and the high resilience found at the southern distribution limit of the species (Tegel et al., 2014; Cavin and Jump, 2017; Muffler et al., 2020). Collectively, these results do not corroborate the hypothesis that F. sylvatica grows under limiting conditions in rear edge (warm, drought-prone) populations.
4.4
The forest in the future – F. sylvatica will likely continue spreading in the absence of severe perturbations
The increasing dominance of F. sylvatica, which is the only species with effective regeneration (Fig. 3 and Table S6) and will progressively outcompete other species (Table 2), points to lower species diversity in the future. This advance regeneration will reach the canopy when competition release occurs, mostly when small canopy gaps open (McCarthy, 2001). This expansion of F. sylvatica at the expense of the rest of the species will likely occur in areas with gentle slope and deep soil, as well as at low altitudes, where this species is most abundant (Table 4), but also at higher elevations (Table S8), where F. sylvatica is expected to replace progressively the other species (mainly Q. pyrenaica; Table 2), either due to better climatic conditions or to the lesser competition of these species.
Quercus petraea is, among the dominant species, the only one with low mortality, except in the lower diameter class (Table 3) where it shows a loss of vigor and a decrease in density, both in absolute and relative terms (Table 1, Table S5 and Fig. 4). Its lower regeneration capacity under conditions of high competition (Fig. 3), and its higher browsing sensitivity (Perea et al., 2020), will lead to its decline in the long term, as has been described in other stands throughout Europe where this species is mixed with F. sylvatica (Petritan et al., 2017; Rubio-Cuadrado et al., 2018).
Under the Q. pyrenaica dominant stratum often appears F. sylvatica and, to a lesser extent, Q. petraea (Table S2), even in those sites with high basal areas of Q. pyrenaica (Table S10). In addition, Q. pyrenaica has suffered a loss of vigor in all diameter classes (Fig. 4). Although Q. pyrenaica is able to regenerate effectively in situations of moderate competition (Gea-Izquierdo et al., 2015), it has undergone a loss of weight in the lower diameter classes with respect to F. sylvatica and Q. petraea (Fig. 2), a decrease that will be transferred to the intermediate diameter classes in the short and medium term.
The tendency of I. aquifolium to appear mixed with F. sylvatica could lead to an expansion of I. aquifolium together with F. sylvatica (Table 4); however, I. aquifolium rarely reaches the intermediate and higher diameter classes due to its relative small size at maturity and its low growth rate (Rodríguez-Calcerrada et al., 2019), which, along with its high mortality (Table 3), led to a relative loss of weight in these diameter classes (Table 1). Apart from that, I. aquifolium can form very dense, monospecific patches of undergrowth, as in fact occurs in some parts of the study area (Vega et al., 2022), where high competition for light prevents other species from regenerating (Arrieta and Suárez, 2001).
Sorbus aucuparia and P. avium, similar to Q. pyrenaica, will gradually lose importance due to their lower recruitment (Fig. 3) and high mortality (Table 3). In the long term, Q. pyrenaica, S. aucuparia, P. avium and, to a lesser extent, Q. petraea, will be confined to areas with shallow soils and steeper slopes. The heterogeneous distribution of species throughout the forest (Fig. S3) and the high longevity of the dominant species will prevent F. sylvatica from dominating the entire forest in the medium term. However, in the absence of disturbances or drastic climatic changes, F. sylvatica will eventually dominate in the long term. The higher sensitivity of F. sylvatica to drought and late frosts, together with the increasing frequency of these climatic events, may lead to a loss of resilience of the forest, as already observed in the higher diameter classes (Table 3 and Table S7), more affected by senescence and anthropic uses. Analyses of forest dynamics in areas with high past anthropogenic pressure are essential, considering that forest resilience is not necessarily linked to the natural dynamics of the ecosystem (Buma and Wessman, 2013). In our case, if the aim is to maintain the current mix of species in the forest, forest management will have to favor the regeneration of the species that are currently declining and facilitate the growth of these species in the understory. On the other hand, managers will have to reduce competition on the singular, centennial trees that may see their vigor reduced and die if the competition continues to increase. Anyway, further studies are needed to study the causes behind the mortality of F. sylvatica trees in the higher diameter classes.
5.
Conclusions
The study site is a mixed forest formed mostly by species typical of temperate European climates that are found here near their lower latitude (rear edge) end of the species distribution. However, the location of the forest in an area of Mediterranean influence does not seem to determine its dynamics, with drought resistance being apparently a minor factor influencing the developmental trajectory of the forest. On the contrary, it is the successional character of the species, their relative capacity to endure low-light conditions and compete when overtopped by mature trees, that seems to strongly determine the dynamics of the forest. The results showed that the abandonment of grazing and cutting benefitted the expansion of Q. pyrenaica, thanks to the lower light sensitivity of their recruits. However, once the stand densified, more shade-tolerant species, especially F. sylvatica, outcompeted the others and regenerated more successfully. If this pattern of forest dynamics continues, F. sylvatica will gradually overcome the rest of species, which will be confined to areas with shallow soils and steeper slopes. Mature, multi-centennial individuals of F. sylvatica will likely disappear soon due to the special conditions of low density and intense management in which they grew.
The authors declare that they have no known competing financial interests or personal relationships that could have appeared to influence the work reported in this paper.
Iciar Alberdi and Isabel Cañellas report financial support provided by Horizon Europe. María Valbuena Carabaña and Luis Gil report financial support provided by Community of Madrid, Spain. Ramon Perea reports financial support provided by Community of Madrid, Spain. Rosana Lopez, Jesús Rodríguez Calcerrada and Álvaro Rubio Cuadrado report financial support provided by Spanish Ministry of Science and Innovation, Spain. Ramon Perea reports financial support was provided by Spanish Ministry of Science and Innovation, Spain.
Funding and Acknowledgments
IA and IC acknowledges support by project SUPERB H2020 (Systemic solutions for upscaling of urgent ecosystem restoration for forest related biodiversity and ecosystem services). MVC and LG acknowledges support by project P2013/MAE-2760 (Autonomous Community of Madrid). RL, JRC, ARC, acknowledges support by project PID2019-107256RB-I00 (Spanish Ministry of Science and Innovation) and project FAGUS by the Comunidad de Madrid through the call Research Grants for Young Investigators from Universidad Politécnica de Madrid. RP acknowledges support by projects 9OHUU0-10-3L226X (Autonomous Community of Madrid), RTI2018-094202-BC21 and RTI2018-094202-A-C22 (Spanish Ministry of Science and Innovation).
Aldea, J., Bravo, F., Bravo-Oviedo, A., Ruiz-Peinado, R., Rodríguez, F., del Río, M., 2017. Thinning enhances the species-specific radial increment response to drought in Mediterranean pine-oak stands. Agric. For. Meteorol. 237-238, 371-383. .
Aranda, I., Gil, L., Pardos, J.A., 2000. Water relations and gas exchange in Fagus sylvatica L. and Quercus petraea (Mattuschka) Liebl. in a mixed stand at their southern limit of distribution in Europe. Trees (Berl.) 14, 344-352. .
Aranda, I., Gil, L., Pardos, J.A., 2005. Seasonal changes in apparent hydraulic conductance and their implications for water use of European beech (Fagus sylvatica L.) and sessile oak [Quercus petraea (Matt.) Liebl] in South Europe. Plant Ecol. 179, 155-167. .
Aranda, I., Cano, F.J., Gasco, A., Cochard, H., Nardini, A., Mancha, J.A., López, R., Sánchez-Gómez, D., 2015. Variation in photosynthetic performance and hydraulic architecture across European beech (Fagus sylvatica L.) populations supports the case for local adaptation to water stress. Tree Physiol. 35, 34-46. .
Arrieta, S., Suárez, F., 2001. Seedling diversity and spatially related regeneration dynamics in holly woodlands and surrounding habitats. Web. Ecol. 2, 38-46. .
Arrieta, S., Suárez, F., 2005. Spatial dynamics of Ilex aquifolium populations seed dispersal and seed bank: Understanding the first steps of regeneration. Plant Ecol. 177, 237-248. .
Atkinson, J., Bonser, S.P. 2020. "Active" and "passive" ecological restoration strategies in meta-analysis. Restor. Ecol. 28, 1032-1035. .
Bravo, J.A., Roig, S., Serrada, R., 2008. Selvicultura en montes bajos y medios de Q. ilex L. Q. pyrenaica Willd. y Q. faginea Lam. In: Serrada, R., Montero, G., Reque, J.A. (Eds.), Compendio de Selvicultura Aplicada en España. INIA, Madrid, Spain.
Buma, B., Wessman, C.A., 2013. Forest resilience, climate change, and opportunities for adaptation: A specific case of a general problem. For. Ecol. Manag. 306, 216-225. .
Camarero, J.J., Gazol, A., Sangüesa-Barreda, G., et al., 2015. To die or not to die: early warnings of tree dieback in response to a severe drought. J. Ecol. 103, 44-57. .
Camisón, Á., Miguel, R., Marcos, J.L., Revilla, J., Tardáguila, M.A., Hernández, D., Lakicevic, M., Jovellar, L.C., Silla, F., 2015. Regeneration dynamics of Quercus pyrenaica Willd: In the Central System (Spain). For. Ecol. Manag. 343, 42-52. .
Cañellas, I., Del Río, M., Roig, S., Montero, G., 2004. Growth response to thinning in Quercus pyrenaica Willd. coppice stands in Spanish central mountain. Ann. For. Sci. 61, 243-250. .
Carpio, A.J., Apollonio, M., Acevedo, P., 2021. Wild ungulate overabundance in Europe: contexts, causes, monitoring and management recommendations. Mamm. Rev. 51, 95-108. .
Castillo, P., Vovlas, N., Troccoli, A., Liébanas, G., Rius, J.E.P., Landa, B.B., 2009. A new root-knot nematode, Meloidogyne silvestris n. sp. (Nematoda: Meloidogynidae), parasitizing European holly in northern Spain. Plant Pathol. 58, 606-619. .
Cavin, L., Jump, A.S., 2017. Highest drought sensitivity and lowest resistance to growth suppression are found in the range core of the tree Fagus sylvatica L. not the equatorial range edge. Glob. Chang. Biol. 23, 362-379. .
de Madariaga, J. Á., 1909. El hayedo más meridional. Rev. Montes. 788, 769-775.
de Tomás Marín, S., Rodríguez-Calcerrada, J., Arenas-Castro, S., Prieto, I., González, G., Gil, L., de la Riva, E.G., 2023. Fagus sylvatica and Quercus pyrenaica: Two neighbors with few things in common. For. Ecosyst. 10, 100097. .
Diaci, J., Rozman, J., Rozman, A., 2020. Regeneration gap and microsite niche partitioning in a high alpine forest: Are Norway spruce seedlings more drought-tolerant than beech seedlings? For. Ecol. Manag. 455, 117688. .
Diekmann, M., Michaelis, J., Pannek, A., 2015. Know your limits - The need for better data on species responses to soil variables. Basic Appl. Ecol. 16, 563-572.
Dormann, C.F., Elith, J., Bacher, S., Buchmann, C., Carl, G., Carré, G., Marquéz, J.R.G., Gruber, B., Lafourcade, B., Leitao, P.J., Münkemüller, T., McClean, C., Osborne, P.E., Reineking, B., Schröder, B., Skidmore, A.K., Zurell, D., Lautenbach, S., 2013. Collinearity: a review of methods to deal with it and a simulation study evaluating their performance. Ecography 36, 27-46. .
FAO, 2020. Global forest resources assessment 2020. Main report. Rome, Italy.
Fox, J., Weisberg, S., 2011. An R Companion to Applied Regression, Second. SAGE Publications, Inc, Thousand Oaks, USA.
Gazol, A., Sangüesa-Barreda, G., Camarero, J.J., 2020. Forecasting forest vulnerability to drought in Pyrenean silver fir forests showing dieback. Front. For. Glob. Chang. 3, 36. .
Gea-Izquierdo, G., Montes, F., Gavilán, R.G., Cañellas, I., Rubio, A., 2015. Is this the end? Dynamics of a relict stand from pervasively deforested ancient Iberian pine forests. Eur. J. For. Res. 134, 525-536. .
Gil, L., Náager, J.A., Aranda, G.I., Doncel, I.G., Jimenez, J.G., Heredia, U.L., Milleron, M., Nanos, N., Garcia-Calvo, R.P.G., Calcerrada, J.R., Carabana, M.V., 2009. El Hayedo de Montejo: una gestión sostenible. Comunidad de Madrid, Madrid, España.
Giuggiola, A., Kuster, T.M., Saha, S., 2010. Drought-induced mortality of Scots pines at the southern limits of its distribution in Europe: Causes and consequences. IForest 3, 95-97.
Hampe, A., Petit, R.J., 2005. Conserving biodiversity under climate change: the rear edge matters. Ecol. Lett. 8, 461-467. .
Hein, S., Dhôte, J. -F., 2006. Effect of species composition, stand density and site index on the basal area increment of oak trees (Quercus sp.) in mixed stands with beech (Fagus sylvatica L.) in northern France. Ann. For. Sci. 63, 457-467. .
Knapp, B.O., Pallardy, S.G., 2018. Forty-eight years of forest succession: tree species change across four forest types in mid-Missouri. Forests 9, 633. .
Ledo, A., Montes, F., Condes, S., 2009. Species dynamics in a montane cloud forest: Identifying factors involved in changes in tree diversity and functional characteristics. For. Ecol. Manag. 258, S75-S84. .
Ligot, G., Balandier, P., Fayolle, A., Lejeune, P., Claessens, H., 2013. Height competition between Quercus petraea and Fagus sylvatica natural regeneration in mixed and uneven-aged stands. For. Ecol. Manag. 304, 391-398. .
López Santalla, A., Pardo Navarro, F., Alonso Náger, J., Gil Sánchez, L., 2003. El aprovechamiento tradicional del monte y sus efectos sobre la vegetacion en el Hayedo de Montejo (Madrid). Cuad. Soc. Esp. Cien. For. 16, 109-114.
Lorimer, C.G., Chapman, J.W., Lambert, W.D., 1994. Tall understorey vegetation as a factor in the poor development of oak seedlings beneath mature stands. J. Ecol. 82, 227. .
Lüdecke, D., Ben-Shachar, M.S., Patil, I., Philip, W., Makowshi, D., 2021. performance: an R package for assessment, comparison and testing of statistical models. J. Open Source Softw. 1, 3139. .
Manso, R., Morneau, F., Ningre, F., Fortin, M., 2015. Effect of climate and intra- and inter-specific competition on diameter increment in beech and oak stands. Forestry 88, 540-551. .
Marchetti, M., Vizzarri, M., Sallustio, L., di Cristofaro, M., Lasserre, B., Lombardi, F., Giancola, C., Perone, A., Simpatico, A., Santopuoli, G., 2018. Behind forest cover changes: is natural regrowth supporting landscape restoration? Findings from Central Italy. Plant Biosyst. 152, 524-535. .
Martín-Forés, I., Magro, S., Bravo-Oviedo, A., Alfaro-Sánchez, R., Espelta, J.M., Frei, T., Valdés-Correcher, E., Rodríguez Fernández-Blanco, C., Winkel, G., Gerzabek, G., González-Martínez, S.C., Hampe, A., Valladares, F., 2020. Spontaneous forest regrowth in South-West Europe: Consequences for nature's contributions to people. People Nat. 2, 980-994. .
Masaki, T., Osumi, K., Takahashi, K., Hozshizaki, K., 2005. Seedling dynamics of Acer mono and Fagus crenata: An environmental filter limiting their adult distributions. Plant Ecol. 177, 189-199.
McCarthy, J., 2001. Gap dynamics of forest trees: A review with particular attention to boreal forests. Environ. Rev. 9, 1-59.
McGregor, R.R., Sakalidis, M.L., Hamelin, R.C., 2016. Neofusicoccum arbuti: A hidden threat to Arbutus menziesii characterized by widespread latent infections and a broad host range. Can. J. Plant Pathol. 38, 70-81. .
Mellanby, K., 1968. The effects of some mammals and birds on regeneration of oak. J. Appl. Ecol. 5, 359. .
Minnemayer, S., Laestadius, L., Sizer, N., 2011. A World of Opportunity. Washington, DC., USA.
Montes, F., Cañellas, I., del Río, M., Calama, R., Montero, G., 2004. The effects of thinning on the structural diversity of coppice forests. Ann. For. Sci. 61, 771-779. .
Moreno-Fernández, D., Aldea, J., Gea-Izquierdo, G., Cañellas, I., Martín-Benito, D., 2021. Influence of climate and thinning on Quercus pyrenaica Willd. coppices growth dynamics. Eur. J. For. Res. 140, 187-197. .
Muffler, L., Weigel, R., Hacket-Pain, A.J., Klisz, M., van der Maaten, E., Wilmking, M., Kreyling, J., van der Maaten-Theunissen, M., 2020. Lowest drought sensitivity and decreasing growth synchrony towards the dry distribution margin of European beech. J. Biogeogr. .
Niinemets, Ü., Valladares, F., 2006. Tolerance to shade, drought, and waterlogging of temperate Northern Hemisphere trees and shrubs. Ecol. Monogr. 76, 521-547. .
Oliva, J., Colinas, C., 2007. Decline of silver fir (Abies alba Mill.) stands in the Spanish Pyrenees: Role of management, historic dynamics and pathogens. For. Ecol. Manag. 252, 84-97. .
Pardo, F., Gil, L., 2005. The impact of traditional land use on woodlands: a case study in the Spanish Central System. J. Hist. Geogr. 31, 390-408. .
Pardo, F., Gil, L., Pardos, J.A., 1997. Field study of beech (Fagus sylvatica L.) and melojo oak (Quercus pyrenaica Willd) leaf litter decomposition in the centre of the Iberian Peninsula. Plant Soil 191, 89-100. .
Perea, R., López-Sánchez, A., Pallarés, J., Gordaliza, G.G., González-Doncel, I., Gil, L., Rodríguez-Calcerrada, J., 2020. Tree recruitment in a drought- and herbivory-stressed oak-beech forest: Implications for future species coexistence. For. Ecol. Manag. 477, 118489. .
Petritan, I.C., Marzano, R., Petritan, A.M., Lingua, E., 2014. Overstory succession in a mixed Quercus petraea-Fagus sylvatica old growth forest revealed through the spatial pattern of competition and mortality. For. Ecol. Manag. 326, 9-17. .
Petritan, A.M., Bouriaud, O., Frank, D.C., Petritan, I.C., 2017. Dendroecological reconstruction of disturbance history of an old-growth mixed sessile oak-beech forest. J. Veg. Sci. 28, 117-127. .
Piovesan, G., Biondi, F., Di Filippo, A., Alessandrini, A., Maugeri, M., 2008. Drought-driven growth reduction in old beech (Fagus sylvatica L.) forests of the central Apennines, Italy. Glob. Chang Biol. 14, 1265-1281. .
R Development Core Team, 2022. R: a language and environment for statistical computing. . (Accessed 2 September 2023).
Rodríguez-Calcerrada, J., Pardos, J.A., Gil, L., Aranda, I., 2007. Summer field performance of Quercus petraea (Matt.) Liebl and Quercus pyrenaica Willd seedlings, planted in three sites with contrasting canopy cover. New For. 33, 67-80. .
Rodríguez-Calcerrada, J., Pardos, J.A., Gil, L., Reich, P.B., Aranda, I., 2008. Light response in seedlings of a temperate (Quercus petraea) and a sub-Mediterranean species (Quercus pyrenaica): Contrasting ecological strategies as potential keys to regeneration performance in mixed marginal populations. Plant Ecol. 195, 273-285. .
Rodríguez-Calcerrada, J., Cano, F.J., Valbuena-Carabaña, M., Gil, L., Aranda, I., 2010. Functional performance of oak seedlings naturally regenerated across microhabitats of distinct overstorey canopy closure. New For. 39, 245-259. .
Rodríguez-Calcerrada, J., López, R., Salomón, R., Gordaliza, G.G., Valbuena-Carabana, M., Oleksyn, J., Gil, L., 2015. Stem CO2 efflux in six co-occurring tree species: underlying factors and ecological implications. Plant Cell Environ. 38, 1104-1115. .
Rodríguez-Calcerrada, J., Salomón, R.L., Gordaliza, G.G., Miranda, J.C., Miranda, E., de la Riva, E.G., Gil, L., 2019. Respiratory costs of producing and maintaining stem biomass in eight co-occurring tree species. Tree Physiol. 39, 1838-1854. .
Rubio-Cuadrado, Á., Camarero, J.J., del Río, M., Sánchez-González, M., Ruiz-Peinado, R., Bravo-Oviedo, A., Gil, L., Montes, F., 2018. Drought modifies tree competitiveness in an oak-beech temperate forest. For. Ecol. Manag. 429, 7-17. .
Rubio-Cuadrado, Á., Camarero, J.J., Gordaliza, G.G., Cerioni, M., Montes, F., Gil, L., 2020a. Competition overrides climate as trigger of growth decline in a mixed Fagaceae Mediterranean rear-edge forest. Ann. For. Sci. 77, 1-18. .
Rubio-Cuadrado, Á., Camarero Martínez, J.J., Gonzalez Gordaliza, G.J., Matteo, C., Fernando, M., Sanchez, G., Alfonso, L., 2020b. Datos de dendrocronología y competencia de El Hayedo de Montejo. e-cienciaDatos V1. . (Accessed 2 September 2023).
Rubio-Cuadrado, Á., Camarero, J.J., Rodríguez-Calcerrada, J., Perea, R., Gómez, C., Montes, F., Gil, L., 2021a. Impact of successive spring frosts on leaf phenology and radial growth in three deciduous tree species with contrasting climate requirements in central Spain. Tree Physiol. 41, 2279-2292. .
Rubio-Cuadrado, Á., Gómez, C., Rodríguez-Calcerrada, J., Perea, R., Gordaliza, G.G., Camarero, J.J., Montes, F., Gil, L., 2021b. Differential response of oak and beech to late frost damage: an integrated analysis from organ to forest. Agric. For. Meteorol. 297, 108243. .
Salomón, R., Valbuena-Carabaña, M., Gil, L., Gonzalez-Doncel, I., 2013. Clonal structure influences stem growth in Quercus pyrenaica Willd. coppices: Bigger is less vigorous. For. Ecol. Manag. 296, 108-118. .
Salomón, R., Rodríguez-Calcerrada, J., Zafra, E., Morales-Molino, C., Rodríguez-García, A., González-Doncel, I., Oleksyn, J., Zytkowiak, R., López, R., Miranda, J.C., Gil, L., Valbuena-Carabaña, M., 2016. Unearthing the roots of degradation of Quercus pyrenaica coppices: A root-to-shoot imbalance caused by historical management? For. Ecol. Manag. 363, 200-211. .
Salomón, R., Rodríguez-Calcerrada, J., González-Doncel, I., Gil, L., Valbuena-Carabaña, M., 2017. On the general failure of coppice conversion into high forest in Quercus pyrenaica stands: a genetic and physiological approach. Folia Geobot. 52, 101-112. .
Sánchez de Dios, R., Hernández, L., Montes, F., Sainz-Ollero, H., Cañellas, I., 2016. Tracking the leading edge of Fagus sylvatica in North-Western Iberia: Holocene migration inertia, forest succession and recent global change. Perspect. Plant Ecol. Evol. Syst. 20, 11-21. .
Sánchez de Dios, R., Gómez, C., Aulló, I., Cañellas, I., Gea-Izquierdo, G., Montes, F., Sainz-Ollero, H., Velázquez, J.C., Hernández, L., 2020. Fagus sylvatica L. peripheral populations in the Mediterranean Iberian Peninsula: climatic or anthropic relicts? Ecosystems 1-16. .
Sangüesa-Barreda, G., Di Filippo, A., Piovesan, G., Rozas, V., Di Fiore, L., García-Hidalgo, M., Garcia-Cervigon, A.I., Muñoz-Garachana, D., Baliva, M., Olano, J.M., 2021. Warmer springs have increased the frequency and extension of late-frost defoliations in southern European beech forests. Sci. Total Environ. 775, 145860. .
Shaw, M.W., 1968. Factors affecting the natural regeneration of sessile oak (Quercus petraea) in North Wales: I. A preliminary study of acorn production, viability and losses. J. Ecol. 56, 565. .
Shibata, M., Nakashizuka, T., 1995. Seed and seedling demography of four co-occurring Carpinus species in a temperate deciduous forest. Ecology 76, 1099-1108. .
Stoyan, D., Stoyan, H., 1994. Fractals, Random Shapes, and Point Fields: Methods of Geometrical Statistics. Wiley, New York, USA.
Tegel, W., Seim, A., Hakelberg, D., Hoffmann, S., Panev, M., Westphal, T., Buntgen, U., 2014. A recent growth increase of European beech (Fagus sylvatica L.) at its Mediterranean distribution limit contradicts drought stress. Eur. J. For. Res. 133, 61-71. .
Valbuena-Carabaña, M., González-Martínez, S.C., Gil, L., 2008. Coppice forests and genetic diversity: A case study in Quercus pyrenaica Willd. from Central Spain. For. Ecol. Manag. 254, 225-232. .
Van Couwenberghe, R., Gégout, J. -C., Lacombe, E., Collet, C., 2013. Light and competition gradients fail to explain the coexistence of shade-tolerant Fagus sylvatica and shade-intermediate Quercus petraea seedlings. Ann. Bot. 112, 1421-1430. .
Vega, C., Fernández, V., Gil, L., Valbuena-Carabaña, M., 2022. Clonal diversity and fine-scale genetic structure of a keystone species: Ilex aquifolium. Forests 13, 1431. .
Venables, B., Riplley, B., 2002. Modern Applied Statistics with S, fourth ed. Springer, Verlag, New York, USA.
Walthert, L., Meier, E.S., 2017. Tree species distribution in temperate forests is more influenced by soil than by climate. Ecol. Evol. 7, 9473-9484. .
Yaussy, D.A., Iverson, L.R., Matthews, S.N., 2013. Competition and climate affects US hardwood-forest tree mortality. For. Sci. 59, 416-430. .
Zeileis, A., Kleiber, C., Jackman, S., 2008. Regression models for count data in R. J. Stat. Softw. 27, 1-25. .
Table
1.
Change in relative density for the seven tree species from 1994 to 2015 for each diameter class (see absolute values of relative density in Table S2). Positive values are increments in relative density and negative values are decrements.
Diameter class (cm)
F.sylvatica
Q.petraea
Q.pyrenaica
I.aquifolium
S.aucuparia
S.aria
P.avium
5–10
0.06+*
−0.03–*
0.01
0.03
–-0.06+*–x
0.000
−0.01
10–15
0.04+*
−0.08–*
0.02
−0.01
0.03+*
−0.002–*
0.00
15–20
0.12+x
0.04
−0.12
−0.07
0.00
0.001
0.03
20–30
0.09+x
0.11+x
−0.15–*+x
−0.05–*
0.00
−0.005
−0.01
30–40
0.05+x
0.16+x
−0.15–*+x
−0.05–*
0.00
0.007
−0.01
40–60
−0.04
0.06+x
0.01+x
−0.01
−0.01
0.000
0.00
60–80
0.00
−0.11
0.12+x
0.01
0.00
0.000
−0.02
> 80
−0.04
−0.22
0.26+x
0.00
0.00
0.000
0.00
Asterisks (*) indicate significant differences using Mann Whitney U test for the values larger than zero and symbols (X) indicate significant differences in the hurdle component of the hurdle regression (zero vs. larger values). Symbol (+) indicates greater presence (that is, a lower proportion of zeros) or greater relative density of the species considered (without considering the zeros), depending on the test considered. Symbol (−) indicates the opposite. When p-value is between 0.05 and 0.1 the asterisk/symbols has been underlined; otherwise p-value is less than 0.05.
Table
2.
Average values of replacement indexes for each of the three inventories. REglobal and REA-B are the replacement indexes, calculated globally for all species or directed to analyze the replacement between two species, respectively. Only the three dominant species were considered (Fagus sylvatica, Quercus petraea and Q. pyrenaica).
Table
3.
Density of trees dead in 2015 that were alive in 2005 (in trees·ha−1), for each diameter class and species. Diameters correspond to those measured in 2005. The percentage of dead to total trees inventoried for each diameter class and species in 2005 is shown in parentheses. Dashes indicate that there were no inventoried individuals of a given diameter in 2005.
Table
4.
Coefficients and standard errors (in parentheses) of the hurdle regressions for the best models of basal area as depending on the different physiographic, soil and forest predictors. The models were obtained for the different species based on the data of the 2015 inventory. Top and bottom panels show the count and hurdle components of the hurdle regressions, respectively. Significance levels: · P < 0.10, *P < 0.05, **P < 0.01 and ***P < 0.001, respectively.
Basal area. Count componenta
F.sylvatica
Q.petraea
Q.pyrenaica
I.aquifolium
S.aucuparia
S.aria
P.avium
All speciesb
BAF.sylvaticac
−0.35 (0.16)*
−0.24 (0.08)**
BAQ.petraeac
−0.28 (0.14)*
−0.31 (0.13)*
BAQ.pyrenaicac
−0.79 (0.17)***
−0.66 (0.18)***
−0.65 (0.22)**
−1.16 (0.61)·
Altitude
−0.58 (0.20)**
−0.36 (0.09)***
−0.16 (0.06)**
Slope
1.03 (0.27)***
0.85 (0.42)*
Aspect
Soil depth
0.32 (0.14)*
0.96 (0.43)*
0.19 (0.06)**
R2
0.42
0.14
0.37
0.47
0.31
–
0.17
0.11
Basal area. Hurdle (zero) componenta
F.sylvatica
Q.petraea
Q.pyrenaica
I.aquifolium
S.aucuparia
S.aria
P.avium
BAF.sylvaticac
−1.29 (0.32)***
0.39 (0.21)·
−1.38 (0.82)·
BAQ.petraeac
0.78 (0.33)*
0.86 (0.25)***
BAQ.pyrenaicac
−0.77 (0.27)**
−1.56 (0.74)*
BAotherc
0.43 (0.26)·
0.62 (0.27)*
0.43 (0.22)·
Altitude
−1.21 (0.3)***
0.92 (0.23)***
−2.63 (0.49)***
Slope
−0.35 (0.21)·
0.38 (0.21)·
Aspect
0.84 (0.33)*
Soil depth
0.37 (0.22)·
0.58 (0.24)*
% correct
79
71
83
73
86
–
67
a Predictors were standardized previously to fit the models. Note that positive coefficients in the hurdle component indicate that an increase in the factor increases the probability of a non-zero count. The goodness of fit of the model is shown by the R2 in the count component and the percentage of correct predictions in the hurdle component. b For the total basal area (considering all species) a negative binomial generalized linear model, instead of the hurdle model, was fitted due to the low proportion of plots where the response variable takes a value of 0. c BA is the basal area of the different species, with BAother being the total BA of the least abundant species (I.aquifolium, S.aucuparia, S.aria, P.avium and other species with lesser presence in the forest, but excluding, when apply, the species that correspond to the response variable, i.e., if the response variable is BAI.aquifolium, then BAother results from the sum of the basal areas of S.aucuparia, S.aria, P.avium and the other species with lesser presence in the forest).

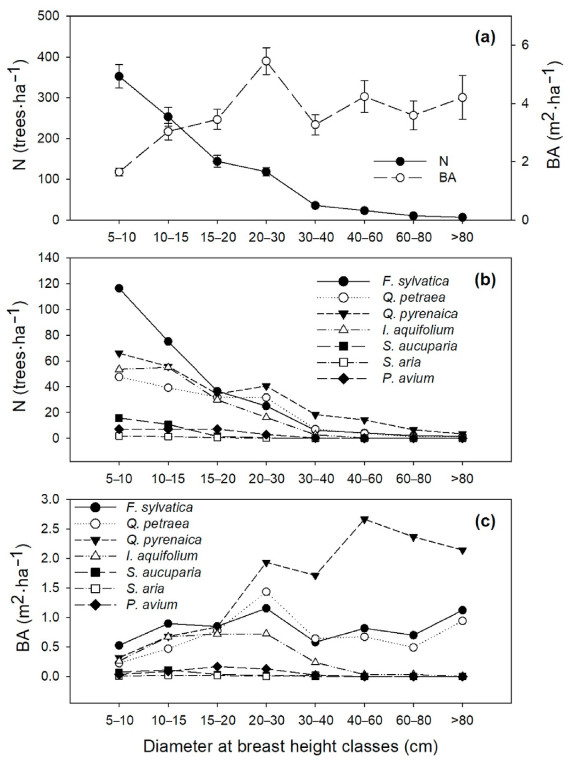
 DownLoad:
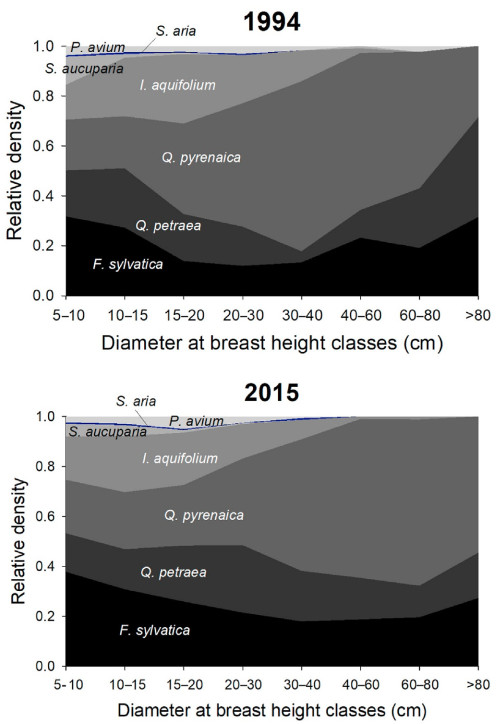
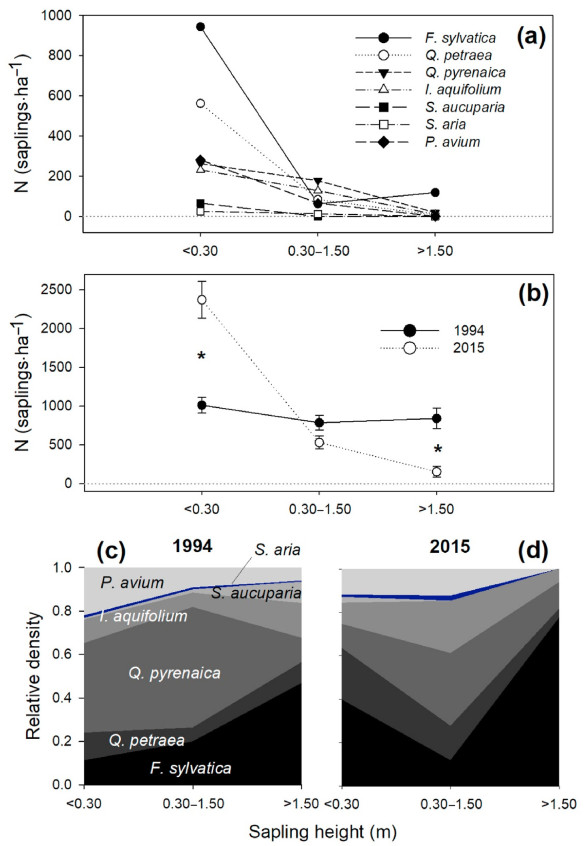
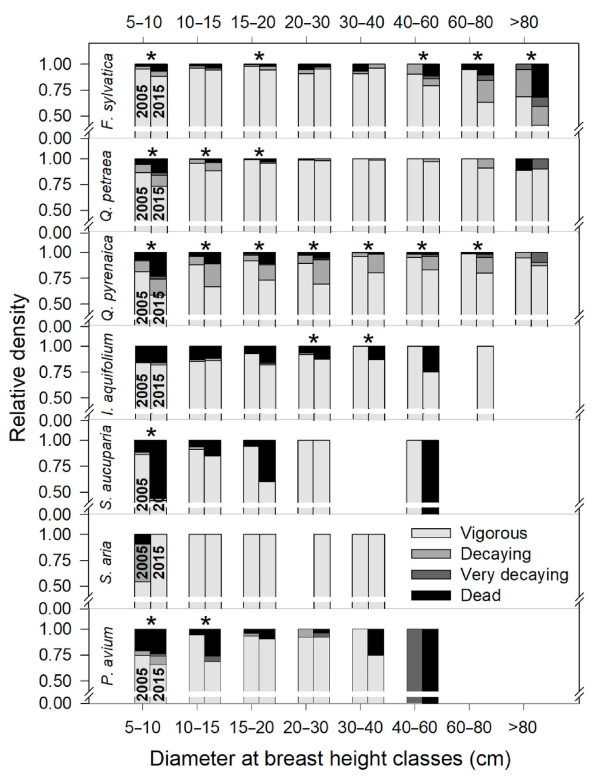


 Email Alerts
 RSS Feeds