Yanlin Wang, Dongzhi Wang, Dongyan Zhang, Qiang Liu, Yongning Li. Predicting carbon storage of mixed broadleaf forests based on the finite mixture model incorporating stand factors, site quality, and aridity index[J]. Forest Ecosystems, 2024, 11(1): 100189. DOI: 10.1016/j.fecs.2024.100189
Citation:
Yanlin Wang, Dongzhi Wang, Dongyan Zhang, Qiang Liu, Yongning Li. Predicting carbon storage of mixed broadleaf forests based on the finite mixture model incorporating stand factors, site quality, and aridity index[J]. Forest Ecosystems, 2024, 11(1): 100189. DOI: 10.1016/j.fecs.2024.100189
Yanlin Wang, Dongzhi Wang, Dongyan Zhang, Qiang Liu, Yongning Li. Predicting carbon storage of mixed broadleaf forests based on the finite mixture model incorporating stand factors, site quality, and aridity index[J]. Forest Ecosystems, 2024, 11(1): 100189. DOI: 10.1016/j.fecs.2024.100189
Citation:
Yanlin Wang, Dongzhi Wang, Dongyan Zhang, Qiang Liu, Yongning Li. Predicting carbon storage of mixed broadleaf forests based on the finite mixture model incorporating stand factors, site quality, and aridity index[J]. Forest Ecosystems, 2024, 11(1): 100189. DOI: 10.1016/j.fecs.2024.100189
The diameter distribution function (DDF) is a crucial tool for accurately predicting stand carbon storage (CS). The current key issue, however, is how to construct a high-precision DDF based on stand factors, site quality, and aridity index to predict stand CS in multi-species mixed forests with complex structures. This study used data from 70 survey plots for mixed broadleaf Populus davidiana and Betula platyphylla forests in the Mulan Rangeland State Forest, Hebei Province, China, to construct the DDF based on maximum likelihood estimation and finite mixture model (FMM). Ordinary least squares (OLS), linear seemingly unrelated regression (LSUR), and back propagation neural network (BPNN) were used to investigate the influences of stand factors, site quality, and aridity index on the shape and scale parameters of DDF and predicted stand CS of mixed broadleaf forests. The results showed that FMM accurately described the stand-level diameter distribution of the mixed P. davidiana and B. platyphylla forests; whereas the Weibull function constructed by MLE was more accurate in describing species-level diameter distribution. The combined variable of quadratic mean diameter (Dq), stand basal area (BA), and site quality improved the accuracy of the shape parameter models of FMM; the combined variable of Dq, BA, and De Martonne aridity index improved the accuracy of the scale parameter models. Compared to OLS and LSUR, the BPNN had higher accuracy in the re-parameterization process of FMM. OLS, LSUR, and BPNN overestimated the CS of P. davidiana but underestimated the CS of B. platyphylla in the large diameter classes (DBH ≥18 cm). BPNN accurately estimated stand- and species-level CS, but it was more suitable for estimating stand-level CS compared to species-level CS, thereby providing a scientific basis for the optimization of stand structure and assessment of carbon sequestration capacity in mixed broadleaf forests.
Within the context of global climate change, the prediction of changes in stand carbon storage (CS) based on the diameter distribution function (DDF) (Yen et al., 2010) is of great significance for optimizing stand structure (Yen, 2023), improving stand productivity (Yang et al., 2022), and mitigating climate change (Wang et al., 2023a; Wu et al., 2023a). Some previous studies (Ali et al., 2016; Tetemke et al., 2021) have concluded that stand diameter structure is important for the accurate prediction of stand CS and to describe stand non-spatial structure (Guo and Lei, 2016; Long et al., 2021), which in turn is used to predict stand volume (Lumbres and Lee, 2014) and biomass (Hussain et al., 2021) and to assess the value of stand assets (Liu et al., 2011). Therefore, the construction of a high-precision DDF to predict stand CS is of great significance for the assessment of carbon sequestration capacity (Zhang et al., 2014), improving the efficiency of stand production (Abino et al., 2016), and optimizing management measures (Qi et al., 2016).
The probability density function (PDF) is the dominant method used to describe stand diameter distribution (Long et al., 2021). Currently, commonly used PDFs include beta (Palahí et al., 2007), Johnson's special bounded (SB) (Fonseca et al., 2009), normal (Sanquetta et al., 2014), Weibull (Abino et al., 2016), and gamma (Mayrinck et al., 2018) functions. The Weibull function is the most commonly used PDF to describe stand diameter distribution (Sun et al., 2019), and has been extensively applied to plantations of Picea mariana (Mill.) Britton, Sterns & Poggenb. (Liu et al., 2011), Pinus kesiya Royle ex Gordon (Lumbres and Lee, 2014), and Quercus mongolica Fisch. ex Ledeb. (Guo and Lei, 2016). However, the use of a single PDF to accurately describe changes in the diameter distribution in multi-species mixed forests with a complex structure remains challenging (Jaworski and Podlaski, 2012), so a finite mixed model (FMM) is proposed to address this challenge (Zhang et al., 2001). The FMM has been shown to accurately describe the diameter distribution of mixed coniferous forests (Liu et al., 2002) and mixed conifer-broadleaf forests (Wang et al., 2006; Podlaski, 2010a), while providing acceptable estimates of PDF parameters and proportions for each species (Liu et al., 2014). FMM can achieve improvements in predicting stand-level diameter distribution, but its effectiveness in predicting species-level diameter distribution remains controversial (Yang et al., 2022).
Factors influencing the prediction accuracy of DDF include stand factors such as quadratic mean diameter (Sun et al., 2019), stand density (Abino et al., 2016; Long et al., 2021), and site quality (Lumbres and Lee, 2014; Mayrinck et al., 2018). Quadratic mean diameter is the main factor affecting the scale (Miranda et al., 2018) and shape (Diamantopoulou et al., 2015) parameters of DDF. The scale parameter of the Weibull function gradually increases with increasing quadratic mean diameter (Guo et al., 2022). However, compared to quadratic mean diameter, the stand density has a greater impact on the scale parameter (Newton et al., 2005). Site quality has been shown to also affect the scale (Liu et al., 2011) and shape (Schmidt et al., 2019) parameters. The scale and shape parameters decrease gradually with increasing stand dominant height (Guo and Lei, 2016). Species composition is an additional important factor affecting the scale (Liu et al., 2014) and shape (Podlaski and Roesch, 2014) parameters. Therefore, improving the prediction accuracy of DDF requires the identification of the main factors affecting the scale and shape parameters.
Apart from stand factors and site quality, climate factors such as temperature (Condés et al., 2022), precipitation (Trifković et al., 2022), and illumination (Wang et al., 2023b) also influence the accuracy of DDF predictions. Temperature affects the scale and shape parameters of the Weibull function by influencing the growth of diameter at breast height (DBH) (Manso et al., 2015; Wu et al., 2018). The scale parameter gradually decreases with increasing temperature (Guo et al., 2022). In contrast, some previous studies (Sanquetta et al., 2014; Wu et al., 2018) have demonstrated the important combined influence of temperature and precipitation on parameters of the Weibull function. However, the aridity index, a comprehensive climate indicator reflecting temperature and precipitation (Tabari et al., 2014), has been shown to affect the scale and shape parameters (Tijerín-Triviño et al., 2022). The increase in aridity intensity inhibits the DBH of Pinus sylvestris L., resulting in a gradual rightward skewing of the stand diameter distribution (Novák et al., 2010). To date, there have been few studies (Pekin et al., 2009; Novák et al., 2010) on the impact of the aridity index on the diameter distribution of plantations. Therefore, there remains a need for a more in-depth exploration of the effect of the aridity index on changes in diameter distribution of mixed forests.
The DDF has also been shown to be influenced by parameter estimation methods (Diamantopoulou et al., 2015). The currently commonly used parameter estimation methods include ordinary least squares (OLS) (Sanquetta et al., 2014), seemingly unrelated regression (SUR) (Liu et al., 2011), and artificial neural network (ANN) (Long et al., 2021). While OLS has strict data requirements (Liu et al., 2023) and is sensitive to outliers (Wu et al., 2023b), SUR considers cross-equation correlated errors in the parameter estimation process (Rose and Lynch, 2001; Guo et al., 2022) but has several limitations, such as choice of model form and multicollinearity tests (Xu et al., 2022). In contrast, since ANN does not require normally distributed and independent study data (Che et al., 2019) and is less sensitive to noise (Bayat et al., 2020), its use can improve the prediction accuracy of DDF. As shown above, choosing an appropriate parameter estimation method is important for improving the prediction accuracy of DDF for mixed forests.
Precise estimates of DDF are the basis for accurate prediction of stand CS (Yen et al., 2010; Lumbres and Lee, 2014). DDF provides higher flexibility and more accurate predictions of stand biomass and CS compared to traditional models (Qi et al., 2016). Currently, DDF has been applied to estimate the biomass and CS of timber forests such as Phyllostachys edulis (Carrière) J. Houz. (Zhang et al., 2014), Pinus thunbergii Parl. (Abino et al., 2016), and Abies fabri (Mast.) Craib (Hussain et al., 2021). However, the prediction accuracy of stand CS depends largely on the accuracy of DDF (Yen, 2023). Therefore, constructing a high-precision DDF is the basis for exploring how stand structure influences CS (Wu et al., 2023a).
The broadleaf forests comprised of mixed Populus davidiana and Betula platyphylla are amongst the major forest types in northern China, providing major economic value and important ecological services, including wood production, windbreaks, sand fixation, and climate regulation (Wang et al., 2017). The prediction accuracy of stand CS is largely dependent on the DDF used (Qi et al., 2016). However, there remains uncertainty in the optimal approach for constructing the DDF for multi-species mixed forests with complex structures. Therefore, the aim of the present study was to construct the DDF for mixed broadleaf P. davidiana and B. platyphylla forests based on stand factors, site quality, and aridity index to predict stand CS. The present study used mixed broadleaf P. davidiana and B. platyphylla forests in the Mulan Rangeland State Forest, Heibei Province, China as the research object. The objectives of the present study were to: (1) compare the maximum likelihood estimation (MLE) and FMM methods for improving the prediction accuracy of stand diameter distribution in the studied mixed broadleaf forests; (2) explore the effects of stand factors, site quality, and aridity index on the scale and shape parameters of the Weibull function; (3) compare the influences of various parameter estimation methods on the scale and shape parameter models; (4) combine the FMM, single-tree biomass models, and species carbon coefficients to predict stand CS of the studied mixed broadleaf forests.
2.
Materials and methods
2.1
Study area
The study area is in the Mulan Rangeland State Forest (116°32′ E−117°14′, 41°35′–42°40′ N) in Hebei Province, China, encompassing an altitude of 750 to 1,998 m and falling in a continental monsoon mountain climate zone. Average annual temperature, annual precipitation, and annual evaporation are −1.4 to 4.7 ℃, 380–560 mm, and 1,462 to 1,556 mm, respectively. The main soil types of the study area are gray forest, aeolian, sandy loam, swamp, and meadow soils. The main tree species in the study area include P. davidiana, B. platyphylla, Quercus mongolica, Pinus sylvestris var. Mongholica Litv., Larix gmelinii var. principis-rupprechtii (Mayr.) Pilger, and Picea asperata Mast.; the main shrub species include Prunus padus L., Berberis ferdinandi-coburgii C.K. Schneid. in C.S. Sargent, and Rosa davurica Pall.; the main herbaceous plants include Vicia unijuga A.Br., Saussurea japonica (Thunb.) DC., and Thalictrum aquilegiifolium var. sibiricum Linnaeus.
2.2
Data description
The present study collected data from 70 standard plots of mixed broadleaf P. davidiana and B. platyphylla forests in Mulan Rangeland State Forest from 2013 to 2023. The standard plot area of all plots was 0.06 ha (20 m × 30 m) (Liu et al., 2014). Origin, species, diameter at breast height (DBH), tree height, and other tree survey factors (DBH ≥5 cm) were observed and recorded for each standard plot. Stand survey factors, including basal area, dominant height, and age were also recorded. In each plot, the minimum proportion (based on basal area) of each species is 20%, and the dominant single P. davidiana and B. platyphylla trees within each 100 m2 (Özçelik et al., 2018) were selected to determine dominant species and stand tree height. Stand density and age ranged from 590 to 2,817 trees·ha−1 and from 18 to 42 years, respectively. Table 1 provides a summary of the standard plots of mixed broadleaf P. davidiana and B. platyphylla forests. The present study also collected meteorological data from weather stations in the study area from 1971 to 2022 (Table 2) to analyze the effects of precipitation, temperature, and other climatic factors on the diameter distribution and CS of mixed broadleaf P. davidiana and B. platyphylla forests.
Table
1.
Statistics of survey data on standard plots of mixed broadleaf P. davidiana and B. platyphylla forests.
Variable
P. davidiana × B. platyphylla
P. davidiana
B. platyphylla
Min
Max
Mean
SD
Min
Max
Mean
SD
Min
Max
Mean
SD
Dq (cm)
6.33
22.64
14.97
3.88
6.23
23.90
14.80
4.17
6.83
25.65
14.44
4.14
N (trees·ha−1)
590
2,817
1,298
562
183
1,783
835
398
117
1370
462
280
BA (m2·ha−1)
6.33
35.08
19.27
5.91
3.21
28.42
12.65
5.35
2.04
24.70
6.62
3.78
Hd (m)
7.76
22.60
15.54
3.87
7.37
21.28
14.61
3.66
6.98
21.02
14.15
3.53
Notes: Dq: quadratic average diameter at breast height; N: stems per hectares; BA: basal area; Hd: dominant height.
Table
2.
Statistics of climate factors (1971–2022) of Mulan Rangeland State Forest.
Variable
Min
Max
Mean
SD
P (mm)
249.1
648.1
446.3
91.4
MAT (℃)
4.0
6.5
5.4
0.7
Pd (mm)
0.0
10.6
2.4
2.8
Td (℃)
−15.8
−8.0
−11.5
1.5
Tmax (℃)
30.2
39.4
33.4
1.8
Tmin (℃)
−32.3
−20.0
−24.9
2.3
Notes: P: annual precipitation; MAT: annual mean temperature; Pd: precipitation of the driest month; Td: mean temperature of the driest month; Tmax: annual maximum temperature; Tmin: annual minimum temperature.
Climatic factors, such as temperature and precipitation, are important variables affecting the prediction accuracy of the DDF (Sanquetta et al., 2014; Guo et al., 2022). The aridity index is a comprehensive climate index describing the impact of temperature and precipitation on the DDF (Tabari et al., 2014; Tijerín-Triviño et al., 2022). Currently, commonly used aridity indices include the Lang (Im) (Şarlak and Mahmood Agha, 2018), De Martonne (IDM) (Moral et al., 2016), and Pinna (IP) (Jahangir and Danehkar, 2022) aridity indices. The present study introduced different forms of aridity index (Table 3) to the construction of DDF, and explored their impacts on DDF of mixed broadleaf forests.
Table
3.
Aridity index and aridity classification criteria.
Aridity index
Classification
Reference
Im=PMAT
Im < 20: arid; 20 to 40: semi-arid; 40 to 60: humid; > 160: very humid
where x is DBH in cm; α, β, and γ are the position, scale, and shape parameters of the 3-p Weibull function, respectively.
2.4.2
Finite mixture model
Zhang et al. (2001) proposed a finite mixture model (FMM) to improve the prediction accuracy of the diameter distribution in mixed forests. FMM can simultaneously estimate the PDF parameters and proportions of different species (Liu et al., 2014) and has been applied to study the diameter distribution of mixed coniferous forests (Liu et al., 2002) and mixed conifer-broadleaf forests (Jaworski and Podlaski, 2012; Yang et al., 2022). Therefore, the present study used a finite mixed model (Eq. 2) to construct the DDF of mixed broadleaf forests.
g(x)=ρf1(x)+(1−ρ)f2(x)
(2)
where g(x) is the two-component mixture model; f1(x) and f2(x) are both 3-p Weibull functions; ρ is the mixing proportion and 0<ρ<1.
2.4.3
Parameter prediction model
The main methods for predicting Weibull parameters include the parameter prediction method (PPM) (Diamantopoulou et al., 2015), parametric recovery method (PRM) (Liu et al., 2011), and percentile method (Abino et al., 2016). Among these, the PRM and percentile method predict Weibull parameters based on moments or percentiles (Poudel et al., 2013; Guo and Lei, 2016). In contrast, PPM establishes a functional relationship between parameters and stand variables (Cao, 2022) and is widely used in plantations (Newton et al., 2005; Long et al., 2021) and mixed forests (Sun et al., 2019). Therefore, the present study applied PPM to construct the parameter prediction models of DDF of P. davidiana and B. platyphylla mixed broadleaf forests (Eq. 3), and the location parameter was set to 0.5 times the minimum DBH (Yang et al., 2022).
where f3 and f4 are both linear functions; stand represents variables including Dq, N (the number of stems per hectare), and BA; and site quality represents Hd, climate represents variables including Im, IDM, and IP.
2.4.4
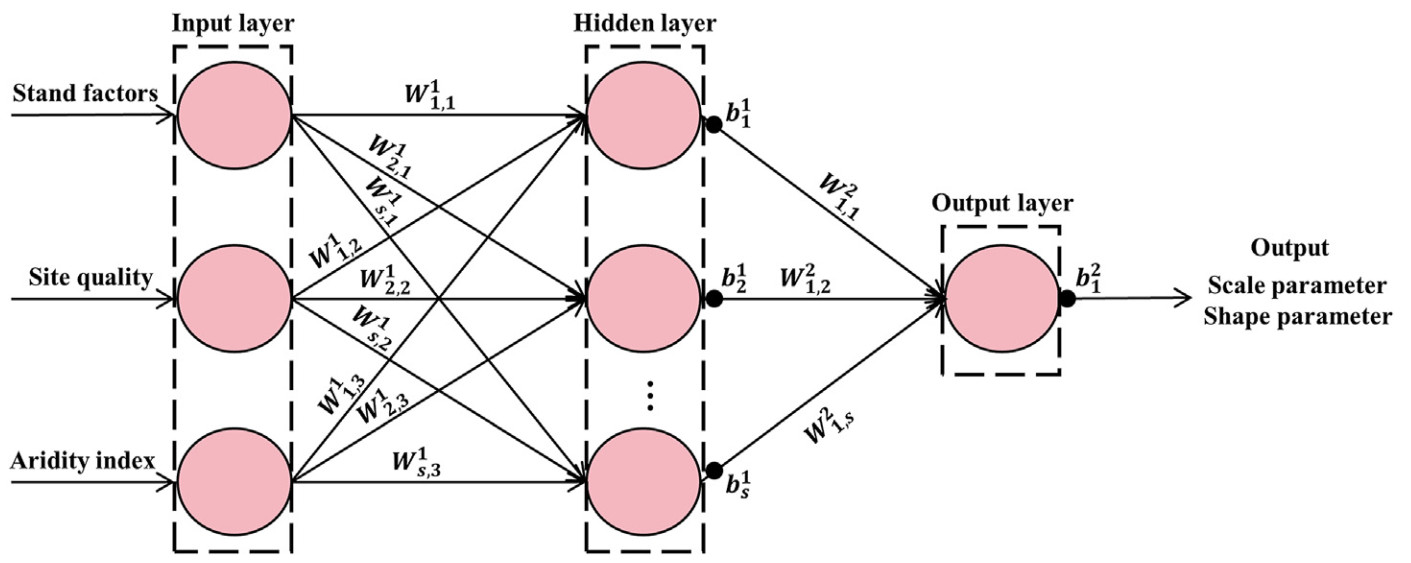
Back propagation neural network (BPNN)
BPNN is a feed-forward neural network comprising input, hidden, and output layers (Ding et al., 2011). It does not require normally distributed and independent study data (Che et al., 2019) and is insensitive to noise and outliers (Bayat et al., 2020). However, site quality and stand factors have been shown to exhibit significant variability among different stands (Sun et al., 2019; Guo et al., 2022). Therefore, the present study applied BPNN to predict the scale and shape parameters of DDF in the studied mixed broadleaf forests (Eq. 4). Input factors considered included stand factors, site quality, and aridity index, whereas the output factors considered were scale or shape parameters (Fig. 1). The present study identified the number of neurons in the hidden layer using trial and error (Xu, 2023). The transfer functions between layers were the tansig function (Eq. 5) (Diamantopoulou et al., 2015; Long et al., 2021) and purelin (linear) function (Pan et al., 2020).
y=s∑s=1(W21,s×tansig(W1s,jh+b1s))+b21
(4)
tansig(z)=21+e−2z−1
(5)
Figure
1.
The architecture of back propagation neural network used in this study (W is the weight value, and b is the threshold value).
where y are the scale or shape parameters; s is the number of neurons in the hidden layer; W21,s is the weight from the sth neuron in the hidden layer to the neuron in the output layer; W1s,j is the weight from the jth neuron in the input layer to the sth neuron in the hidden layer; h are the values of stand factors, site quality and aridity index, respectively; b1s is the threshold value of the sth neuron in the hidden layer; b21 is the threshold value of the output layer; and tansig(z) is the transfer function, z=W1s,jh+b1s.
2.4.5
Linear seemingly unrelated regression (LSUR)
LSUR consists of a series of multiple regression equations (Fu et al., 2016), the error covariance of which can be considered to minimize the overall error of the model (Rose and Lynch, 2001; Liu et al., 2011; Fu et al., 2017). Since scale and shape parameter models often contain the same independent variables, the error terms of the models are correlated (Newton et al., 2005; Guo et al., 2022). Therefore, the present study applied LSUR to estimate the prediction model of the scale and shape parameters (Eq. 6).
{Ykq=fk(Xkq;θk)+εkqE(εkq)=0,Cov(εkq)=V⊗In
(6)
where Ykq is the qth dependent variable value in the kth equation; fk is the kth linear function; Xkq is the qth independent variable value in the kth equation; θk is the undetermined parameter for the kth equation; εkq is the qth observation error in the kth equation; V is the covariance matrix of the model; and ⊗ is the Kronecker product.
2.4.6
Calculation of carbon storage
The present study used tree biomass equations: Eq. 7 and Eq. 8, for P. davidiana and B. platyphylla constructed by the carbon storage in Chinese forest ecosystems-biomass equation (Zhou et al., 2018), carbon coefficients and combined with DDF to predict stand CS (Eq. 9) (Hussain et al., 2021; Qin, 2021) of mixed broadleaf forests. The present study used carbon coefficients for P. davidiana and B. platyphylla were 0.516 and 0.488, respectively (Jiang et al., 2015).
where mp, DBHp, Wp, and CCp are the tree biomass equation, DBH (cm), biomass (kg·ha−1), and carbon coefficient of P. davidiana, respectively; mb, DBHb, Wb, and CCb are the tree biomass equation, DBH (cm), biomass (kg·ha−1), and carbon coefficient of B. platyphylla; CSs is the CS (kg·ha−1) of the studied mixed broadleaf forests; N is the number of trees (trees·ha−1); l and t are the upper and lower DBH limits of each diameter class; h(x) and u(x) are the tree biomass equations as functions; w(x) and v(x) are DDFs.
2.4.7
Model fitting and evaluation
The present study used the "mixR" (Yu, 2022), "systemfit" (Henningsen and Hamann, 2008), and "neuralnet" (Günther and Fritsch, 2010) packages in R to estimate the parameters of the DDF, LSUR, and BPNN, respectively. The accuracy and precision of the DDF were verified by the 10-fold cross-validation technique (Diamantopoulou et al., 2015; Yang et al., 2022), and the accuracy of the model fitting was evaluated using the Kolmogorov Smirnov (KS) test, mean absolute error (MAE), root mean square error (RMSE), Akaike information criterion (AIC), mean percentage error (MPE), determination coefficient (R2), and adjusted determination coefficient (R2adj).
D=Sup|F∗(x)−F(x)|
(10)
MAE=n∑i=1|yi−ˆyi|n
(11)
RMSE=√n∑i=1(yi−ˆyi)2n
(12)
AIC=−2lnL+2λ
(13)
MPE=n∑i=1|yi−ˆyi|n∑i=1yi×100%
(14)
R2=1−n∑i=1(yi−ˆyi)2n∑i=1(yi−¯yi)2
(15)
R2adj=1−(1−R2)(n−1n−λ)
(16)
where D is the KS statistics; Sup is the maximum value; F∗(x) and F(x) are the theoretical and realized probability of the diameter distribution; n is the number of diameter classes; yi, ˆyi, and ¯yi are the observed, predicted, and mean values of the number of trees (trees·ha−1) or CS (kg·ha−1), respectively; L is the maximum likelihood value; and λ is the number of model parameters.
3.
Results
3.1
Fitting of the diameter distribution function
The 3-p Weibull function accurately described the stand-level and species-level diameter distributions of mixed broadleaf P. davidiana and B. platyphylla forests, with KS of 0.125, 0.125, and 0.113, respectively (Table 4). FMM increased the prediction accuracy of stand-level diameter distribution when compared to MLE, with decreases in MAE and RMSE of 11.70% and 7.69%, respectively. However, it decreased the prediction accuracy of species-level diameter distributions compared to MLE, with increases in MAE and RMSE of 32.23%–80.15%.
Table
4.
Statistical test for stand level and species level diameter distribution based on the Weibull function and FMM.
Function
Species
KS
Fit dataset
Validate dataset
MAE
RMSE
MAE
RMSE
Weibull
P. davidiana × B. platyphylla
0.125
7.528
15.936
34.066
44.018
P. davidiana
0.125
5.775
9.540
26.251
32.932
B. platyphylla
0.113
5.809
10.211
14.394
19.861
FMM
P. davidiana × B. platyphylla
0.113
5.701
8.983
30.079
40.631
P. davidiana
0.225
24.285
32.967
34.713
44.769
B. platyphylla
0.613
27.149
31.593
25.931
35.481
Notes: KS: Kolmogorov Smirnov statistics; MAE: mean absolute error (trees·ha−1); RMSE: root mean square error (trees·ha−1).
3.2
Parameter prediction models based on different variables
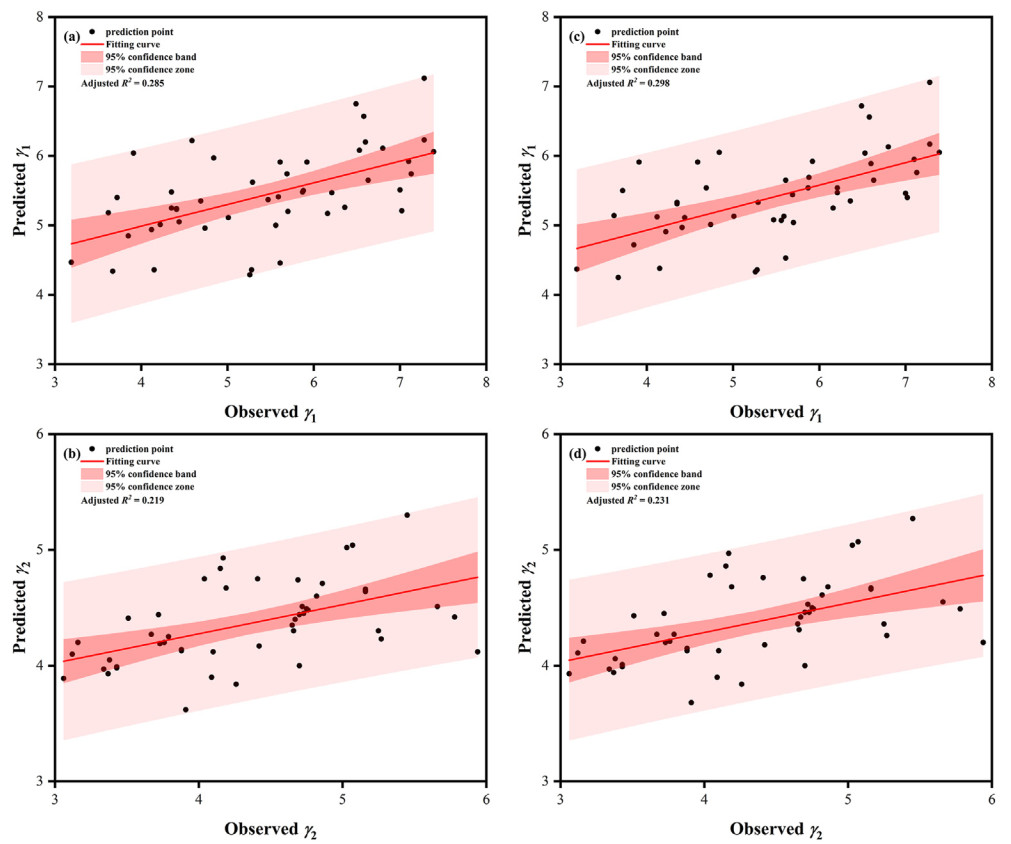
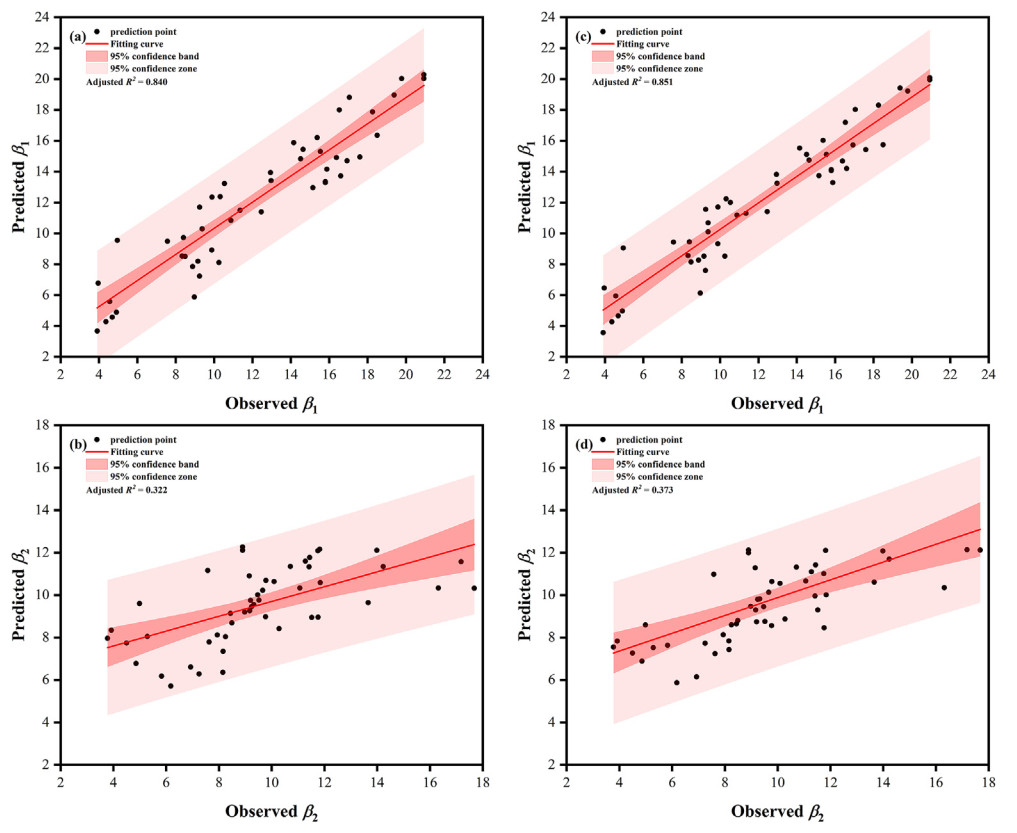
Dq and BA were the main stand predictors for the scale and shape parameters of FMM (Table 5); whereas Hd only improved the prediction accuracy of the shape parameter models (Fig. 2). The addition of Hd to the shape parameter models resulted in an increase in R2adj of 4.56% and 5.48%, respectively; the MAE and RMSE decreased by 0.12%–1.10%. Although the aridity index improved the prediction accuracy of the scale parameter models, among Im, IDM, and IP, only IDM improved the prediction accuracy of the scale parameter models (Fig. 3), with R2adj increased by 1.31% and 15.84%, respectively; the MAE and RMSE decreased by 0.25%–1.13%. The variance inflation factor is between 1.012 and 3.553, indicating that there is no collinearity in the models.
Table
5.
Evaluation of the prediction accuracy of stand factors, site quality and aridity index on the scale and shape parameter models in FMM.
Re-parameterized model
AIC
MAE
RMSE
R2
R2adj
β1s = −2.969 + 1.086Dq – 0.038BA
208.697
3.150
4.133
0.847
0.840
β1c = −0.466 + 1.076Dq – 0.025BA – 0.094IDM
206.268
3.142
4.111
0.860
0.851
γ1s = 3.107 + 0.073Dq + 0.068BA
142.169
2.091
2.583
0.315
0.285
γ1c = 2.867 + 0.017Dq + 0.067BA + 0.071Hd
140.921
2.068
2.580
0.342
0.298
β2s = 2.907 + 0.405Dq + 0.038BA
237.342
6.358
7.454
0.350
0.322
β2c = −0.613 + 0.427Dq + 0.018BA + 0.132IDM
234.437
6.286
7.431
0.412
0.373
γ2s = 3.973 – 0.073Dq + 0.077BA
104.932
3.585
4.760
0.252
0.219
γ2c = 3.982 – 0.071Dq + 0.078BA – 0.003Hd
102.935
3.579
4.753
0.279
0.231
Notes: β1s, β2s: Re-parameterized scale parameter models with stand factors; β1c, β2c: Re-parameterized scale parameter models with stand factors and De Martonne aridity index; γ1s, γ2s: Re-parameterized shape parameter models with stand factors; γ1c, γ2c: Re-parameterized shape parameter models with stand factors and site quality.
Figure
2.
Predicted and observed values of the shape parameters in FMM. Note: (a) and (b) represent the γ1 and γ2 models with stand factors, respectively; (c) and (d) represent the γ1 and γ2 models with stand factors and site quality, respectively.
Figure
3.
Predicted and observed values of the scale parameters in FMM. Note: (a) and (b) represent the β1 and β2 models with stand factors, respectively; (c) and (d) represent the β1 and β2 models with stand factors and De Martonne aridity index, respectively.
3.3
Comparison of three parameter estimation methods
A comparison of OLS, LSUR, and BPNN showed that BPNN provided the highest prediction accuracy. The RMSE of parameter prediction models were 3.699, 2.248, 7.257, 4.548, respectively (Table 6). The use of BPNN increased R2adj by 1.65%–50.67% compared with OLS. The order of the parameter estimation models according to prediction accuracy was BPNN > LSUR > OLS, with LSUR increasing R2adj by 0.24%–1.73% compared to OLS. Table 7 shows the expressions of the transfer functions between the layers of BPNN.
Table
6.
Testing and evaluation of the fitting accuracy of scale and shape parameter models using different parameter estimation methods.
Model
OLS
LSUR
BPNN
MAE
RMES
R2
R2adj
MAE
RMES
R2
R2adj
MAE
RMES
R2
R2adj
β1c
3.142
4.111
0.860
0.851
3.140
4.104
0.862
0.853
2.994
3.699
0.873
0.865
γ1c
2.068
2.580
0.342
0.298
2.063
2.578
0.345
0.301
1.858
2.248
0.484
0.449
β2c
6.286
7.431
0.412
0.373
6.276
7.424
0.415
0.376
5.963
7.257
0.516
0.484
γ2c
3.579
4.753
0.279
0.231
3.570
4.742
0.283
0.235
3.511
4.548
0.384
0.343
Notes: OLS: ordinary least squares; LSUR: linear seemingly unrelated regression; BPNN: back propagation neural network.
3.4
Carbon storage prediction based on the diameter distribution function
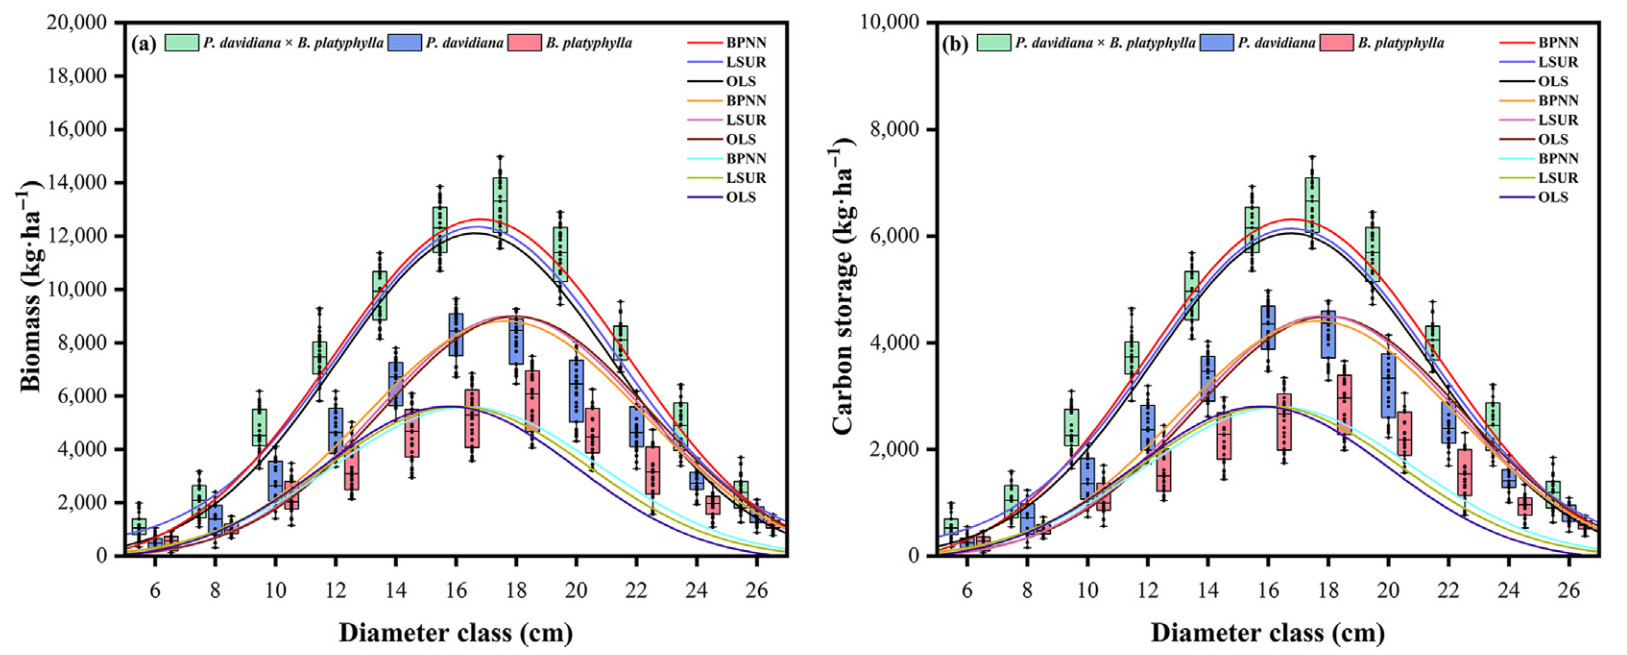
The present study used single-tree biomass models, carbon coefficients, and the FMM constructed using different methods to predict stand- and species-level biomass and CS of the studied mixed broadleaf forests (Fig. 4). The scale and shape parameter models of FMM constructed based on BPNN improved the prediction accuracy of stand biomass (MAE = 2,341.993 kg·ha−1, RMSE = 3,721.791 kg·ha−1, MPE = 0.552) and CS (MAE = 1,199.359 kg·ha−1, RMSE = 1,843.561 kg·ha−1, MPE = 0.548) (Table 8). OLS underestimated stand-level biomass and CS in each diameter class; LSUR showed high prediction accuracy for biomass and CS in the small diameter classes (DBH < 18 cm), and showed low prediction accuracy for biomass and CS in the large diameter classes (DBH ≥18 cm); BPNN provided highly accurate predictions of biomass and CS in all diameter classes (Fig. 4). OLS, LSUR, and BPNN overestimated the CS of P. davidiana but underestimated the CS of B. platyphylla in the large diameter classes. In contrast, the three methods showed similar trends in estimating biomass and CS in the small diameter classes of P. davidiana and B. platyphylla, but BPNN provided the overall highest prediction accuracy (Fig. 4).
Figure
4.
Stand- and species-level biomass (kg·ha−1) (a) and CS (kg·ha−1) (b) prediction based on FMM constructed using different methods.
The present study used MLE and FMM based on the 3-p Weibull function to construct the DDF of mixed broadleaf P. davidiana and B. platyphylla forests. OLS, LSUR, and BPNN were used to analyze the influences of stand factors, site quality, and climate factors on scale and shape parameter models and their accuracies. Stand- and species-level CS of mixed broadleaf P. davidiana and B. platyphylla forests were predicted by combining single-tree biomass models, carbon coefficients, and FMM constructed by different methods. The approach described in the present study provides a scientific basis for the assessment of the carbon sequestration capacity, improvement of stand productivity, and optimization of stand structure in mixed broadleaf forests.
4.1
Diameter distribution function
The 3-p Weibull function accurately described changes in stand- and species-level diameter distributions for the studied mixed broadleaf forests (Table 4). The use of 3-p Weibull function showed higher flexibility (Guo et al., 2022; Yen, 2023) compared to the negative exponential (Gül et al., 2005), beta (Palahí et al., 2007), two-parameter Weibull (Diamantopoulou et al., 2015), log-normal (De Lima et al., 2015), and normal (Şahin and Ercanli, 2023) functions. Consequently, the 3-p Weibull function has been extensively used to explore diameter distribution in plantations (Newton et al., 2005; Lumbres and Lee, 2014; Abino et al., 2016) and mixed forests (Wang et al., 2006; Yang et al., 2022). The 3-p Weibull function provided fitting accuracies for changes in diameter distribution of Acacia mearnsii De Wild. (Sanquetta et al., 2014), Abies fabri (Mast.) Craib and Fagus longipetiolata Seemen mixed conifer-broadleaf forests (Podlaski and Zasada, 2008) that exceeded those of the normal and log-normal functions. A study of diameter distribution of Khaya ivorensis A.Chev. plantations (Mayrinck et al., 2018) found that the 3-p Weibull function provided a fitting accuracy that exceeded those of the beta and gamma functions. Although the present study did not compare different PDFs, many previous studies (Podlaski, 2006; Zhang and Liu, 2006; Yang et al., 2022) have shown that the 3-p Weibull function has high applicability for fitting diameter distribution of different types of mixed forests. Therefore, the present study used the 3-p Weibull function to fit the diameter distribution of mixed broadleaf P. davidiana and B. platyphylla forests, thereby achieving good prediction results (Table 4).
FMM was more suitable for describing the stand-level diameter distribution of mixed broadleaf P. davidiana and B. platyphylla forests compared with the Weibull function constructed by MLE (Table 4); whereas the latter accurately described the species-level diameter distribution, consistent with the results of Yang et al. (2022). Wang et al. (2006) showed that the Weibull function provided a good prediction only for the unimodal diameter distribution, whereas the diameter distribution in mixed forests was typically skewed and multimodal (Podlaski, 2010b; Liu et al., 2014). In contrast, FMM has been shown to provide an improved description of diameter distribution of mixed forests characterized by multiple species, multiple layers, and complex structures (Jaworski and Podlaski, 2012; Podlaski and Roesch, 2014; Ogana, 2018). While FMM has been shown to simultaneously fit stand- and species-level diameter distributions, Liu et al. (2002) found that the Weibull function typically provides a more accurate fit to species-level diameter distributions compared to FMM, consistent with the results of the present study. Some previous studies (Zasada and Cieszewski, 2005; Wang et al., 2006) have shown that overlapping of diameter distribution among species in mixed forests contributed to the low accuracy of predicted species-level diameter distribution based on FMM.
4.2
Factors affecting the diameter distribution function
Dq and BA were the main stand factors affecting the scale and shape parameters of FMM in mixed broadleaf P. davidiana and B. platyphylla forests (Table 5). Dq had significant positive impacts on the scale parameters (p < 0.05); whereas BA had significant positive impacts on the shape parameters (p < 0.05) (Table 5), consistent with the results of previous studies on Picea mariana (Newton et al., 2005), Juniperus formosana Hayata (Diamantopoulou et al., 2015), and Eucalyptus robusta Smith (Schmidt et al., 2020). Dq has been shown to be the main factor affecting the scale (Long et al., 2021) and shape parameters (Abino et al., 2016) of the Weibull function. Miranda et al. (2018) found a negative correlation between Dq and shape parameters, whereas Sun et al. (2019) showed varying relationships between shape parameters and Dq among different species, consistent with the results of the present study in which Dq was significantly positively and negatively correlated with shape parameters γ1 and γ2, respectively. BA has also been shown to be an important factor affecting the scale (Mayrinck et al., 2018) and shape parameters (Schmidt et al., 2020). Previous studies have shown that BA is an important indicator of stand density (Zeide, 2005), and that the diameter distributions of mixed conifer-broadleaf forests have been shown to gradually skew to the left with increasing BA (Sun et al., 2019), inconsistent with the results of the present study. A higher BA is indicative of less space for tree growth (Schmidt et al., 2019), which in turn limits tree growth and leads to a gradual rightward skewing of the diameter distribution of mixed broadleaf P. davidiana and B. platyphylla forests.
Hd has significant (p < 0.05) effects on the shape parameter models of FMM; whereas its effects on the scale parameter models were not significant (p > 0.05) (Table 5, Fig. 2). Newton et al. (2005) demonstrated a significantly negative correlation between Hd and shape parameters. Schmidt et al. (2019) concluded that the growth of DBH within a certain density range was positively correlated with Hd, which in turn led to a gradual leftward skewing of the diameter distribution, inconsistent with the results of the present study. Diameter distributions of lower site quality tend to be a normal distribution during growth and development (Guo and Lei, 2016; Miranda et al., 2018), whereas the asymmetry of stand diameter distribution of a higher site quality increases with increasing age (Schmidt et al., 2020). Therefore, there is an important need for a better understanding of the relationship between site quality and DDF.
IDM had a more significant (p < 0.05) impact on the scale parameters in mixed broadleaf P. davidiana and B. platyphylla forests compared to Im and IP (Table 5, Fig. 3). Previous studies have shown that temperature (Condés et al., 2022) and precipitation (Sanquetta et al., 2014) are important climatic factors affecting the scale parameter, with negative (Guo et al., 2022) and positive (Sanquetta et al., 2014) relationships with the scale parameter, respectively. Some past studies (Novák et al., 2010; Wu et al., 2018) have shown that the scale parameters are typically affected by the simultaneous combined influences of temperature and precipitation, which can be represented by the aridity index (Wu et al., 2023a). While the scale parameter models that incorporated IDM showed a high prediction accuracy, both Im and IP had non-significant effects (p > 0.05) on the scale parameter models. This contradictory result can possibly be attributed to the presence of a higher number of climatic categories in IDM, thereby allowing for a more precise definition of the climatic divisions of the regions (Tabari et al., 2014).
4.3
Re-parameterization methods for the diameter distribution function
The present study re-parameterized the shape and scale parameters of FMM based on OLS, LSUR, and BPNN. The prediction accuracies provided by BPNN exceeded that of OLS and LSUR (Table 6), consistent with the results of Diamantopoulou et al. (2015). Re-parameterizing of the FMM based on OLS required data that satisfied the assumption of independent error terms (Liu et al., 2023; Wu et al., 2023a). However, there was typically a correlation between the error terms of the scale parameter and shape parameter models (Newton et al., 2005), which contributed to the lower prediction accuracy of OLS. In contrast, LSUR allowed the different parameter models to use different independent variables (Rose and Lynch, 2001) and considered the correlations in errors between the shape and scale parameter models (Guo et al., 2022). This contributed to the increased prediction accuracy of LSUR compared to OLS (Table 6). However, application of LSUR typically requires fulfillment of specific statistical assumptions (Xu et al., 2022). Consequently, it has limitations in the choice of model form and multicollinearity tests (Zeng, 2015). BPNN has no requirement for normally distributed or independent data (Che et al., 2019) and consequently can adapt to the characteristics of different datasets (Diamantopoulou et al., 2015; Bayat et al., 2020). As a result, the application of BPNN improved the prediction accuracies of the shape and scale parameter models of the FMM. However, some previous studies (Long et al., 2021; Xu, 2023) have shown that certain factors, such as the number of hidden neuron layers, the form of activation function, and selection of the algorithm, can affect the model accuracy and universality. Future studies should explore different algorithms and techniques to improve the prediction accuracy of the DDF of mixed forests.
4.4
Prediction of stand carbon storage
The present study applied OLS, LSUR, and BPNN to construct scale and shape parameter models for FMM and predicted the biomass and CS of mixed broadleaf P. davidiana and B. platyphylla forests (Table 8, Fig. 4). BPNN showed the highest accuracies in predicting stand biomass and CS. Some previous studies (Yen et al., 2009; Zhang et al., 2014) have shown that the use of DDF is highly flexible and improves the prediction accuracies of stand CS (Qi et al., 2016). In contrast, Yen (2023) found that the accuracy of DDF for predicting stand CS depends largely on the accuracy of the DDF. The results of the present study found that this method has certain errors in predicting CS in the large diameter classes (DBH ≥18 cm) (Fig. 4), consistent with the results of Yang et al. (2022). This pattern can possibly be attributed to deviations in predicted diameter distribution in mixed broadleaf P. davidiana and B. platyphylla forests. The increase in plot size may improve the prediction accuracy of diameter distribution in mixed forests (Janowiak et al., 2008; Sun et al., 2019). The standard land area set in the present study was 0.06 ha, while previous studies have shown that a higher accuracy can be achieved with land areas of 0.04 or 0.06 ha (Liu et al., 2014; Yang et al., 2022). In addition, with the increase of stand age, the proportion of large diameter classes undergoes varying degrees of change (Liu et al., 2002; Schmidt et al., 2019). However, the Weibull distribution can accurately describe the diameter distribution laws of trees of different sizes in various stand types (Zhang et al., 2001; Liu et al., 2014). The precision of the single-tree biomass models (Hussain et al., 2021) and the species carbon coefficients (Yen et al., 2010) during the process of predicting stand CS based on the DDF also affected the model prediction accuracy. Therefore, future studies should further explore the effects of sample plot area, the precision of single-tree biomass models, and species carbon coefficients on the prediction accuracy of stand carbon storage.
5.
Conclusions
FMM was shown to be more suitable for describing stand-level diameter distribution in multi-species, complex structures of mixed broadleaf P. davidiana and B. platyphylla forests; whereas the Weibull function constructed based on MLE was more accurate in fitting species-level diameter distribution. The combined variables of Dq, BA, and Hd improved the accuracy of the shape parameter models of FMM; the combined variables of Dq, BA, and IDM improved the accuracy of the scale parameter models. The scale and shape parameter models incorporating stand factors, site quality, and aridity index based on BPNN showed a higher prediction accuracy compared to those of OLS and LSUR. OLS underestimated stand-level CS in each diameter class; LSUR underestimated CS in the large diameter classes (DBH ≥ 18 cm); OLS, LSUR, and BPNN overestimated the CS of P. davidiana but underestimated the CS of B. platyphylla in the large diameter classes. BPNN showed the highest prediction accuracies for stand- and species-level CS in all diameter classes. Compared with species-level CS, the FMM based on BPNN, which includes stand factors, site quality, and aridity index, is more suitable for estimating stands-level CS, thereby providing a scientific basis for the assessment of CS capacity, improvement of stand productivity, and mitigation of climate change in mixed broadleaf forests.
Availability of data
The data are available from the corresponding author on reasonable request.
The authors declare that they have no known competing financial interests or personal relationships that could have appeared to influence the work reported in this paper.
Acknowledgment
We sincerely thank the handling editor and anonymous reviewers for their valuable comments on our manuscript.
Abino, A.C., Kim, S.Y., Lumbres, R.I.C., Jang, M.N., Youn, H.J., Park, K.H., Lee, Y.J., 2016. Performance of Weibull function as a diameter distribution model for Pinus thunbergii stands in the eastern coast of South Korea. J. Mountain Sci. 13, 822-830. .
Ali, A., Yan, E.R., Chen, H.Y.H., Chang, S.X., Zhao, Y.T., Yang, X.D., Xu, M.S., 2016. Stand structural diversity rather than species diversity enhances aboveground carbon storage in secondary subtropical forests in Eastern China. Biogeosciences 13, 4627-4635. .
Bayat, M., Bettinger, P., Heidari, S., Henareh, K.A., Jourgholami, M., Hamidi, K., 2020. Estimation of tree heights in an uneven-aged, mixed forest in Northern Iran using artificial intelligence and empirical models. Forests 11, 324. .
Cao, Q.V., 2022. Predicting future diameter distributions given current stand attributes. Can. J. For. Res. 52, 561-567. .
Che, S., Tan, X., Xiang, C., Sun, J., Hu, X., Zhang, X., Duan, A., Zhang, J., 2019. Stand basal area modelling for Chinese fir plantations using an artificial neural network model. J. For. Res. 30, 1641-1649. .
Condés, S., del Río, M., Forrester, D.I., Avdagić, A., Bielak, K., Bončina, A., Bosela, M., Hilmers, T., Ibrahimspahić, A., Drozdowski, S., Jaworski, A., Nagel, T.A., Sitková, Z., Skrzyszewski, J., Tognetti, R., Tonon, G., Zlatanov, T., Pretzsch, H., 2022. Temperature effect on size distributions in spruce-fir-beech mixed stands across Europe. For. Ecol. Manag. 504, 119819. .
De Lima, R.A.F., Ferreira, R.A., Batista, Ferreira J.L. Prado, Inacio P., 2015. Modeling tree diameter distributions in natural forests: an evaluation of 10 statistical models. For. Sci. 61, 320-327. .
De Lima, R.B., Bufalino, L., Alves Júnior, F.T., Da Silva, J.A.A., Ferreira R.L.C., 2017. Diameter distribution in a Brazilian tropical dry forest domain: predictions for the stand and species. An. Acad. Bras. Ciênc. 89, 1189-1203. .
Diamantopoulou, M.J., Özçelik, R., Crecente-Campo, F., Eler, Ü., 2015. Estimation of Weibull function parameters for modelling tree diameter distribution using least squares and artificial neural networks methods. Biosyst. Eng. 133, 33-45. .
Ding, S., Su, C., Yu, J., 2011. An optimizing BP neural network algorithm based on genetic algorithm. Artif. Intell. Rev. 36, 153-162. .
Fonseca, T.F., Marques, C.P., Parresol, B.R., 2009. Describing maritime pine diameter distributions with Johnson's SB distribution using a new all-parameter recovery approach. For. Sci. 55, 367-373. .
Fu, L., Lei, Y., Wang, G., Bi, H., Tang, S., Song, X., 2016. Comparison of seemingly unrelated regressions with error-in-variable models for developing a system of nonlinear additive biomass equations. Trees (Berl.) 30, 839-857. .
Fu, L., Sharma, R.P., Wang, G., Tang, S., 2017. Modelling a system of nonlinear additive crown width models applying seemingly unrelated regression for Prince Rupprecht larch in northern China. For. Ecol. Manag. 386, 71-80. .
Gül, A.U., Misir, M., Misir, N., Yavuz, H., 2005. Calculation of uneven-aged stand structures with the negative exponential diameter distribution and Sterba's modified competition density rule. For. Ecol. Manag. 214, 212-220. .
Günther, F., Fritsch, S., 2010. neuralnet: training of neural networks. R J. 2, 30-38. .
Guo, H., Lei, Y.C., 2016. Method comparison of Weibull function for estimating and predicting diameter distribution of Quercus mongolica stands. Sci. Silvae Sin. 52, 64-71. . (in Chinese).
Guo, H., Lei, X.D., Lei, Y., Zeng, W.S., Lang, P.M., Lei, Y.C., 2022. Climate-sensitive diameter distribution models of larch plantations in north and northeast China. For. Ecol. Manag. 506, 119947. .
Henningsen, A., Hamann, J.D., 2008. systemfit: a package for estimating systems of simultaneous equations in R. J. Stat. Software 23, 1-40. .
Hussain, M., Lin, Z.R., Yen, T.M., Lin, C.C., 2021. Application of models to predict stand volume, aboveground biomass accumulation, and carbon storage capacity for a Konishii fir (Cunninghamia konishii Hayata) plantation in central Taiwan. Forests 12, 1406. .
Jahangir, M.H., Danehkar, S., 2022. A comparative drought assessment in Gilan, Iran using Pálfai drought index, de Martonne aridity index, and Pinna combinative index. Arabian J. Geosci. 15, 90. .
Janowiak, M.K., Nagel, L.M., Webster, C.R., 2008. Spatial scale and stand structure in northern hardwood forests: implications for quantifying diameter distributions. For. Sci. 54, 497-506. .
Jaworski, A.P., Podlaski, R., 2012. Modelling irregular and multimodal tree diameter distributions by finite mixture models: an approach to stand structure characterisation. J. For. Res. 17, 79-88. .
Jiang, P., Zhang, S.X., Ren, J.J., Wang, X.P., Meng, J.H., Gu, J.C., Lu, G.Q., 2015. Biomass and carbon fixation ability of typical larch-poplar and betula mixed forest in Mulanweichang. Acta Ecol. Sin. 35, 2937-2945. . (in Chinese).
Lee, Y.J., Coble, D.W., 2006. A new diameter distribution model for unmanaged loblolly pine plantations in East Texas. South. J. Appl. Finance 30, 13-20. .
Liu, C.M., Zhang, L.J., Davis, C.J., Solomon, D.S., Gove, J.H., 2002. A finite mixture model for characterizing the diameter distributions of mixed-species forest stands. For. Sci. 48, 653-661. .
Liu, C.M., Zhang, S.Y., Lei, Y., Newton, P., Zhang, L.J., 2011. Evaluation of three methods for predicting diameter distributions of black spruce (Picea mariana) plantations in central Canada. Can. J. For. Res. 34, 2424-2432. .
Liu, Y., Wang, D., Zhang, Z., Liu, Q., Zhang, D., Xu, Z., 2023. Modeling free branch growth with the competition index for a Larix principis-rupprechtii Plantation. Forests 14, 1495. .
Long, S., Zeng, S., Wang, G., 2021. Developing a new model for predicting the diameter distribution of oak forests using an artificial neural network. Ann. For. Res. 64, 3-20. .
Lumbres, R.I.C., Lee, Y.J., 2014. Percentile-based Weibull diameter distribution model for Pinus kesiya stands in Benguet province, Philippines. South. For. 76. 117-123. .
Manso, R., Morneau, F., Ningre, F., Fortin, M., 2015. Effect of climate and intra- and inter-specific competition on diameter increment in beech and oak stands. Forestry 88, 540-551. .
Mayrinck, R.C., Filho, A.C.F., Ribeiro, A., De Oliveira, X.M., De Lima, R.R., 2018. A comparison of diameter distribution models for Khaya ivorensis A. Chev. plantations in Brazil. South. For. 80, 373-380. .
Miranda, R., Fiorentin, L., Netto, S., Juvanhol, R., Corte, A., 2018. Prediction system for diameter distribution and wood production of eucalyptus. Floresta e Ambiente 25, e20160548. .
Moral, F.J., Rebollo, F.J., Paniagua, L.L., García-Martín, A., Honorio, F., 2016. Spatial distribution and comparison of aridity indices in Extremadura, southwestern Spain. Theor. Appl. Climatol. 126, 801-814. .
Newton, P.F., Lei, Y., Zhang, S.Y., 2005. Stand-level diameter distribution yield model for black spruce plantations. For. Ecol. Manag. 209, 181-192. .
Novák, J., Slodičák, M., Kacálek, D., Dušek, D., 2010. The effect of different stand density on diameter growth response in Scots pine stands in relation to climate situations. J. For. Sci. 56, 461-473. .
Ogana, F.N., 2018. Application of finite mixture to characterise degraded Gmelina arborea Roxb plantation in Omo forest reserve, Nigeria. J. For. Environ. Sci. 34, 451-456. .
Özçelik, R., Fidalgo Fonseca, T.J., Parresol, B.R., Eler, Ü., 2016. Modeling the diameter distributions of Brutian pine stands using Johnson's SB distribution. For. Sci. 62, 587-593. .
Özçelik, R., Cao, Q.V., Trincado, G., Göçer, N., 2018. Predicting tree height from tree diameter and dominant height using mixed-effects and quantile regression models for two species in Turkey. For. Ecol. Manag. 419–420, 240-248. .
Palahí, M., Pukkala, T., Blasco, E., Trasobares, A., 2007. Comparison of beta, Johnson's SB, Weibull and truncated Weibull functions for modeling the diameter distribution of forest stands in Catalonia (north-east of Spain). Eur. J. For. Res. 126, 563-571. .
Pan, Y., Wang, Y., Zhou, P., Yan, Y., Guo, D., 2020. Activation functions selection for BP neural network model of ground surface roughness. J. Intell. Manuf. 31, 1825-1836. .
Pekin, B.K., Boer, M.M., Macfarlane, C., Grierson, P.F., 2009. Impacts of increased fire frequency and aridity on eucalypt forest structure, biomass and composition in southwest Australia. For. Ecol. Manag. 258, 2136-2142. .
Podlaski, R., 2006. Suitability of the selected statistical distributions for fitting diameter data in distinguished development stages and phases of near-natural mixed forests in the Świętokrzyski National Park (Poland). For. Ecol. Manag. 236, 393-402. .
Podlaski, R., Zasada, M., 2008. Comparison of selected statistical distributions for modelling the diameter distributions in near-natural Abies–Fagus forests in the Świętokrzyski National Park (Poland). Eur. J. For. Res. 127, 455-463. .
Podlaski, R., 2010a. Diversity of patch structure in Central European forests: are tree diameter distributions in near-natural multilayered Abies–Fagus stands heterogeneous? Ecol. Res. 25, 599-608. .
Podlaski, R., 2010b. Two-component mixture models for diameter distributions in mixed-species, two-age cohort stands. For. Sci. 56, 379-390. .
Podlaski, R., Roesch, F.A., 2014. Modelling diameter distributions of two-cohort forest stands with various proportions of dominant species: a two-component mixture model approach. Math. Biosci. 249, 60-74. .
Poudel, K.P., Cao, Q.V., 2013. Evaluation of methods to predict Weibull parameters for characterizing diameter distributions. For. Sci. 59, 243-252. .
Qi, L., Liu, X., Jiang, Z., Yue, X., Li, Z., Fu, J., Liu, G., Guo, B., Shi, L., 2016. Combining diameter-distribution function with allometric equation in biomass estimates: a case study of Phyllostachys edulis forests in South Anhui, China. Agrofor. Syst. 90, 1113-1121. .
Qin, H., Zhou, W., Yao, Y., Wang, W., 2021. Estimating aboveground carbon stock at the scale of individual trees in subtropical forests using UAV LiDAR and hyperspectral data. Remote Sens. 13, 4969. .
Rose, C.E., Lynch, T.B., 2001. Estimating parameters for tree basal area growth with a system of equations and seemingly unrelated regressions. For. Ecol. Manag. 148, 51-61. .
Şahin, A., Ercanli, I., 2023. An evaluation of various probability density functions for predicting diameter distributions in pure and mixed-species stands in Türkiye. For. Syst. 32, e016. .
Sanquetta, C.R., Behling, A., Corte, A.P.D., Netto, S.P., Rodrigues, A.L., Simon, A.A., 2014. A model based on environmental factors for diameter distribution in black wattle in Brazil. PLoS One 9, e100093. .
Şarlak, N., Mahmood Agha, O.M.A., 2018. Spatial and temporal variations of aridity indices in Iraq. Theor. Appl. Climatol. 133, 89-99. .
Schmidt, L.N., Machado, S.D.A., Pelissari, A.L., De Silva, G.F., 2019. Dynamics of eucalyptus diameter distribution in the state of Minas Gerais. Floresta e Ambiente 26, e20170156. .
Schmidt, L.N., Sanquetta, M.N.I., McTague, J.P., da Silva, G.F., Filho, C.V.F., Sanquetta, C.R., Scolforo, J.R.S., 2020. On the use of the Weibull distribution in modeling and describing diameter distributions of clonal eucalypt stands. Can. J. For. Res. 50, 1050-1063. .
Sun, S., Cao, Q.V., Cao, T., 2019. Characterizing diameter distributions for uneven-aged pine-oak mixed forests in the Qinling Mountains of China. Forests 10, 596. .
Tabari, H., Talaee, P.H., Nadoushani, M.S.S., Willems, P., Marchetto, A., 2014. A survey of temperature and precipitation based aridity indices in Iran. Quat. Int. 345, 158-166. .
Tetemke, B.A., Birhane, E., Rannestad, M.M., Eid, T., 2021. Species diversity and stand structural diversity of woody plants predominantly determine aboveground carbon stock of a dry Afromontane forest in Northern Ethiopia. For. Ecol. Manag. 500, 119634. .
Tijerín-Triviño, J., Moreno-Fernández, D., Zavala, M.A., Astigarraga, J., García, M., 2022. Identifying forest Structural types along an aridity gradient in Peninsular Spain: integrating low-density LiDAR, forest inventory, and aridity index. Rem. Sens. 14, 235. .
Trifković, V., Bončina, A., Ficko, A., 2022. Analyzing asymmetries in the response of European beech to precipitation anomalies in various stand and site conditions using decadal diameter censuses. Agric. For. Meteorol. 327, 109195. .
Wang, S., Dai, L., Liu, G., Yuan, J., Zhang, H., Wang, Q., 2006. Modeling diameter distribution of the broadleaved-Korean pine mixed forest on Changbai Mountains of China. Sci. China, Ser. E: Technol. Sci. 49, 177-188. .
Wang, J.J., He, T., Xu, G.M., Xu, H.L., Li, B.W., 2023b. Effects of selective cutting on the structure of natural forest in Burqin Mountainous Land. J. Agric. Sci. Technol. 25, 217-226. .
Wang, D., Zhang, Z., Zhang, D., Huang, X., 2023a. Biomass allometric models for Larix rupprechtii based on Kosak's taper curve equations and nonlinear seemingly unrelated regression. Front. Plant Sci. 13, 1056837. .
Wang, W., Zhou, W., Wang, H., Ji, C., Han, S., 2017. Organic carbon and nitrogen dynamics in different soil fractions between broad-leaved Korean pine forests and aspen–birch forests in northeastern China. J. Soils Sediments 17, 2257-2273. .
Wu, D.Y., Dou, X.W., Tang, M.P., 2023a. Relationship between carbon stock and the structure of coniferous and broad-leaved mixed forest in Tian-mu Mountain, China. Chin. J. Appl. Ecol. 34, 2029-2038. . (in Chinese).
Wu, W., Wang, D., Zhang, D., 2023b. Aridity index and quantile regression influences on the maximum size-density relationship for coniferous and broad-leaved mixed forests. For. Ecol. Manag. 543, 121148. .
Wu, W.J., Xu, H., Huang, M.Q., Li, C., Lv, Y.Y., Wei, A.C., Xiong, H.X., Ou, G.L., 2018. Stand diameter structure and environmental explanation for Pinus kesiya var. langbianensis natural mature forests. J. Cent. South Univ. For. Technol. 38, 41-49. . (in Chinese).
Xu, Q.G., Lei, X.D., Zhang, H.R., 2022. A novel method for approaching the compatibility of tree biomass estimation by multi-task neural networks. For. Ecol. Manag. 508, 120011. .
Xu, Q.G., Lei, X.D., Zheng, Y., Hu, X.G., Lei, Y.C., He, X., 2023. A new activation function based on Richards equation for tree height-diameter deep neural network model of Abies nephrolepis. Sci. Silv. Sin. 59, 50-56. . (in Chinese).
Yang, S.I., Cao, Q.V., Shoch, D.T., Johnson, T., 2022. Characterizing stand and biomass tables from diameter distribution models: a case study for mixed-hardwood forests in Eastern Tennessee, USA. For. Sci. 68, 8-16. .
Yen, T.M., Ai, L.M., Li, C.L., Lee, J.S., Huang, K.L., 2009. Aboveground carbon contents and storage of three major Taiwanese conifer species. Taiwan J. For. Sci. 24, 91-102. . (in Chinese).
Yen, T.M., Ji, Y.J., Lee, J.S., 2010. Estimating biomass production and carbon storage for a fast-growing Makino bamboo (Phyllostachys makinoi) plant based on the diameter distribution model. For. Ecol. Manag. 260, 339-344. .
Yen, T.M., 2023. Predicting aboveground biomass yield for Moso bamboo (Phyllostachys pubescens) plantations based on the diameter distribution model. Eur. J. For. Res. 142, 1341-1351. .
Yu, Y., 2022. mixR: an R package for finite mixture modeling for both raw and binned data. J. Open Source Softw. 7, 4031. .
Zasada, M., Cieszewski, C.J., 2005. A finite mixture distribution approach for characterizing tree diameter distributions by natural social class in pure even-aged Scots pine stands in Poland. For. Ecol. Manag. 204, 145-158. .
Zeide, B., 2005. How to measure stand density. Trees (Berl.) 19, 1-14. .
Zeng, W.S., 2015. Using nonlinear mixed model and dummy variable model approaches to develop origin-based individual tree biomass equations. Trees (Berl.) 29, 275-283. .
Zhang, H., Zhuang, S., Sun, B., Ji, H., Li, C., Zhou, S., 2014. Estimation of biomass and carbon storage of Moso bamboo (Phyllostachys pubescens Mazel ex Houz.) in southern China using a diameter–age bivariate distribution model. Forestry 87, 674-682. .
Zhang, L.Z., Gove, J.H., Liu, C.M., Leak, W.B., 2001. A finite mixture of two Weibull distributions for modeling the diameter distributions of rotated-sigmoid, uneven-aged stands. Can. J. For. Res. 31, 1654-1659. .
Zhang, L.Z., Liu, C.M., 2006. Fitting irregular diameter distributions of forest stands by Weibull, modified Weibull, and mixture Weibull models. J. For. Res. 11, 369-372. .
Zhou, G.Y., Yin, G.C., Tang, X.L., 2018. Carbon Storage in Chinese Forest Ecosystems-Biomass Equation, 1st edn. Science Press, Beijing.
Table
2.
Statistics of climate factors (1971–2022) of Mulan Rangeland State Forest.
Variable
Min
Max
Mean
SD
P (mm)
249.1
648.1
446.3
91.4
MAT (℃)
4.0
6.5
5.4
0.7
Pd (mm)
0.0
10.6
2.4
2.8
Td (℃)
−15.8
−8.0
−11.5
1.5
Tmax (℃)
30.2
39.4
33.4
1.8
Tmin (℃)
−32.3
−20.0
−24.9
2.3
Notes: P: annual precipitation; MAT: annual mean temperature; Pd: precipitation of the driest month; Td: mean temperature of the driest month; Tmax: annual maximum temperature; Tmin: annual minimum temperature.
Table
5.
Evaluation of the prediction accuracy of stand factors, site quality and aridity index on the scale and shape parameter models in FMM.
Re-parameterized model
AIC
MAE
RMSE
R2
R2adj
β1s = −2.969 + 1.086Dq – 0.038BA
208.697
3.150
4.133
0.847
0.840
β1c = −0.466 + 1.076Dq – 0.025BA – 0.094IDM
206.268
3.142
4.111
0.860
0.851
γ1s = 3.107 + 0.073Dq + 0.068BA
142.169
2.091
2.583
0.315
0.285
γ1c = 2.867 + 0.017Dq + 0.067BA + 0.071Hd
140.921
2.068
2.580
0.342
0.298
β2s = 2.907 + 0.405Dq + 0.038BA
237.342
6.358
7.454
0.350
0.322
β2c = −0.613 + 0.427Dq + 0.018BA + 0.132IDM
234.437
6.286
7.431
0.412
0.373
γ2s = 3.973 – 0.073Dq + 0.077BA
104.932
3.585
4.760
0.252
0.219
γ2c = 3.982 – 0.071Dq + 0.078BA – 0.003Hd
102.935
3.579
4.753
0.279
0.231
Notes: β1s, β2s: Re-parameterized scale parameter models with stand factors; β1c, β2c: Re-parameterized scale parameter models with stand factors and De Martonne aridity index; γ1s, γ2s: Re-parameterized shape parameter models with stand factors; γ1c, γ2c: Re-parameterized shape parameter models with stand factors and site quality.

 DownLoad:


 Email Alerts
 RSS Feeds