Yuyang Xie, Zehao Shen, Xuejing Wang, Liu Yang, Jie Zhang. Plant life form determines spatiotemporal variability and climate response of plant seed rain in subtropical forests[J]. Forest Ecosystems, 2024, 11(1): 100181. DOI: 10.1016/j.fecs.2024.100181
Citation:
Yuyang Xie, Zehao Shen, Xuejing Wang, Liu Yang, Jie Zhang. Plant life form determines spatiotemporal variability and climate response of plant seed rain in subtropical forests[J]. Forest Ecosystems, 2024, 11(1): 100181. DOI: 10.1016/j.fecs.2024.100181
Yuyang Xie, Zehao Shen, Xuejing Wang, Liu Yang, Jie Zhang. Plant life form determines spatiotemporal variability and climate response of plant seed rain in subtropical forests[J]. Forest Ecosystems, 2024, 11(1): 100181. DOI: 10.1016/j.fecs.2024.100181
Citation:
Yuyang Xie, Zehao Shen, Xuejing Wang, Liu Yang, Jie Zhang. Plant life form determines spatiotemporal variability and climate response of plant seed rain in subtropical forests[J]. Forest Ecosystems, 2024, 11(1): 100181. DOI: 10.1016/j.fecs.2024.100181
MOE Laboratory for Earth Surface Processes, Institute of Ecology, College of Urban and Environmental Sciences, Peking University, Beijing, 100871, China
Funds:
the Second Tibetan Plateau Scientific Expedition and Research Program (STEP)2019QZKK0402
Spatiotemporal variation of seed rain reflects the response of plants in terms of their reproductive strategy to environmental gradients. In this study, we collected seeds from four sites in the Dalaoling Nature Reserve, Hubei Province, China, between 2011 and 2014, measured seed output and seed mass as seed rain traits, and compared their interannual and elevational variation. Then, we ran phylogenetic generalized mixed linear models (PGLMMs) to explore the effects of temperature and precipitation as well as interspecific differences on seed rain, and fitted the best regression models for seed rain vs. weather of canopy and understory species. The results showed no correlation between values of seed output and seed mass. However, the variation of the two traits showed significantly positive correlation. Seed output of canopy species generally decreased with increasing elevation, and showed significant interannual difference; however, seed output of understory species and seed mass for both canopy and understory species did not show consistency tends along elevational or in interannual variation. Seed output was significantly affected by temperature and precipitation, while seed mass mainly varied due to interspecific differences. Weather explained more the variation of the seed output of canopy species than that of understory species, with R2 values of 43.0% and 29.9%, respectively. These results suggested that canopy plants contributed more to the reproductive dynamics of the whole communities, and the canopy's buffer effect on the underground weakened the response of understory plants to weather variation in terms of their reproductive strategy.
Seed production, dispersal, and germination are key phases of the plant life cycle (Chen et al., 2020; Dylewski et al., 2020; Wang and Smith, 2002). The expression "seed rain" is a vivid description of the diffusion of plant propagules and dispersal agents (Rodrigues, 2002). It refers to groups of seeds falling from the mother plant in a specific area and at a specific time, pointing to seed dynamics originating within local sites rather than from external input (Nunez et al., 2021). Seed rain is a primary source of new individuals and species recruitment (Bona et al., 2020) and connects plant reproduction to subsequent life cycle stages (Nathan and Muller-Landau, 2000), controlling community regeneration (Turnbull and Rees, 2000; Yang et al., 2023). Among the traits related to seed rain, seed size (i.e., single seed mass) represents the content of nutrients in seeds (Ruiz et al., 1997) and is associated with dispersal distance, the life span of the seed bank, the success rate of plant colonization, and reproductive capacity (Leishman et al., 2000; Shimada et al., 2015; Wahid and Bounoua, 2013). The number of seeds in seed rain (i.e., the seed output) is also an important trait, and its temporal and spatial dynamics have a significant impact on forest regeneration and community composition and structure (Schupp, 1990; Wang et al., 2020b). The composition and size of seed rain are characterized by significant spatiotemporal heterogeneity (Rother et al., 2009) because of different levels of species diversity and environmental factors (Froes et al., 2020; Procknow et al., 2020) as well as interannual fluctuation of climate (Urbanska and Fattorini, 2000; Wang et al., 2022).
Spatial differences reflect variations in environmental gradients and, in particular, studies have increasingly focused on the relationship between seed rain and altitude (Abreu et al., 2021; Guo et al., 2017). Changes in altitude reflect landscape and climate differences at the regional scale. Every 1,000 m increase in elevation temperature will decrease by 6 ℃ (Li et al., 2015a), significantly affecting the relationship between plants and the environment. However, the relationships between altitude and each of the two traits (seed mass and seed output) are still controversial. An early study conducted on the California mountains showed that, as altitude increased, the plants' growing season shortened, leading to a decrease in seed mass (Baker, 1972); however, later studies found no significant change in seed mass with elevation (Gera et al., 2000; Holm, 1994; Kaya and Temerit, 1994). Moreover, a significant negative correlation between seed mass and altitude was found for 570 alpine grassland plants species in the eastern Qinghai-Tibet Plateau (Bu et al., 2007). Another study of Saussurea undulata in the eastern edge of the Qinghai-Tibet Plateau revealed that, as altitude increased, seed output decreased, while seed mass increased (Wang and Yue, 2014). In addition, a study conducted in the subtropical Brazilian Atlantic Forest found that seed mass diversity decreased with altitude (Klipel et al., 2023). Therefore, the relationship between seed rain and altitude varies in different regions and is not consistent among studies. Two hypotheses can be made in this regard: the first relates to energy constraints and suggests that the lower temperature and shorter growing season at higher altitudes may reduce the photosynthetic rate and energy available for seed development, resulting in lower seed quality (Baker, 1972; Bu et al., 2007); the second relates to stress tolerance and suggests that seed size has a certain impact on the seedling establishment, as larger seeds can produce stronger seedlings, which may promote germination and survival (Leishman et al., 2000; Westoby, 2004). Species would invest greater resources into higher quality offspring able to survive in harsh environments.
When considering the temporal scale, it is noteworthy that numerous tree species in the forest community do not produce seeds every year (Yang et al., 2023). Due to differences in climate or weather conditions, especially temperature and precipitation during the growing season, the seed setting ability of species is also different, resulting in a pronounced inter-annual variation of seed output (Ishihara and Kikuzawa, 2009; Rapp et al., 2013), which is defined as the alternate occurrence of "mast seed years" and "lean seed years" (Kawada and Maruyama, 1986; Singh et al., 2010). The time interval is more than, or equal to, 1 year, and numerous species, including tropical and temperate forest trees or herbs, exhibit such variation (Schnurr et al., 2010). For example, the interval in the temperate forest of Michigan is generally 3–5 years (McEuen and Curran, 2004), that in tropical rainforests in southeast Asia is usually 3–8 years (Appanah, 1985, 1993; Ashton et al., 1988), and three large-scale seed setting events have been reported in the tropical rain forest of Borneo, Indonesia, over the past 10 years (Brearley et al., 2007).
At present, it is difficult to establish a general law that can describe the interannual and altitudinal gradients of seed rain variation because field experiments are laborious and the identification of seed species is challenging (Xu et al., 2012). Species with different life forms occupy different niches, i.e., the canopy or understory layer, experiencing different microenvironments. However, studies of seed rain have rarely focused on the comparison between different species or life forms in forests and their association with environmental gradients. Based on seed rain data collected from 2011 to 2014 in four 1-ha sample plots placed at different altitudes in the Three Gorges Dalaoling Nature Reserve, China, our study quantified the temporal and spatial differences in seed rain output and mass between "mast years" and "lean years", as well as the spatial differences with altitudinal gradients. The following three questions are to be answered: 1) How do seed rain traits change in response to elevational and interannual variation? 2) Is there any correlation between different seed traits and their spatiotemporal variation? 3) How does temperature and precipitation affect the production of seeds by species with differing traits? And 4) are there any differences in the obtained results between different life forms?
2.
Methods and material
2.1
Study site
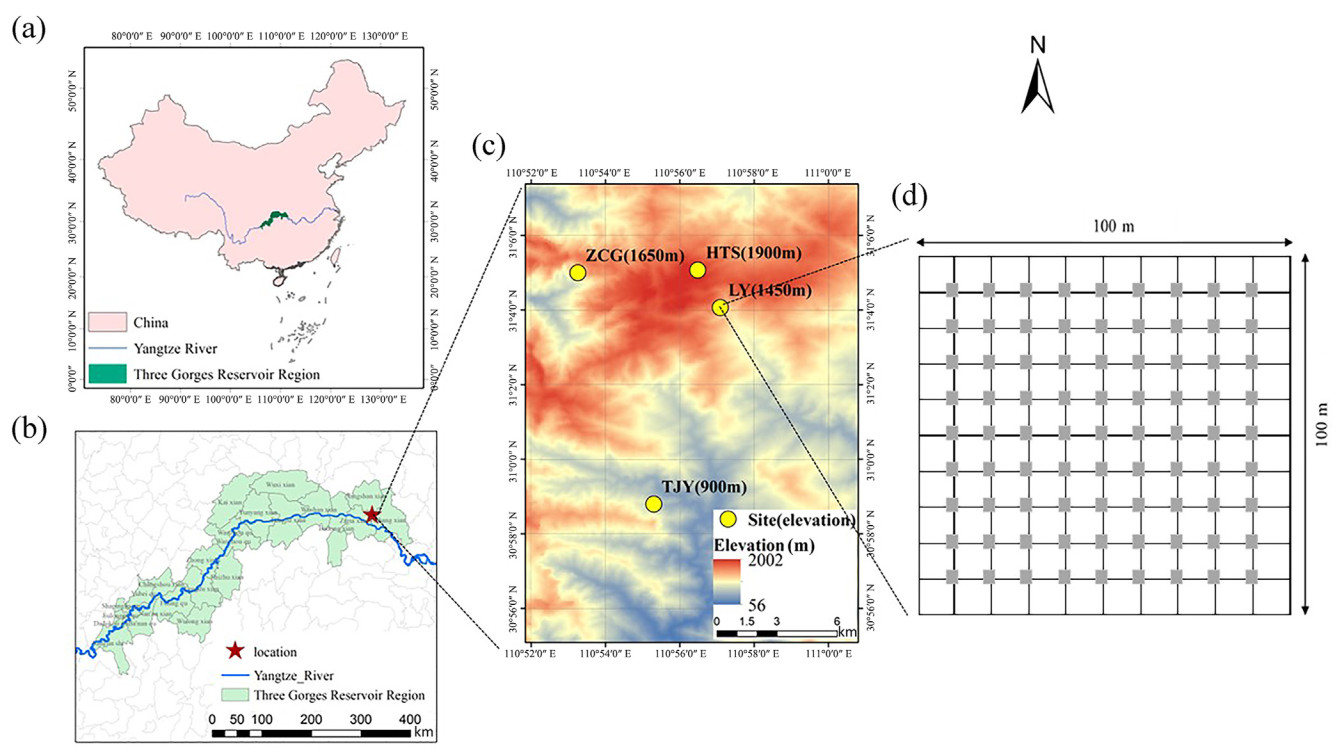
This study was conducted at the Dalaoling Nature Reserve (110°52′–111°0′ E, 31°01′–31°08′ N) on the eastern side of the Daba Mountains in the Three Gorges Reservoir area, China (Fig. 1). In this region, the climate varies from the typical subtropical climate in the valley to the warm temperate humid monsoon climate near mountain peaks. Each of the four 1-ha plots used was placed at different altitudes, i.e., 900, 1,450, 1,650, and 1,900 m a.s.l., for a total of four sampling sites, named Tanjiaya (TJY), Liangya (LY), Zhucaogou (ZCG), and Hentianshi (HTS), respectively. The basic plant community composition at each site was as follows: TJY (900 m a.s.l.), secondary deciduous broad-leaved forest with Castanea henryi and Corylopsis sinensis as dominant species; LY (1,450 m a.s.l.), evergreen deciduous broad-leaved mixed forest with Fagus lucida and Pieris formosa as dominant species; ZCG (1,650 m a.s.l.), evergreen deciduous broad-leaved mixed forest with Castanea seguinii and Cyclobalanopsis myrsinifolia as dominant species; and HTS (1,900 m a.s.l.), deciduous broad-leaved forest with Fagus engleriana and C. seguinii as dominant species.
Figure
1.
Maps of the study area and illustration of the sample plot used. (a), (b) and (c), location of the Three Gorges Reservoir Region and the four study sites: Tanjiaya (TJY), Liangya (LY), Zhucaogou (ZCG), and Hentianshi (HTS); (d) schematic diagram of the seed rain collection frame placed in each site. Gray squares represent the seed rain collection frame.
The 100 m × 100 m plots (projection area of 1 ha) were set up in the chosen sites (Fig. 1d). Their boundaries were accurately measured using a theodolite (BDT-2L, Beijing) and laser rangefinder (DISTO D5, Leica, USA), and cement piles were embedded at 20 m intervals to calibrate vertical and horizontal coordinates. Then, 10 m × 10 m quadrats were used as investigation units to record the species of plants with diameter at breast height > 2.0 cm. Seed collectors were placed in each plot to cover an area of 1 m2 according to the form shown in Fig. 1d. A seed collector was a round basket with an area of 1 m2 made of thick iron wires and equipped with a 0.6 m deep pocket made of plastic gauze with an aperture of 1 mm. To prevent the collected seeds from being eaten by rodents, the collectors were set up so that the top center was 1 m above the ground.
Seeds were collected from the beginning to the end day of seed rain of each year from 2011 to 2014. According to preliminary experimental observations, most of the seed rain in the study area began in early August (Xu et al., 2012), therefore, the collection of seed rain began from the first week of August and stopped when no new seed was found in all collectors for four consecutive observations (Yang et al., 2023). The litter and other debris in each seed collector were removed upon collection every 3–10 days until the last day of seed rain (Yang et al., 2023). Seeds were obtained from a total of 64 species, i.e., 30.6% of all woody plant species were collected in all seed collectors, which occupied 0.8% of the 1-ha plot areas. 29 species were identified as belonging to 25 genera and 20 families; specifically, 6 belonged to Fagaceae, 2 to Cornaceae, 2 to Rhododendraceae, 3 to Lauraceae, and 16 to 16 other families. In 2013 and 2011, 11,412 and 7,054 seeds were collected, respectively, accounting for 40.7% and 25.2% of the total seeds harvested during the 4 years, respectively, while in 2012 and 2014, the seeds collected were 5,447 and 4,103, accounting for 19.4% and 14.7% of the total 4-year harvest, respectively. The species richness of seed rain samples collected in 2013 was the highest, with 39 species, followed by that of samples collected in 2011 (34 species). In 2012 and 2014, the seed rain species richness was the lowest, reaching only 20 species per year.
Seeds were usually collected from fruits, were cleaned in the laboratory to remove impurities, and their peel was removed after soaking in water for 24 h. The cleaned seeds were placed in a ventilated place for 2 weeks and left to dry naturally; then, they were counted and weighed using an electronic balance with an accuracy of 0.01 g. To reduce measurement errors, the average weight of seeds belonging to the same species and collected from the same collector was recorded as the estimate of individual seed mass.
2.3
Seed rain trait
We measured seed output and seed mass as variables of seed rain trait (SRT) in this study.
Seed output was count of each plant species collected from each site in each year. In order to eliminate the influence of community composition on the number of seeds, in each community, we calculated the ratio of the actual seed number collected to the importance values of each species as seed output. The importance values were the mean relative density, relative frequency, and relative dominance of each species. Specifically, these three parameters were defined, respectively, as the proportion of individuals of a species to the total number of individuals in a community; the proportion of number of communities the particular species occurred to the total number of communities; and the ratio of the sum basal area of a particular plant species to all plants in a community.
Seed mass indicated the average seed mass of each plant species collected from each site during each year. The environmental coefficient of variation (ECV) was used to measure whether and to what degree environmental change (different elevations or different years) influenced the coefficient of variation within species (Wang et al., 2020a), in other word, to define whether the variability in seed mass of a certain species is caused by environmental differences under temporal and elevational changes, or by individual randomness. It was calculated using Eq. 1:
ECV=σμ−1nn∑i=1σiμi
(1)
For each species, σ and μ represent the standard deviation and mean value of seed mass, respectively, across all elevations in the same year or for all years within the same site; i is the number of sites or years. Positive values indicated that species varied more across environments than within communities, only this case will be used for the following analysis, while negative values indicated the opposite. Seed output and mass were log10-transformed in this study (Wang et al., 2020a).
2.4
Temperature and precipitation data
The weather data were collected from seven meteorological stations within the reserve near the sample sites. The altitudes of these meteorological stations are 215, 755, 990, 1,280, 1,600, 1,910, 1,919 m. Due to the close horizontal distance between meteorological stations and the sample plots, the temperature and precipitation condition differences between stations reflected mainly the elevational differences. Therefore, we used linear models between the weather factors and elevation to interpolate the values of temperature and precipitation at all sample plots (Yang et al., 2023), which allowed to determine the monthly temperature and precipitation for each site from Jan 2011 to Dec 2014. The monthly data were translated to multiple weather indicators, as shown in Table S1. Considering that SRTs may be related to the climate of the previous year, the same indicators were also calculated for the years prior to those in which seed rain occurred.
2.5
Data analysis
2.5.1
Seed rain traits and their spatiotemporal variation
To describe the correlations between SRTs and their variation and explore the trade-off between traits, we firstly conducted standard linear regression analysis ("lm" function in R v4.5.0) between (1) seed output and seed mass values, (2) elevational variation of seed output and seed mass, and (3) interannual variation of seed output and seed mass. To compare the above correlations between different life forms, all species obtained were divided into two groups, i.e., canopy species (trees) and understory species (short trees and shrubs), and the linear regression was performed respectively. The elevational and interannual variations of seed output and mass were calculated using the methods reported below.
The slopes of seed output (So) and seed mass (Sm) were calculated to measure the variation rate of these two traits for each species along the elevation gradient during the same year using Eq. 2, it was calculated as the difference ratio in seed mass or output at each two elevations for each species in the same year to the difference in elevation:
So,m=SRTa−SRTbHa−Hb
(2)
SRTa and SRTb were seed output or mass of the same species from each two sample plots in the same year, Ha and Hb were elevation of the two sample plots. To explore whether the rate of elevational variation was significant, the mean values of So and Sm were separately calculated for each species. Positive mean values indicated the traits generally increased with increasing elevation, while negative values indicated the opposite. Subsequently, the student's t-test ("t.test" function in R v4.5.0) was used to test whether the mean values were significantly different from 0. The above analysis was also performed for the two different life forms (i.e., canopy and understory species).
Difference of seed output (Do) and difference of seed mass (Dm) were defined to measure the interannual variation of these two traits for each species along the same elevation gradient. This variation was calculated as seed trait of a same species difference between each two years in a same plot. To explore whether the rate of interannual variation was significant, following analysis is the same as above method for elevational variation, noted that student's t-test was only used for Do and Dm from lean seed year to mast seed year. The definition of lean seed year and mast seed year is based on the sum seed output in each year (Yang et al., 2023), as well as the number of species from which seeds were collected. In this study, we defined 2011 and 2013 were relative mast seed year while 2012 and 2014 were relative lean seed year. Above analysis was also performed for different life form groups. It should be noticed that data sets of 20 or more years are usually needed to statistically define mast years. However, in this study, we only have four years of data. We focus more on the interannual variability instead of the specific definition of mast seeding, therefore, the mast and lean here are relative during these 4 years (Xu et al., 2012).
2.5.2
Response of SRTs to temperature and precipitation
The relationships between weather change and SRTs were further examined. In past studies, climatic or weather variables like temperature and precipitation during the summer and growing season as well as spring precipitation were shown to contribute to seed rain in temperate or high latitudes (Bogdziewicz et al., 2020; Buechling et al., 2016). However, few relevant studies have been conducted in subtropical areas. In the present study, in addition to the above climate temperature and precipitation indicators, winter temperature and precipitation, as well as other parameters (see details in Table S1) were included. A strong multicollinearity was detected among indicators (Fig. S1), and principal component analysis (PCA) was carried out for temperature and precipitation to simplify variables. The results are shown in Table S2 and Fig. S2. The component scores in PC2 were defined as temperature and precipitation in winter (Twin, Pwin), while those in PC1 were defined as temperature and precipitation in the warmer season or total year (T, P).
Then, PGLMMs were conducted to fit the relationship between each SRT and weather variables. The models were built using the "pglmm" function of the R package "phyr" (Li et al., 2020). The weather variables in fixed effect factors of the model included indicators during seed dispersal years (T, P, Twin, and Pwin) as well as during the years before seed dispersal (T0, P0, Twin0, and Pwin0). However, same indicators were highly correlated between years (such as T and T0) and could not be reliably combined in the same model (Dormann et al., 2013). Indicators before seed dispersal were hence included in the model as the residual variation in which after removal of variation of the same indicators during seed dispersal. The residual was extracted from simple linear regressions with T0, P0, Twin0 or Pwin0 as the dependent variable and T, P, Twin or Pwin as the predictor variable only, respectively (Yang et al., 2023). The random factors were plant species and the correlation matrix of species phylogeny, which may affect trait variation (Kubelka et al., 2018). The "phylo.maker" function in the R package "V.PhyloMaker" (Jin and Qian, 2019) was used to build a phylogenetic tree of all plant species, and, subsequently, the "vcv.phylo" function in the R package "ape" was used to construct a phylogenetic matrix based on the clade branch lengths in the phylogenetic tree (Paradis et al., 2004). Then, the marginal and conditional R2 values were calculated as the variance explained by fixed factors and variance explained by fixed factors plus random factors, respectively. The marginal R2 was calculated by dividing the variance of fixed factors in the mixed-effects model by the variance in the total model (Yang et al., 2023).
To compare the temperature and precipitation response of SRTs between life forms, stepwise linear regression ("lm" and "step" functions in R v4.5.0) was conducted for canopy and understory species, respectively. The initial independent variables also included indicators during seed dispersal years (T, P, Twin, and Pwin) and years before seed dispersal (T0, P0, Twin0, and Pwin0). The Akaike information criterion (AIC) was used to select the most parsimonious models. The two life forms were compared with the composition of independent variables of the best models, and sensitivity to temperature and precipitation variations according to the standardized regression coefficient. Here we use stepwise LM instead of using PGLMM for the following reasons: (1) We wanted to explore the direct correlation between seed mass and seed output, rather than model results after considering phylogeny (Moreover, results of PGLMM would show that seed output was mainly affected by environmental factors rather than phylogeny). (2) The best model for screening seed output is also a linear model. For similar reasons, climate mainly affects seed output rather than phylogeny. In addition, the PGLMM is temporarily unable to screen the best model due to the complexity of the phylogenetic model. All the above analyses were performed in R v4.5.0.
3.
Results
3.1
Correlation between traits and their variation
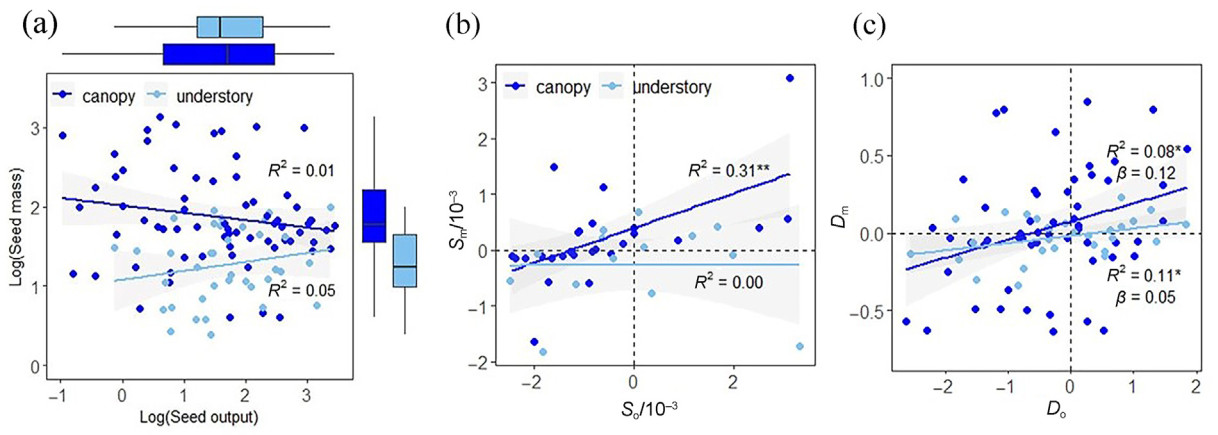
In general, the seed mass of canopy species was larger than that of understory species (p < 0.05), and the seed output of canopy species exhibited a wider range of variation compared to that of understory species (Fig. 2a). There was no significant correlation between seed mass and output for neither life form (p > 0.05, Fig. 2a), however, there were significant positive correlations between elevational variation of seed output and mass for canopy species (R2 = 0.31, p < 0.01, Fig. 2b), and significant positive correlations between interannual variation of seed output and mass for not only canopy but also understory species (R2 = 0.08 and 0.11, p < 0.05, Fig. 2c). In addition, as shown in Fig. 2b and c, most points were concentrated in quadrants 1 and 4, indicating that the seed mass and output of most species tended to increase or decrease at the same time.
Figure
2.
Correlation between seed mass and output (panel a) and their elevational (panel b) and interannual variations (panel c). Solid dots represent seed trait values from all species in all plots and during each year in panel a. The boxplots indicate the comparison of the two seed traits for canopy and understory plants in panel a. For panel b, solid dots represent variation rate of seed output (So) and seed mass (Sm) for each species along the elevation gradient during the same year. For panel c, solid dots represent difference of seed output (Do) and difference of seed mass (Dm) indicated the interannual variation of SRTs for each species in the same plot. Dark blue and light blue dots indicate the canopy and understory category, respectively. The solid line in the figure is the fitted curve, and the gray shade represents the 95% confidence interval. The significance level is indicated by asterisks: *, p < 0.05; **, p < 0.01. (For interpretation of the references to color in this figure legend, the reader is referred to the Web version of this article.)
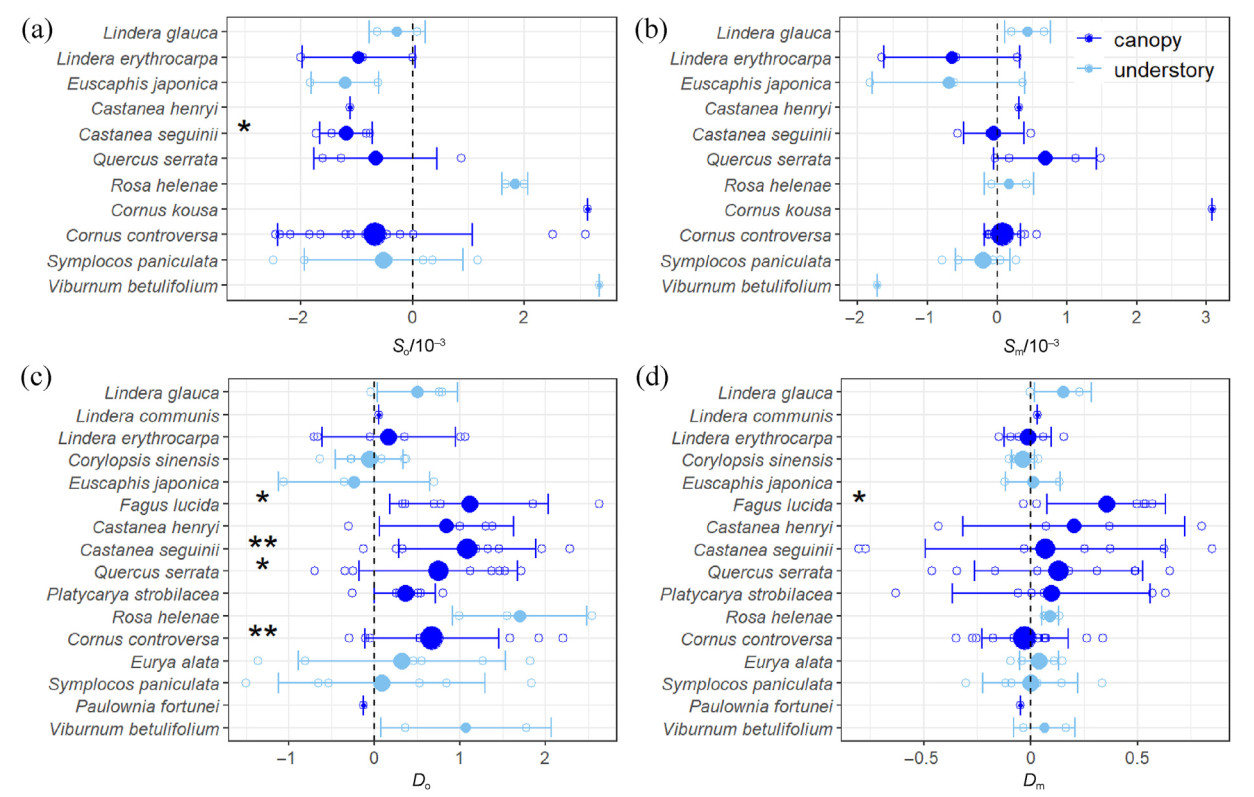
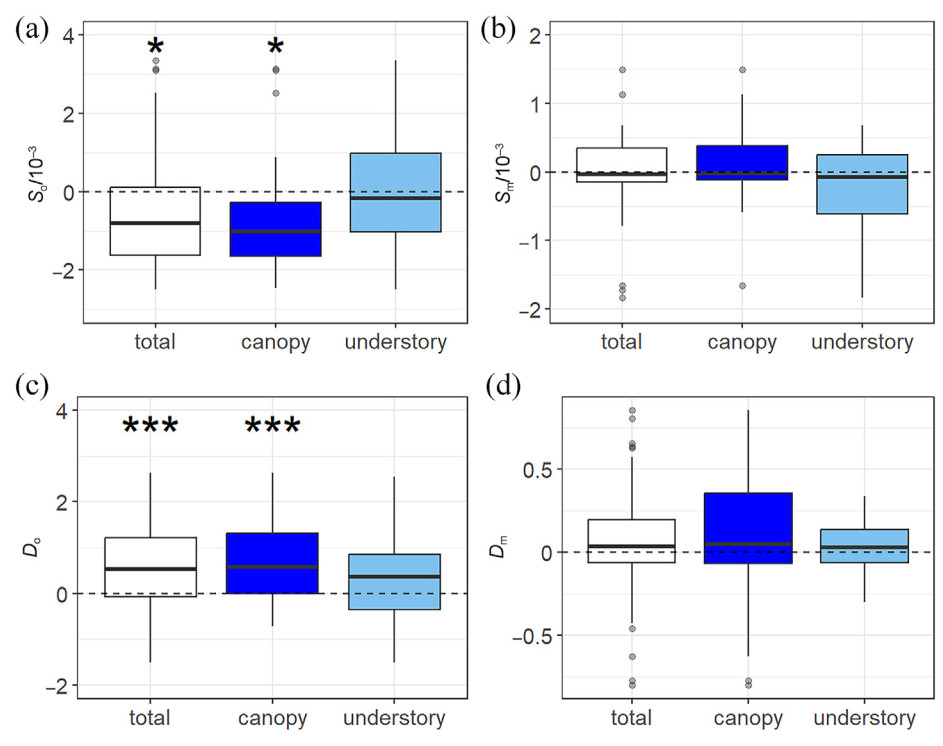
The seed output of only one species, C. seguinii, significantly decreased as elevation increased (Fig. 2a), and in four species, i.e., F. lucida, C. seguinii, Q. serrata, and C. controversa, it significantly increased from relative lean seed years to relative mast seed years (Fig. 3c). The ECV metric indicated that seed mass variation was usually greater across than within sites or years (Fig. S3), but no consistent trend for all species was detected along elevation gradients (Fig. 3b). In addition, only the seed mass of F. lucida significantly increased from lean seed years to mast seed years (Fig. 3d). The above-mentioned species are all canopy species. In general, the total community and canopy seed outputs showed negative correlations with elevation (Fig. 4a) and significantly increasing trends from lean years to seed years (Fig. 4c), while the trends for understory seed output were not significant (Fig. 4a–c). Neither the canopy or understory seed masses varied significantly across elevations and between years (Fig. 4b–d). The interannual variation of seed output for canopy species was consistent with that of seed rain for the total community (Table S3). Significant differences in seed output were observed from relative mast years (2011 and 2013) to relative lean years (2012 and 2014) for both total communities and canopy species, but differences were not significant between the two relative mast years or between the two relative lean years. Understory seed output did not show any significant differences between years. The seed mass of total communities and canopy species varied significantly only between 2013 and 2014.
Figure
3.
Elevational and interannual variation of SRTs for all species. (a) and (c), slopes of seed output (So) and seed mass (Sm); (b) and (d), difference of seed output (Do) and difference of seed mass (Dm). The hollow points show So and Sm, or Do and Dm for each species, with Do and Dm here only including interannual differences from each relative lean seed year to relative mast seed year. Solid points and error bars indicate mean values and standard deviations, respectively. "*" and "**" represent the student's t-test results, indicating that mean values were significantly different from 0. Specifically, *, 0.01 < p < 0.05 and ** 0.001 < p < 0.01. The differently sized solid points indicate sample size, and the different colors indicate canopy or understory species. (For interpretation of the references to color in this figure legend, the reader is referred to the Web version of this article.)
Figure
4.
Elevational and interannual variation of SRTs for canopy and understory plants. (a) and (c), slopes of seed output (So) and seed mass (Sm); (b) and (d), difference of seed output (Do) and difference of seed mass (Dm), with Do and Dm here including only interannual differences from each relative lean seed year to relative mast seed year. "*" and "***" represent the student's t-test results, indicating that mean values were significantly different from 0. Specifically, *, 0.01 < p < 0.05 and ***, 0.0001 < p < 0.001.
3.3
Seed traits vary with temperature and precipitation condition
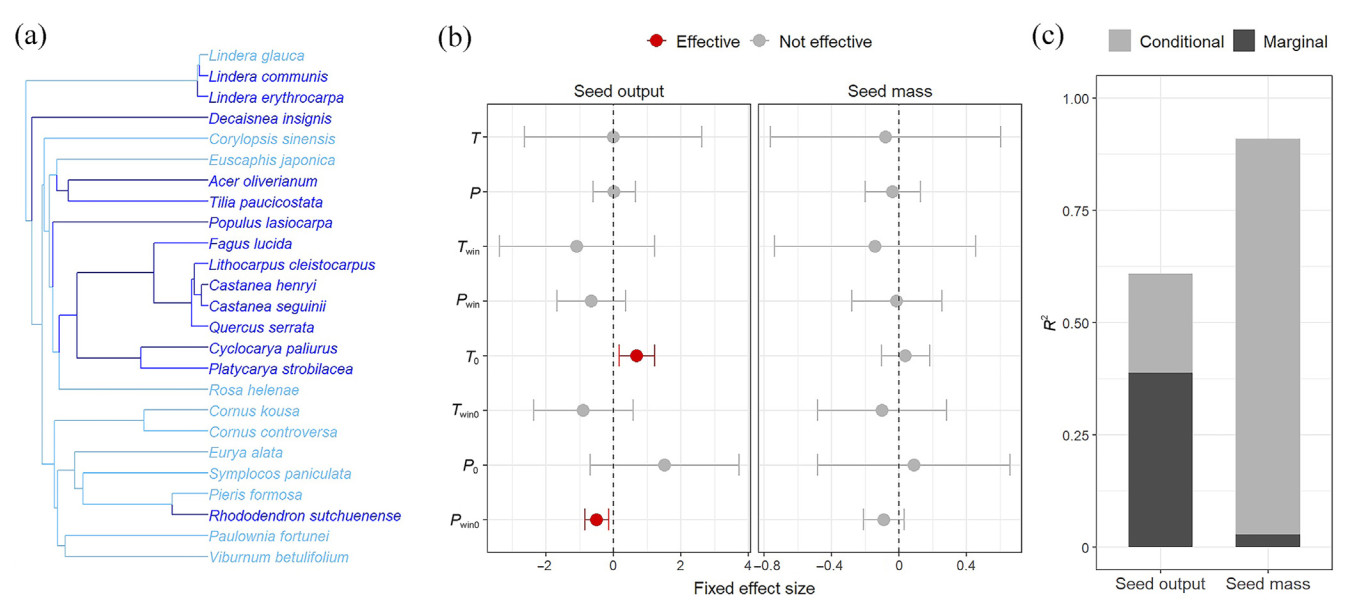
The phylogenetic tree including all species examined is shown in Fig. 5a. Based on the fixed effects of PGLMMs (Fig. 5b), it was shown that seed output was significantly influenced by temperature in the warmer season and precipitation in winter during the year before seed dispersal (T0 and Pwin0), with positive and negative effects, respectively. However, no significant effects on seed mass variation were observed. According to the R2 values obtained from the PGLMMs (Fig. 5c), weather condition and phylogeny explained 38.9% and 21.9% of seed output variation, respectively. As for seed mass variation, 88.1% was attributed to interspecific differences, while weather variation explained only a minimal part of the variation. Therefore, it was necessary to group species based on life forms and further examine the relationship between seed rain and weather variation.
Figure
5.
Results of the phylogenetic generalized mixed linear models (PGLMMs) to establish the relationship between each SRT and weather factors. (a) Phylogenetic tree including all the species sampled in this study. The dark blue and light blue colors indicate canopy species and understory species, respectively. (b) Fixed effects of temperature and precipitation factors on seed output and mass. The points indicate the estimates of the magnitude of the effect of each temperature and precipitation factor, while error bars indicate the 95% confidence interval (CI) for the above magnitude, which was calculated as the standardized slope estimate ±1.96 standard error. If the CI remained above or below zero, the factor's effect was significant (p < 0.05, red), otherwise it was not significant (p > 0.05, gray). (c) R2 of the PGLMMs. Marginal R2 and conditional R2 indicated the variances explained by fixed factors and the total models, respectively. The variance explained by random factors was calculated as conditional R2 minus marginal R2.
Abbreviations: T, temperature in warmer seasons in seed dispersal years; Twin, temperature in winter in seed dispersal years; P, precipitation in warmer seasons in seed dispersal years; Pwin, precipitation in winter in seed dispersal years; T0, temperature in warmer seasons in the year before seed dispersal; Twin0, temperature in winter in the year before seed dispersal; P0, precipitation in warmer seasons in the year before seed dispersal; Pwin0, precipitation in winter in the year before seed dispersal. The above-mentioned temperature and precipitation indicators were obtained from PCA. (For interpretation of the references to color in this figure legend, the reader is referred to the Web version of this article.)
The best models of general linear regression showed that temperature and precipitation contributed to 43.0% and 29.9% of seed output variation in canopy and understory species, respectively (Table 1). During the years before seed dispersal, the seed output of canopy species was significantly positively correlated with temperature and precipitation in warmer seasons (T0 and P0) but negatively correlated with winter temperature (Twin and Twin0) and winter precipitation (Pwin0). The seed output of understory species showed significantly positive relationships with temperature in warmer seasons during the years before seed dispersal (T0) and with precipitation during seed dispersal years (P). Moreover, T0, which influenced both life forms, had a stronger effect on the seed output of canopy (0.76) than on that of understory (0.38) plants. In contrast, almost no significant relationships were detected between weather indicators and the seed mass of either canopy or understory species.
Table
1.
Parameters of the best general linear regression models of seed output vs. weather indicators for canopy and understory species. Abbreviations: Stand. β, standardized regression coefficient; Std. Error, standard error; t, t statistic value; p, significance level (*, p < 0.05; **, p < 0.01; ***, p < 0.001); T, temperature in summer in seed dispersal years; Twin, temperature in winter during seed dispersal years; P, precipitation in warmer seasons during seed dispersal years; Pwin, precipitation in winter during seed dispersal years; T0, temperature in warmer seasons in the years before seed dispersal; Twin0, temperature in winter in the years before seed dispersal; P0, precipitation in warmer seasons in the years before seed dispersal; Pwin0, precipitation in winter in the years before seed dispersal.
4.1
Spatiotemporal variation and trade-offs of seed mass and output
Trade-offs between seed mass and output have functional significance in terms of resource allocation and economy of seeds (Moles and Westoby, 2006; Saatkamp et al., 2019). In this study, the correlation between seed mass and seed output was not significant, however, a significant positive correlation was detected between the two traits in terms of their interannual variation. In most plants, seed mass and output tend to increase and decrease at the same time. This phenomenon is explained by the "resource coordination hypothesis", which suggests that plants pursue the optimal utilization of environmental conditions, including temperature, precipitation, and nutrients (Keenan et al., 2015). Plants can increase seed output to improve settlement and competitiveness. They are also able to improve their survival rate by increasing seed mass when the environment is suitable for them, so as to maximize the utilization of resources and optimize survival strategies simultaneously, although this is not supported by the tolerance–fecundity model (Muller-Landau, 2010), which assumes an inverse relationship between fecundity and stress tolerance across species (de la Riva et al., 2016).
In the study area, seed mass generally did not show a significantly consistent variation with elevation or between years (Figs. 3b–d and 4b, d), and rarely changed with temperature and precipitation variation (Fig. 5b). This confirmed that seed mass is a stable trait that generally depends on species (Fig. 5c), and the stress-tolerance mechanism (Leishman et al., 2000; Westoby, 2004) regulating seed distribution cannot be proved in this area. However, the results obtained may be due differences in the ecological amplitude of species (Demissie and Bjørnstad, 1996). In this study, the elevation range examined may be suitable for species with wide adaptability. The seed output of communities usually decreased as elevation increased, especially for canopy species (Fig. 4a), which confirmed that seed rain is affected by energy constraints. It is known that more favorable temperatures are present at lower elevations (Körner and Basler, 2010), and, in this study, low temperatures were shown to reduce the total biomass of seeds. Moreover, the elevational variation of seed output reflected changes in the reproductive strategy of communities along environmental gradients. At lower elevations, plants could develop and reproduce more, and occupy more living space to rapidly utilize resources; therefore, they invested more energy in life activities to enhance their reproduction and diffusion. As elevation increased, temperature decreased, along with the ability of plants to survive. Therefore, plants chose to allocate more energy to their own development to ensure survival. Furthermore, the analysis of the relationship between weather variation and seed output confirmed that the latter increased with warmer temperatures (Fig. 5b, Table 1).
4.2
Differences in seed rain between canopy and understory species
Vertical stratification within plant communities produces differences in terms of life activities (Erasmy et al., 2021; Plewa et al., 2017). In this study, it was shown that the interannual variation of seed rain for canopy species was usually significant and similar to that for the whole community; however, that for understory species was not significant (Fig. 4). This indicated that canopy plants controlled the functioning of the entire plant community (Valerio et al., 2021), contributing more to its reproductive dynamics. The main cause for the non-significant interannual variation of seed rain in understory plants is the shelter effect of the canopy (Temesgen et al., 2006; Valerio et al., 2021). Understory species are less directly exposed to the atmospheric conditions (e.g., precipitation, sunlight, wind, etc.), and more in contact with the suitable microenvironment created by the canopy (Frenne et al., 2019). Interception of precipitation, heat preservation, and other functions of the canopy often lead to the weather-associated variation of the forest micro-habitat lagging behind that of the regional environment (De Lombaerde et al., 2022), with the effect slowing down the changes in the reproductive strategy of understory plants in response to the environment.
Temperature in the warmer season during the years before seed dispersal contributed significantly and positively to the seed output of canopy species (Fig. 5b, Table 1), while temperature in winter contributed negatively to it. It was therefore inferred that higher temperatures in the warm season promote physiological processes, as plants produce more organic substances for life activities, while lower temperatures in winter reduce respiratory consumption, as more organic substances are accumulated for growth and reproduction in the following year, resulting in more seeds. Precipitation during the warmer season in the years before seed dispersal positively contributed to canopy seed output, while winter precipitation contributed negatively to it. It was thus inferred that abundant precipitation during the warm season in lagged years also benefits plant physiological processes. However, in winter, when precipitation is characterized predominantly by snow because temperatures are usually below 0 ℃ in the study area, the snowpack on the ground limits nutrient acquisition from soils (Smaill et al., 2011). In addition, the snow deposited on leaves inhibits net carbon absorption through photosynthesis (Buechling et al., 2016), reducing the duration of the growing season and affecting plant physiological processes (Woodward et al., 1994). For understory species, precipitation during the warm season contributes to seed dispersal in seed dispersal years, also due to the enhanced physical effect of rain on the dispersion of shrub seeds, which are usually small and light. As shown in the models, temperature and precipitation explained more the variation of canopy seed output than the variation of understory seed output, which further proved that the reproductive strategy of canopy species is more sensitive to weather change. The buffering effect of the canopy mainly produces differences in temperature between the forest interior and exterior (Li et al., 2015b). This finding supports previous research suggesting that the canopy delays the response of understory plants to climate change through heat insulation (Frenne et al., 2019), especially in winter, because, as observed in our study, the temperatures in this season only affect canopy seed rain.
4.3
Improvement directions for future experiments
Future research should refine the spatial scale of sampling, for example by setting up continuous community sampling plots at more altitude gradients, and continuing to carry out long term monitoring so as to verify the applicability of the conclusions to longer periods of time. In addition, the number of seed collectors should be increased to expand the sampling area, and, upon setting them up in the study sites, the aggregation of individual tree distribution and canopy distribution patterns should be considered on a random basis to reduce the influence of non-species factors, such as that of forest gaps, on seed rain density.
5.
Conclusion
The observations of interannual and elevational variations of SRTs in Dalaoling from 2011 to 2014 revealed that the temporal variations of seed output and mass were significantly and positively correlated, which reflected the resource-based coordination of the plants' reproductive strategy. Seed output was significantly affected by weather variation, while the variation of seed mass was mainly due to interspecific differences. It was further revealed that the variation of seed rain in the whole community was mainly attributed to canopy tree species, and the response of their seed output to temperature and precipitation was more sensitive than that of the seed output of understory tree species. Therefore, canopy species play a regulatory role in the reproductive function of plant communities, as the canopy creates a relatively suitable micro-habitat in the forest understory, alleviating microclimate fluctuation and its impacts on the reproduction of understory species.
Availability of data
Data is available on request from the authors.
CRediT authorship contribution statement
Yuyang Xie: Writing – original draft, Visualization, Validation, Software, Methodology, Investigation, Formal analysis, Data curation, Conceptualization. Zehao Shen: Writing – review & editing, Supervision, Resources, Project administration, Funding acquisition, Data curation, Conceptualization. Xuejing Wang: Methodology, Formal analysis. Liu Yang: Methodology, Data curation. Jie Zhang: Investigation, Data curation.
Declaration of interest statement
The authors declare that they have no known competing financial interests or personal relationships that could have appeared to influence the work reported in this paper.
Acknowledgments
Thanks to Mr. Biming Huang, Mr. Wenchang Zuo and Mr. Daoxing Li for their long-term helps with seed collections, and we are grateful to the Dalaoling National Nature Reserve for their supports and cooperation in the last two decades. Thanks to International Science Editing (http://www.internationalscienceediting.com) for editing this manuscript.
Abreu, V.S., Dias, H.M., Kunz, S.H., van den Berg, E., Garbin, M.L., 2021. The soil seed bank as an indicator of altitudinal gradient in a montane tropical forest. J. Trop. For. Sci. 33 (4), 473–481. .
Appanah, S., 1985. General flowering in the climax rain forests of South-east Asia. J. Trop. Ecol. 1 (3), 225–240. .
Appanah, S., 1993. Mass flowering of dipterocarp forests in the aseasonal tropics. J. Biosci. 18 (4), 457–474. .
Ashton, P.S., Givnish, T.J., Appanah, S., 1988. Staggered flowering in the Dipterocarpaceae: new insights into floral induction and the evolution of mast fruiting in the aseasonal tropics. Am. Nat. 132 (1), 44–66. .
Baker, H.G., 1972. Seed weight in relation to environmental conditions in California. Ecology 53 (6), 997–1010. .
Bogdziewicz, M., Kelly, D., Thomas, P.A., Lageard, J.G.A., Hacket-Pain, A., 2020. Climate warming disrupts mast seeding and its fitness benefits in European beech. Nat. Plants 6 (2), 88–94. .
Bona, K., Purificação, K.N., Vieira, T.B., Mews, H.A., 2020. Fine-scale effects of bamboo dominance on seed rain in a rainforest. For. Ecol. Manag. 460 (15), 117906. .
Brearley, F.Q., Proctor, J., Nagy, L., Dalrymple, G., Voysey, B.C., 2007. Reproductive phenology over a 10-year period in a lowland evergreen rain forest of central Borneo. J. Ecol. 95 (4), 828–839. .
Bu, H., Chen, X., Xu, X., Liu, K., Jia, P., Du, G., 2007. Seed mass and germination in an alpine meadow on the eastern Tsinghai–Tibet plateau. Plant Ecol. 191 (1), 127–149. .
Buechling, A., Martin, P.H., Canham, C.D., Shepperd, W.D., Battaglia, M.A., Rafferty, N., 2016. Climate drivers of seed production in Picea engelmannii and response to warming temperatures in the southern Rocky Mountains. J. Ecol. 104 (4), 1051–1062. .
Chen, S.-C., Poschlod, P., Antonelli, A., Liu, U., Dickie, J.B., 2020. Trade-off between seed dispersal in space and time. Ecol. Lett. 23 (11), 1635–1642. .
de la Riva, E.G., Tosto, A., Pérez-Ramos, I.M., Navarro-Fernández, C.M., Olmo, M., Anten, N.P., Marañón, T., Villar, R., 2016. A plant economics spectrum in Mediterranean forests along environmental gradients: is there coordination among leaf, stem and root traits? J. Veg. Sci. 27 (1), 187–199. .
De Lombaerde, E., Vangansbeke, P., Lenoir, J., Van Meerbeek, K., Lembrechts, J., Rodriguez-Sanchez, F., Luoto, M., Scheffers, B., Haesen, S., Aalto, J., Christiansen, D.M., De Pauw, K., Depauw, L., Govaert, S., Greiser, C., Hampe, A., Hylander, K., Klinges, D., Koelemeijer, I., Meeussen, C., Ogee, J., Sanczuk, P., Vanneste, T., Zellweger, F., Baeten, L., De Frenne, P., 2022. Maintaining forest cover to enhance temperature buffering under future climate change. Sci. Total Environ. 810 (1), 151338. .
Demissie, A., Bjørnstad, Å., 1996. Phenotypic diversity of Ethiopian barleys in relation to geographical regions, altitudinal range, and agro-ecological zones: as an aid to germplasm collection and conservation strategy. Hereditas 124 (1), 17–29. .
Dormann, C.F., Elith, J., Bacher, S., Buchmann, C., Carl, G., Carre, G., Garcia Marquez, J.R., Gruber, B., Lafourcade, B., Leitao, P.J., Muenkemueller, T., McClean, C., Osborne, P.E., Reineking, B., Schroeder, B., Skidmore, A.K., Zurell, D., Lautenbach, S., 2013. Collinearity: a review of methods to deal with it and a simulation study evaluating their performance. Ecography 36 (1), 27–46. .
Dylewski, L., Ortega, Y.K., Bogdziewicz, M., Pearson, D.E., 2020. Seed size predicts global effects of small mammal seed predation on plant recruitment. Ecol. Lett. 23 (6), 1024–1033. .
Erasmy, M., Leuschner, C., Balkenhol, N., Dietz, M., 2021. Three-dimensional stratification pattern in an old-growth lowland forest: How does height in canopy and season influence temperate bat activity? Ecol. Evol. 11 (23), 17273–17288. .
Frenne, P.D., Zellweger, F., Rodríguez-Sánchez, F., Scheffers, B.R., Lenoir, J., 2019. Global buffering of temperatures under forest canopies. Nat. Ecol. Evol. 3 (5), 744–749. .
Froes, C.Q., da Costa, P.F., Lopes Fernandes, S.S., Vieira da Silva, A.P., de Jesus, R.M., Pereira, Z.V., 2020. The seed rain as an environmental indicator of areas in the ecological restoration process of Mato Grosso do Sul state. Ciência Florest. 30 (4), 1032–1047. .
Gera, M., Gera, N., Ginwal, H.S., 2000. Seed trait variation in Dalbergia sissoo Roxb. Seed Sci. Technol. 28 (2), 467–475.
Guo, L.-J., Cao, H.-W., Xu, W.-H., Tian, Y.-Q., Xiao, Z.-P., 2017. Seed rain, soil seed bank and quantitative dynamics of seedlings of Emmenopterys henryi populations in different altitude regions. Bull. Bot. Res. 37 (3), 377–386. .
Holm, S.O., 1994. Reproductive patterns of Betula pendula and B. pubescens coll. along a regional altitudinal gradient in northern Sweden. Ecography 17 (1), 60–72. .
Ishihara, M.I., Kikuzawa, K., 2009. Annual and spatial variation in shoot demography associated with masting in Betula grossa: comparison between mature trees and saplings. Ann. Bot. 104 (6), 1195–1205. .
Jin, Y., Qian, H., 2019. V. PhyloMaker: an R package that can generate very large phylogenies for vascular plants. Ecography 42 (8), 1353–1359. .
Kawada, H., Maruyama, K., 1986. Effects of seed bearing of a natural beech (Fagus crenata Blume) forest on amount of litter fall and its nutrients. Jpn. J. Ecol. 36 (1), 3–10. .
Kaya, Z., Temerit, A., 1994. Genetic structure of marginally located Pinus nigra var. pallasiana populations in Central Turkey. Silv. Genet. 43 (5–6), 272–277.
Keenan, T.F., Prentice, I.C., Wang, H., Wright, I.J., Maire, V., Dong, N., 2015. Predicting the Maximum Rate of Carboxylation Based on the Coordination Hypothesis of Leaf Resource Allocation. AGU Fall Meeting Abstracts, American Geophysical Union, San Francisco.
Klipel, J., Bergamin, R.S., Cianciaruso, M.V., da Silva, A.C., Jurinitz, C.F., Jarenkow, J.A., Bordin, K.M., Molz, M., Higuchi, P., Picolotto, R.C., Debastiani, V.J., Muller, S.C., 2023. How do distinct facets of tree diversity and community assembly respond to environmental variables in the subtropical Atlantic Forest? Ecol. Evol. 13 (7), e10321. .
Körner, C., Basler, D., 2010. Phenology under global warming. Science 327 (5972), 1461–1462. .
Kubelka, V., Salek, M., Tomkovich, P., Vegvari, Z., Freckleton, R.P., Szekely, T., 2018. Global pattern of nest predation is disrupted by climate change in shorebirds. Science 362 (6415), 680–683. .
Leishman, M.R., Masters, G.J., Brown, I.P.C.K., 2000. Seed bank dynamics: the role of fungal pathogens and climate change. Funct. Ecol. 14 (3), 293–299. .
Li, D., Dinnage, R., Nell, L.A., Helmus, M.R., Ives, A.R., 2020. phyr: an R package for phylogenetic species-distribution modelling in ecological communities. Methods Ecol. Evol. 11 (11), 1455–1463. .
Li, Y., Zeng, Z., Zhao, L., Piao, S., 2015a. Spatial patterns of climatological temperature lapse rate in mainland China: a multi-time scale investigation. J. Geophys. Res. Atmos. 120 (7), 2661–2675. .
Li, Y., Zhao, M., Motesharrei, S., Mu, Q., Kalnay, E., Li, S., 2015b. Local cooling and warming effects of forests based on satellite observations. Nat. Commun. 6 (1), 6603. .
McEuen, A.B., Curran, L.M., 2004. Seed dispersal and recruitment limitation across spatial scales in temperate forest fragments. Ecology 85, 507–518. .
Moles, A.T., Westoby, M., 2006. Seed size and plant strategy across the whole life cycle. Oikos 113 (1), 91–105. .
Muller-Landau, H.C., 2010. The tolerance-fecundity trade-off and the maintenance of diversity in seed size. Proc. Natl. Acad. Sci. USA 107 (9), 4242–4247. .
Nathan, R., Muller-Landau, H.C., 2000. Spatial patterns of seed dispersal, their determinants and consequences for recruitment. Trends Ecol. Evol. 15 (7), 278–285. .
Paradis, E., Claude, J., Strimmer, K., 2004. APE: analyses of phylogenetics and evolution in R language. Bioinformatics 20 (2), 289–290. .
Plewa, R., Jaworski, T., Hilszczanski, J., Horak, J., 2017. Investigating the biodiversity of the forest strata: the importance of vertical stratification to the activity and development of saproxylic beetles in managed temperate deciduous forests. For. Ecol. Manag. 402, 186–193. .
Procknow, D., Moreira Rovedder, A.P., Piaia, B.B., Stefanello, M. d. M., Camargo, B., Felker, R.M., Croda, J.P., Gazzola, M.D., 2020. Seed rain as an ecological indicator of forest restoration in the Pampa biome. Rev. Bras. Ciência Avícola 15 (3), e7220. .
Rapp, J.M., Mcintire, E.J.B., Crone, E.E., 2013. Sex allocation, pollen limitation and masting in whitebark pine. J. Ecol. 101 (5), 1345–1352. .
Rodrigues, G.G.R., 2002. Seed bank and seed rain in a seasonal semi-deciduous forest in south-eastern Brazil. J. Trop. Ecol. 18 (5), 759–774. .
Rother, D.C., Rodrigues, R.R., Pizo, M.A., 2009. Effects of bamboo stands on seed rain and seed limitation in a rainforest. For. Ecol. Manag. 257 (3), 885–892. .
Ruiz, R.G., Price, K.R., Rose, M.E., Fenwick, G.R., 1997. Effect of seed size and testa colour on saponin content of Spanish lentil seed. Food Chem. 58 (3), 223–226. .
Saatkamp, A., Cochrane, A., Commander, L., Guja, L.K., Jimenez-Alfaro, B., Larson, J., Nicotra, A., Poschlod, P., Silveira, F.A., Cross, A.T., Dalziell, E.L., Dickie, J., Erickson, T.E., Fidelis, A., Fuchs, A., Golos, P.J., Hope, M., Lewandrowski, W., Merritt, D.J., Miller, B.P., Miller, R.G., Offord, C.A., Ooi, M.K.J., Satyanti, A., Sommerville, K.D., Tangney, R., Tomlinson, S., Turner, S., Walck, J.L., 2019. A research agenda for seed-trait functional ecology. New Phytol. 221 (4), 1764–1775. .
Schnurr, J.L., Ostfeld, R.S., Canham, C.D., 2010. Direct and indirect effects of masting on rodent populations and tree seed survival. Oikos 96 (3), 402–410. .
Schupp, E.W., 1990. Annual variation in seedfall, postdispersal predation, and recruitment of a Neotropical tree. Ecology 71 (2), 504–515. .
Shimada, T., Takahashi, A., Shibata, M., Yagihashi, T., 2015. Effects of within-plant variability in seed weight and tannin content on foraging behaviour of seed consumers. Funct. Ecol. 29 (12), 1513–1521. .
Singh, G., Rai, I.D., Rawat, G.S., 2010. The year 2010 was 'mast seed year' for the Kharsu oak (Quercus semecarpifolia Sm.) in the Western Himalaya. Curr. Sci. 100 (9), 1275.
Smaill, S.J., Clinton, P.W., Allen, R.B., Davis, M.R., 2011. Climate cues and resources interact to determine seed production by a masting species. J. Ecol. 99 (3), 870–877. .
Temesgen, H., Martin, P.J., Maguire, D.A., Tappeiner, J.C., 2006. Quantifying effects of different levels of dispersed canopy tree retention on stocking and yield of the regeneration cohort. For. Ecol. Manag. 235 (1–3), 44–53. .
Turnbull, L.A., Rees, C.M., 2000. Are plant populations seed-limited? A review of seed sowing experiments. Oikos 88 (2), 225–238. .
Urbanska, K.M., Fattorini, M., 2000. Seed rain in high-altitude restoration plots in Switzerland. Restor. Ecol. 8 (1), 74–79. .
Valerio, M., Ibanez, R., Gazol, A., 2021. The role of canopy cover dynamics over a decade of changes in the understory of an Atlantic beech-oak forest. Forests 12 (7), 938. .
Wahid, N., Bounoua, L., 2013. The relationship between seed weight, germination and biochemical reserves of maritime pine (Pinus pinaster Ait.) in Morocco. New Fed. 44 (3), 385–397. .
Wang, J., Hou, X., Zhang, B., Han, N., Feng, T., An, X., Chen, X., Zhao, J., Chang, G., 2022. Long-term effects of climate variability on seed rain dynamics of four Fagaceae sympatric species in Qinling Mountains, China. Biology 11 (4), 533. .
Wang, X., Alvarez, M., Donohue, K., Ge, W., Cao, Y., Liu, K., Du, G., Bu, H., 2020a. Elevation filters seed traits and germination strategies in the eastern Tibetan Plateau. Ecography 44 (2), 242–254. .
Wang, Y., LaMontagne, J.M., Lin, F., Yuan, Z., Ye, J., Wang, X., Hao, Z., 2020b. Similarity between seed rain and neighbouring mature tree communities in an old-growth temperate forest. J. For. Res. 31 (6), 2435–2444. .
Wang, Y.F., Yue, Y.C., 2014. Effects of resource allocation and floral traits on the number and mass of Saussurea undulata seeds from different elevations in eastern Qinghai-Xizang Plateau. Chin. J. Plant Ecol. 38 (4), 366–374. .
Westoby, M.M., 2004. Seedling survival and seed size: a synthesis of the literature. J. Ecol. 92 (3), 372–383. (in Chinese).
Woodward, A., Silsbee, D.G., Schreiner, E.G., Means, J.E., 1994. Influence of climate on radial growth and cone production in sub-alpine fir (Abies lasiocarpa) and mountain hemlock (Tsuga mertensiana). Can. J. For. Res. 24 (6), 1133–1143. .
Xu, Y., Shen, Z.H., Nan, L., Tang, Y.Y., Dao-Xin, L.I., Wang, G.F., Tan, J.L., 2012. Ten years' observation of seed rain in a Fagus lucida community in Dalaoling Nature Reserve in the Three Gorges: seed rain density, species composition and their correlation with the community. Chin. J. Plant Ecol. 36 (8), 708–716. .
Yang, L., Shen, Z., Wang, X., Wang, S., Xie, Y., Larjavaara, M., Zhang, J., Li, G., 2023. Climate drivers of seed rain phenology of subtropical forest communities along an elevational gradient. Int. J. Biometeorol. 67 (6), 1095–1104. .
Table
1.
Parameters of the best general linear regression models of seed output vs. weather indicators for canopy and understory species. Abbreviations: Stand. β, standardized regression coefficient; Std. Error, standard error; t, t statistic value; p, significance level (*, p < 0.05; **, p < 0.01; ***, p < 0.001); T, temperature in summer in seed dispersal years; Twin, temperature in winter during seed dispersal years; P, precipitation in warmer seasons during seed dispersal years; Pwin, precipitation in winter during seed dispersal years; T0, temperature in warmer seasons in the years before seed dispersal; Twin0, temperature in winter in the years before seed dispersal; P0, precipitation in warmer seasons in the years before seed dispersal; Pwin0, precipitation in winter in the years before seed dispersal.

 DownLoad:


 Email Alerts
 RSS Feeds