Bin Xu, Xueli Jiang, Yingying Zong, G. Geoff Wang, Fusheng Chen, Zhenyu Zhao, Xiangmin Fang. The storage and utilization of carbohydrates in response to elevation mediated by tree organs in subtropical evergreen broad-leaved forests[J]. Forest Ecosystems, 2024, 11(1): 100167. DOI: 10.1016/j.fecs.2024.100167
Citation:
Bin Xu, Xueli Jiang, Yingying Zong, G. Geoff Wang, Fusheng Chen, Zhenyu Zhao, Xiangmin Fang. The storage and utilization of carbohydrates in response to elevation mediated by tree organs in subtropical evergreen broad-leaved forests[J]. Forest Ecosystems, 2024, 11(1): 100167. DOI: 10.1016/j.fecs.2024.100167
Bin Xu, Xueli Jiang, Yingying Zong, G. Geoff Wang, Fusheng Chen, Zhenyu Zhao, Xiangmin Fang. The storage and utilization of carbohydrates in response to elevation mediated by tree organs in subtropical evergreen broad-leaved forests[J]. Forest Ecosystems, 2024, 11(1): 100167. DOI: 10.1016/j.fecs.2024.100167
Citation:
Bin Xu, Xueli Jiang, Yingying Zong, G. Geoff Wang, Fusheng Chen, Zhenyu Zhao, Xiangmin Fang. The storage and utilization of carbohydrates in response to elevation mediated by tree organs in subtropical evergreen broad-leaved forests[J]. Forest Ecosystems, 2024, 11(1): 100167. DOI: 10.1016/j.fecs.2024.100167
Key Laboratory of National Forestry and Grassland Administration on Forest Ecosystem Protection and Restoration of Poyang Lake Watershed, College of Forestry, Jiangxi Agricultural University, Nanchang, 330045, China
b.
Jiulianshan National Observation and Research Station of Chinese Forest Ecosystem, College of Forestry, Jiangxi Agricultural University, Nanchang, 330045, China
c.
Department of Forestry and Environmental Conservation, Clemson University, Clemson, SC, 29634, USA
Funds:
the National Natural Science Foundation of China32260379
the National Natural Science Foundation of China32371852
the Jiangxi Provincial Natural Science Foundation20224ACB215005
Key Laboratory of National Forestry and Grassland Administration on Forest Ecosystem Protection and Restoration of Poyang Lake Watershed, College of Forestry, Jiangxi Agricultural University, Nanchang, 330045, China. E-mail address: xmfang2013@126.com (X. Fang)
Global climate change can affect tree growth and carbon sink function by influencing plant carbohydrate synthesis and utilization, while elevation can be used as an ideal setting under natural conditions to simulate climate change effects. The effect of elevation on tree growth may depend on organ type. However, the allocation patterns of nonstructural and structural carbohydrates (NSCs and SCs, respectively) in different tree organs and their response to elevation remain unclear. We selected four dominant tree species, Schima superba, Castanopsis eyrei, Castanopsis fargesii and Michelia maudiae, along an elevation gradient from 609 to 1,207 m in subtropical evergreen broad-leaved forests and analyzed leaf, trunk, and fine root NSCs, carbon (C), nitrogen (N) and phosphorus (P) concentrations and the relative abundance of SCs. Leaf NSCs increased initially and then decreased, and trunk NSCs increased with increasing elevation. However, root NSCs decreased with increasing elevation. The relative abundance of SCs in leaves and trunks decreased, while the relative abundance of root SCs increased with increasing elevation. No significant correlations between SCs and NSCs in leaves were detected, while there were negative correlations between SCs and NSCs in trunks, roots, and all organs. Hierarchical partitioning analysis indicated that plant C/N and C/P were the main predictors of changes in SCs and NSCs. Our results suggest that tree organs have divergent responses to elevation and that increasing elevation will inhibit the aboveground part growth and enhance the root growth of trees. A tradeoff between the C distribution used for growth and storage was confirmed along the elevation gradient, which is mainly manifested in the “sink” organs of NSCs. Our results provide insight into tree growth in the context of global climate change scenarios in subtropical forest ecosystems.
Forests are the largest carbon (C) reservoir in terrestrial ecosystems, storing over 80% of terrestrial aboveground C stocks and over 70% of terrestrial soil organic C (Carvalhais et al., 2014; Zhou et al., 2022). The C sequestration function of forest ecosystems is crucial to the global C balance, while the exertion of this function originates from the growth of trees (Carvalhais et al., 2014; Moreau et al., 2022). Accelerating global climate change is becoming a key factor determining the C sequestration of forest ecosystems by affecting tree growth and forest structure (Carvalhais et al., 2014; Qi et al., 2015; Corlett, 2016; Blumstein et al., 2023). However, the physiological mechanisms of tree C distribution in response to global changes are unclear, which limits the accurate evaluation and prediction of the C sequestration function of forests under the global climate change scenario.
Global climate change affects plant C allocation strategies by changing environmental factors, such as temperature, moisture, and soil nutrients (Qi et al., 2015; Corlett, 2016; Wang et al., 2021). Many environmental factors, such as hydrothermal and soil physicochemical conditions, change simultaneously along the elevation gradient (Zhu et al., 2012; Cao et al., 2018; Wang et al., 2022). Previous studies have reported changes in species distribution and tree C allocation with increasing elevation (Qi et al., 2015; Wang et al., 2018, 2021). The C distribution of trees along an elevation gradient is the result of the vegetation's response to long-term climate change and reflects the comprehensive effect of environmental factors (Hoch et al., 2003; Kuster et al., 2013; Lenz et al., 2014). Therefore, elevation can be used as an ideal setting under natural conditions to simulate climate change effects on plant growth and physiology.
Carbohydrates are the products of photosynthesis, which provide energy for plant metabolism and form the biomass of trees (Hoch et al., 2003; Lambers et al., 2008). Trees adapt to changing environments by regulating the synthesis and utilization of carbohydrates and then altering photosynthate distribution and their growth rate (Zhang et al., 2018; Signori-Müller et al., 2021; Yang et al., 2022). Synthesizing and utilizing carbohydrates are important physiological mechanisms affecting tree growth, while the tradeoff of tree C distribution between growth and storage along the elevation gradient is not fully clear. According to their form in tree organs, carbohydrates can be divided into structural carbohydrates (SCs) and nonstructural carbohydrates (NSCs) (Lambers et al., 2008; Overdieck, 2016), which represent the utilization and storage of C in plants, respectively. SCs are mainly involved in constructing plant structure and morphology, i.e., cell wall (Chapin et al., 1990; Overdieck, 2016), while NSCs reflect the balance between plant C synthesis and consumption (respiration and growth) (Hoch et al., 2003; Martínez-Vilalta et al., 2016; Herrera-Ramírez et al., 2021). Theoretically, trees will put more C into growth to gain an advantage in resource competition when the environment is favorable, which induces a higher concentration of SCs (Furze et al., 2018; Hartmann et al., 2020). Whereas in unfavorable environments, trees will store more C in response to environmental stress and then maintain higher concentrations of NSCs (Hoch et al., 2003; Körner, 2003; Signori-Müller et al., 2021). It has been confirmed that the decrease of temperature with increasing elevation, especially the low temperature in winter, had a limiting effect on the growth of trees (Lenz et al., 2014; Furze et al., 2018). However, most studies found that plants maintained higher levels of NSCs regardless of environmental conditions (Wang et al., 2012, 2018; Carvalhais et al., 2014), despite plants put more C in SCs in a favorable environment, implying that assessing the impact of environmental changes on tree growth physiology using only NSCs is challenging (Chapin et al., 1990; Herrera-Ramírez et al., 2021). The evaluation of the distribution and tradeoff of SCs and NSCs in plant organs is conducive to a comprehensive understanding of tree physiological response and adaptation mechanism.
The partitioning of photosynthate includes not only the relationship between NSCs and SCs in the same tissue but also the distribution characteristics of C in different tree organs (Martínez-Vilalta et al., 2016; Overdieck, 2016). Roots and leaves are important functional organs of trees, with leaves being the assimilatory organs responsible for the photosynthetic synthesis of carbohydrates (Kuster et al., 2013; Liu et al., 2020), while roots are mainly responsible for nutrient uptake and transport to the trunk and leaves to form new tissues (Chapin et al., 1990; Furze et al., 2018). In contrast, the trunk is the transport and storage organ for C and nutrients (Poorter and Kitajima, 2007; Herrera-Ramírez et al., 2021). Additionally, roots, leaves, and trunk consume photosynthetic products through turnover and physiological activities. When the water and heat resources change along the elevation gradient, the C distribution strategies among organs will be discrepant due to differences in organ division of labor. Carbon undergoes alternative pathways for the synthesis of cell walls in the form of SCs or reserving in the form of NSCs (Hoch et al., 2003; Hartmann et al., 2020). Trees will balance these pathways according to their growth strategies and their need to cope with environmental changes (Poorter and Kitajima, 2007; Hartmann et al., 2020). For example, plants may reduce C consumption for leaf growth and accumulate large amounts of NSCs for osmoregulation to prevent intracellular icing at low temperatures (Zhu et al., 2012; Lenz et al., 2014; Blumstein et al., 2023). However, low temperatures inhibit the decomposition of litter and soils, resulting in inadequate soil nutrient input and availability, which may cause plants to use more C for root growth rather than storage to increase the capture of soil nutrients (Moinet et al., 2020; Wang et al., 2022). The allocation of carbohydrates in tree organs is a comprehensive reflection of tree competition, resource acquisition, and environmental adaptation, but most studies only focus on tree leaves, ignoring the response of other organs to environmental changes (Li et al., 2017; Wang et al., 2022).
In this study, four dominant tree species along an elevation gradient were selected in evergreen broad-leaved forests in subtropical China. The NSCs concentrations, the relative abundance of SCs, carbon (C), nitrogen (N), and phosphorus (P) concentrations and their stoichiometric characteristics in leaves, trunks and roots of four tree species were analyzed to test the following hypotheses: 1) there is a negative correlation between NSCs and SCs in plant organs, which reflects the tradeoff of tree C distribution between growth and storage; 2) the responses of C allocation in different organs with increasing elevation are varied because of their different functions.
2.
Materials and methods
2.1
Study area
The study area is located at Jiulianshan National Nature Reserve (24°31′–24°35′ N, 114°26′–114°29′ E) in Longnan County, Jiangxi Province, China, with a total area of approximately 1.34 × 10⁴ ha. The area has a typical subtropical monsoon climate and the mean annual temperature and precipitation are 16.7 ℃ and 1,954.6 mm, respectively (Feng et al., 2022). The elevation of the area is 280–1,430 m a.s.l., forming a vertical distribution of mountain climate, which provides natural experimental conditions for the study of tree growth in response to climate change. The main vegetation type in the nature reserve is native evergreen broad-leaved forest. The main tree species of evergreen broad-leaved forest include Castanopsis fargesii, Schima superba, Castanopsis eyrei, Michelia maudiae, Quercus glauca, Daphniphyllum oldhamii, Cinnamomum austrosinense, Diospyros morrisiana, Ternstroemia gymnanthera and so on. Understory shrubs and herbs are dominated by Ilex szechwanensis, Syzygium buxifolium, Adinandra millettii, Ilex pubescens, Rhododendron mariae, Hydrangea stenophylla, Fargesia spathacea, Dicranopteris pedata, Woodwardia japonica, Diplopterygium chinense, Arachniodes speciosa and Dryopteris indusiata.
2.2
Experimental design and sample collection
The evergreen broad-leaved forests within Jiulianshan are distributed at elevations from 300 to 1,200 m, but the undisturbed and concentrated original forests are distributed above an elevation of 500 m. In July 2021, experimental plots were established from 609 to 1,207 m at an interval of approximately 150 m along the elevation gradient and 1,207 m is the upper limit of the distribution of evergreen broad-leaved forests (Table S1). Temperature is one of the most significant environmental factors that varies along the elevation gradient. It is estimated that the temperature decreases by about 0.6 ℃ for every 100 m increase in elevation. Choosing 150 m as the elevation interval can simulate the impact of a temperature difference of 0.9–1.0 ℃ on forest ecosystems. A total of 15 plots were set up at 5 elevations (609, 759, 903, 1,062 and 1,207 m) with 3 replicated plots of 20 m × 20 m at each elevation. According to the survey results of the plots, four dominant tree species, Michelia maudiae, Schima superba, Castanopsis eyrei and Castanopsis fargesii were selected for plant sample collection. Michelia maudiae and Schima superba are distributed at all five elevations, while Castanopsis eyrei is not distributed at 1,207 m and Castanopsis fargesii is not distributed at 1,062 and 1,207 m. The dominant families of subtropical evergreen broad-leaved forests include Fagaceae, Camelliaceae, Lauraceae, and Magnoliaceae, etc (Wang et al., 2019). As the tree species selected in this study, Castanopsis fargesii and Castanopsis eyrei belong to Fagaceae, and Schima superba and Michelia maudiae belong to Theaceae and Magnoliaceae, respectively. Castanopsis fargesii, Castanopsis eyrei and Schima superba are constructive species, while Michelia maudiae is widely distributed in subtropics and is often served as an important companion species of subtropical evergreen broad-leaved forests (Lin et al., 1981; Ni and Song, 1997). Therefore, these four tree species were selected to represent the response of evergreen broad-leaved forest and its main tree species to environmental changes.
In July 2021, four standard trees of each dominant tree species were randomly selected according to the average height and diameter at breast height of each tree species in each plot to collect leaf, trunk, and fine root samples. Leaves were collected from the middle and upper parts of the tree canopy (Guo et al., 2022). Tree cores were collected at the breast height using growth cones (5.15 mm in diameter) to represent the trunk sample (Furze et al., 2018), and fine roots (≤2 mm in diameter) were collected by the digging method (Li et al., 2021). In each plot, samples from the same species with the same organ were completely mixed, dried to a constant weight, ground and passed through a 0.15-mm sieve for the chemical analysis.
Fifteen soil cores (3 cm diameter) were randomly collected at 0–10 cm soil depth and mixed into one composite sample in each plot. The samples were shipped to the laboratory and passed through a 2-mm sieve after removing roots and organic debris. Soil samples were stored at 4 ℃ for the determination of mineral N, and were air-dried for the determination of soil pH, organic C (OC), total N (TN) and total P (TP).
2.3
Basic chemical parameter analyses
Organic C was determined using a C/N analyzer (multi N/C 2100 TOC, Analytik Jena, Germany). TN and TP were quantified using an automatic discrete analyzer (Smart Chem 140, AMS Alliance, Italy) after samples were digested with H2SO4. Soil pH was measured with a soil to water ratio of 1:2.5 (w:v) using a pH meter (Shanghai Lida Instrument Factory, China). Soil available P was extracted with NH4F–HCl solution and determined by an automatic discrete analyzer. Soil NH4+-N was measured using the indophenol blue colorimetric method, and soil NO3−-N was determined using the diazotization coupling colorimetric method. The soil mineral N is the sum of NO3−-N and NH4+-N (Li et al., 2021).
2.4
Nonstructural carbohydrate determination
Dried plant samples (0.5 g) were added to centrifuge tubes with 10 ml of 80% ethanol solution and then bathed in water at 80 ℃ for 30 min. The supernatant was collected by centrifugation (Seifter and Dayton, 1950). The extraction was repeated three times, and the supernatant was used to determine soluble sugar (SS) by the anthrone method. After that, the ethanol was removed from the ethanol insoluble residue by evaporation, and the residue was boiled in 2 ml distilled water for 15 min to release the starch (ST). After cooling, 9.2 M HClO4 was added to the solution to hydrolyze for 15 min, and then distilled water was added to centrifuge to collect the supernatant, which was extracted repeatedly three times. The starch concentration was determined using an anthrone reagent based on spectrophotometry at 620 nm (Seifter and Dayton, 1950; Li et al., 2013; Cao et al., 2018). The standard solution concentration of glucose was used as the standard, and the concentration of ST was calculated by multiplying the glucose concentration by a conversion factor of 0.9 (Osaki et al., 1991). The NSCs concentration was the sum of SS and ST.
2.5
Structural carbohydrate determination
The relative abundance of SCs was determined by a Fourier transform infrared spectrometer (Spectrum Two, PerkinElmer) to characterize the distribution of structural carbohydrates in tree organs (Zhang and Yu, 2012). Ground plant samples were completely mixed with potassium bromide at a ratio of 1:100 and then scanned across a spectrum of 4,000–400 cm−1 with 32 scans at a resolution of 4 cm−1, using potassium bromide as a background. The infrared absorption peaks represent different C functional groups. Based on previous descriptions in the literature, we identified typical molecular spectral parameters associated with structural carbohydrate functional groups with a baseline region of approximately 1,488 to 1,147 cm−1, which has three subdominant peaks, with the first, second, and third peaks concentrated at approximately 1,415, 1,370 and 1,240 cm−1, respectively. These substances are related to hemicellulose and cellulose compounds (Zhang and Yu, 2012; Xin et al., 2017; Prates et al., 2018).
2.6
Statistical analysis
We used SPSS 26 (IBM Corporation, Chicago, USA) and R software 4.2.2 (R Core Team, 2021) for statistical analysis. The data were tested for normal distribution and for homogeneity of variance before statistical analysis. One-way analysis of variance and Duncan's multiple comparisons were performed to analyze the differences in soil (pH, soil OC, TN, TP, C/N, C/P, N/P, mineral N, and available P) and plant parameters (OC, TN, TP, C/N, C/P, N/P, NSCs, SCs and SS/ST) along the elevation gradient and the differences in NSCs and SCs among tree organs and species. At 1,207 m elevation, when only two tree species were compared for NSCs and SCs, the independent sample T test was used to test the significance. Pearson correlation analysis was used to determine the relationships between NSCs and SCs and among the plant OC, TN, TP and C distribution (NSCs and SCs). The linear relations between SS, ST, NSCs and SCs and elevation were also tested using Pearson correlation analysis. Hierarchical partitioning analysis was used to identify individual importance of plant variables influencing tree NSCs and SCs and was performed using the “rdacca.hp” package (Lai et al., 2022). The standard 0.05 level was used throughout as the threshold for statistical significance.
3.
Results
3.1
Soil and plant chemical parameters
Soil pH showed no significant trend, while soil TP, mineral N, and available P concentrations increased with increasing elevation. Soil C/P and N/P increased initially and then decreased with increasing elevation, reaching a maximum value at 903 m elevation, while soil C/N increased with increasing elevation (Table S2).
Tree leaf and root OC concentrations increased, but trunk OC unchanged with increasing elevation (Table 1). The TN and TP concentrations of tree leaves and roots increased with increasing elevation, while trunk TP concentrations increased at first and then decreased with increasing elevation. Leaf and root C/N and C/P decreased with increasing elevation, while trunk C/P decreased at first and then increased with increasing elevation. Leaf N/P increased at first and then decreased, while root N/P increased with increasing elevation (Table 1).
Table
1.
Mean values of plant chemical parameters in three organs of four tree species along an elevation gradient.
Elevation (m)
Organ
OC (g·kg−1)
TN (g·kg−1)
TP (g·kg−1)
C/N
C/P
N/P
609
Leaf
445.9 ± 5.4 ABa
12.7 ± 0.2 Ca
0.85 ± 0.02 Ba
35.3 ± 0.5 Ac
525.2 ± 10.3 Ac
14.9 ± 0.2 Ba
Trunk
434.8 ± 4.1 Aa
1.6 ± 0.1 Ac
0.32 ± 0.01 Cc
284.2 ± 14.6 Ba
1,376.5 ± 53.6 Aa
4.9 ± 0.1 Ac
Root
422.7 ± 2.4 Bb
3.4 ± 0.2 Cb
0.52 ± 0.01 Bb
128.3 ± 8.1 Ab
818.7 ± 18.9 Ab
6.6 ± 0.4 Bb
759
Leaf
435.1 ± 5.0 Ba
13.4 ± 0.3 Ca
0.86 ± 0.02 Ba
32.7 ± 0.7 Bc
509.0 ± 11.4 ABc
15.5 ± 0.1 Aa
Trunk
436.6 ± 4.0 Aa
1.7 ± 0.1 Ac
0.46 ± 0.01 Ac
275.3 ± 16.1 Ba
969.1 ± 34.1 Ca
3.6 ± 0.2 Bc
Root
421.9 ± 2.3 Bb
3.7 ± 0.3 Cb
0.53 ± 0.01 Bb
119.7 ± 9.1 Ab
806.4 ± 19.3 Ab
7.1 ± 0.4 Bb
903
Leaf
432.2 ± 5.1 Ba
13.8 ± 0.4 BCa
0.91 ± 0.03 Ba
31.5 ± 0.7 Bc
480.5 ± 14.6 Bc
15.2 ± 0.2 ABa
Trunk
437.6 ± 3.3 Aa
1.7 ± 0.1 Ac
0.40 ± 0.01 Bc
281.5 ± 22.2 Ba
1,109.5 ± 30.8 Ba
4.2 ± 0.3 ABc
Root
438.8 ± 3.1 Aa
4.4 ± 0.4 Cb
0.53 ± 0.01 Bb
111.2 ± 10.6 Ab
835.8 ± 15.1 Ab
8.3 ± 0.6 Bb
1,062
Leaf
436.1 ± 4.8 Ba
15.2 ± 0.5 Aa
1.22 ± 0.04 Aa
29.0 ± 0.8 Cc
358.3 ± 9.3 Cc
12.4 ± 0.2 Ca
Trunk
441.9 ± 2.7 Aa
1.6 ± 0.1 Ac
0.34 ± 0.01 Cc
296.5 ± 21.7 Ba
1,315.3 ± 53.4 Aa
4.7 ± 0.4 Ac
Root
435.3 ± 3.8 Aa
7.0 ± 0.4 Ab
0.69 ± 0.04 Ab
63.5 ± 3.9 Bb
659.3 ± 48.7 Bb
10.6 ± 0.4 Ab
1,207
Leaf
459.6 ± 5.0 Aa
14.7 ± 0.8 ABa
1.22 ± 0.07 Aa
31.8 ± 1.5 Bc
381.2 ± 16.6 Cc
12.0 ± 0.2 Ca
Trunk
439.6 ± 4.3 Ab
1.3 ± 0.1 Bc
0.31 ± 0.00 Cc
375.2 ± 41.3 Aa
1,414.2 ± 29.5 Aa
4.2 ± 0.5 ABc
Root
439.8 ± 2.5 Ab
5.7 ± 0.5 Bb
0.70 ± 0.05Ab
79.9 ± 6.3 Bb
646.7 ± 47.0 Bb
8.1 ± 0.1 Bb
Mean ± 1 standard error. Different uppercase and lowercase letters in the superscript indicate significant differences among different elevations and among three organs, respectively (p < 0.05). OC: organic carbon; TN: total nitrogen; TP: total phosphorus.
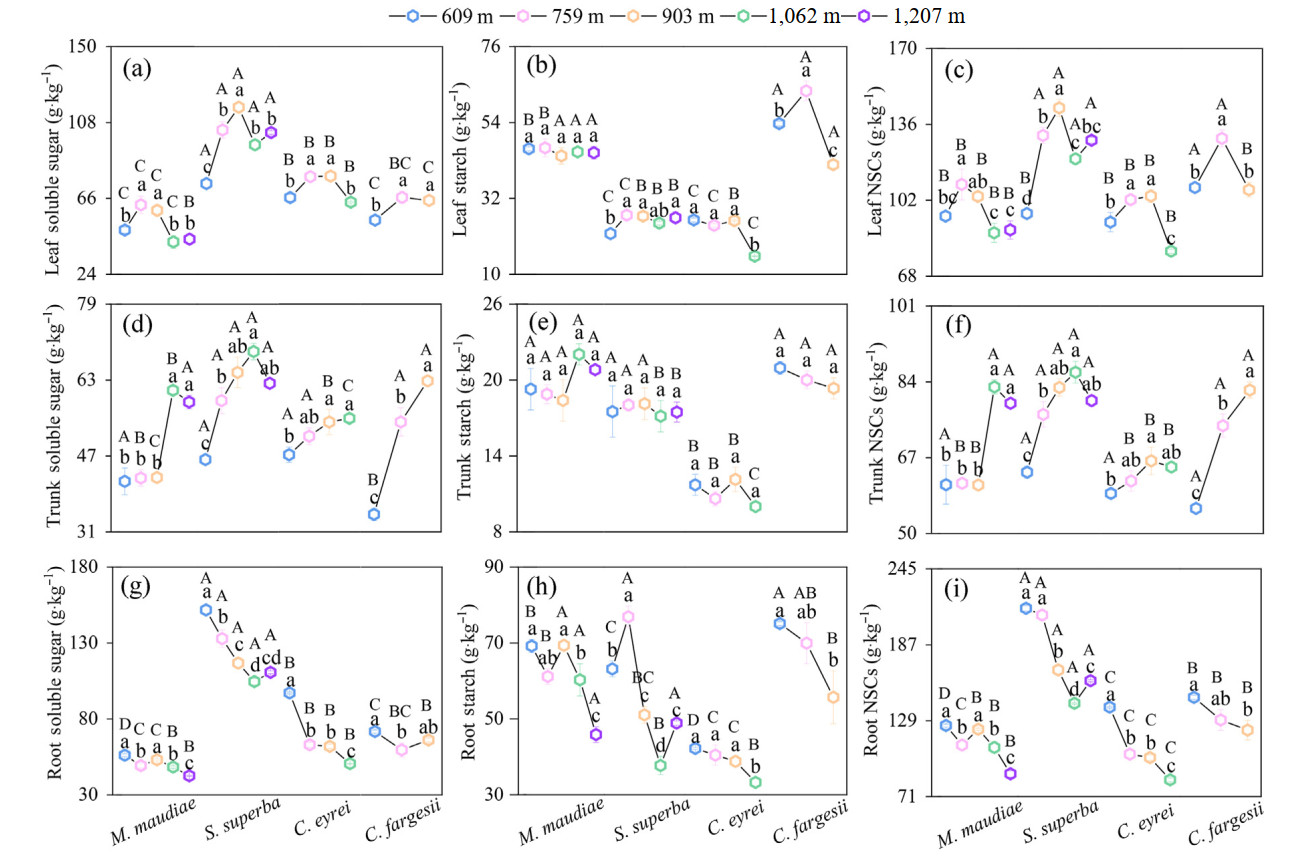
The leaf SS and NSCs of the four tree species first increased and then decreased with increasing elevation. Leaf SS and NSCs concentrations at 903 m elevation were significantly higher than those at 609 and 1,207 m, except for leaf NSCs in Michelia maudiae (Fig. 1a and c). There was no trend in leaf ST with increasing elevation, except in Castanopsis fargesii (Fig. 1b). In contrast, the trunk SS and NSCs concentrations of the four tree species increased, while no significant differences were found in trunk ST with increasing elevation (Fig. 1d–f). Moreover, the root SS, ST, and NSCs concentrations of the four tree species decreased with increasing elevation (Fig. 1g–i). The leaf NSCs in Schima superba and Castanopsis fargesii was higher than that in the other two tree species and the trunk NSCs showed the same trend at 759 and 903 m. The root NSCs in Schima superba was higher than that in the other tree species (Fig. 1). The trunk SS and NSCs were positively correlated, while the root ST and NSCs were negatively correlated with the elevation (Fig. S1).
Figure
1.
Soluble sugar (a, d, g), starch (b, e, h), and nonstructural carbohydrates (c, f, i) in three organs of four tree species in subtropical evergreen broad-leaved forests along an elevation gradient. The numbers in the legend represent the elevation. The bars indicate standard errors. Different lowercase and uppercase letters indicate significant differences among different elevations of a tree species and among tree species at the same elevation, respectively (p < 0.05). NSCs: nonstructural carbohydrates; M. maudiae: Michelia maudiae; S. superba: Schima superba; C. eyrei: Castanopsis eyrei and C. fargesii: Castanopsis fargesii.
The leaf SS/ST increased at first and then decreased in Michelia maudiae and Schima superba, reaching a maximum value at 903 m elevation, and showed an increasing trend in Castanopsis fargesii and Castanopsis eyrei with increasing elevation. The trunk SS/ST showed an increasing trend, while no obvious changes were found for the root SS/ST along the elevation gradient (Fig. S2).
3.3
Relative abundance of SCs
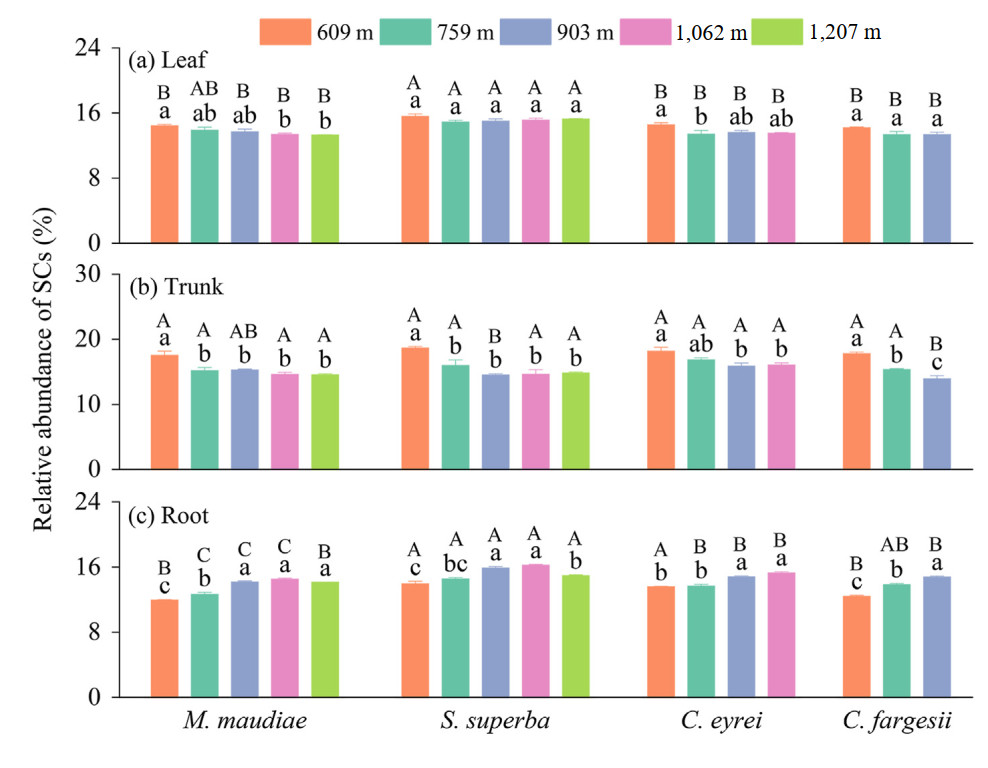
The relative abundance of leaf SCs of the four tree species decreased with increasing elevation. However, the relative abundances of leaf SCs of Schima superba and Castanopsis fargesii were not significantly different among elevations (Fig. 2a). The relative abundance of trunk SCs of the four tree species decreased with increasing elevation. The highest value was found at 609 m elevation, which was higher than that at elevations above 900 m (Fig. 2b). The relative abundance of root SCs of the four tree species increased with increasing elevation, and the relative abundance of root SCs at 609 m elevation was lower than that at other elevations (Fig. 2c). The relative abundance of leaf and root SCs in Schima superba was higher than that in the other three tree species (Fig. 2). The trunk SCs was negatively correlated, while the root SCs was positively correlated with the elevation (Fig. S1).
Figure
2.
The relative abundance of structural carbohydrates in three organs of four tree species in subtropical evergreen broad-leaved forests along an elevation gradient. The numbers in the legend represent the elevation. The bars indicate standard errors. Different lowercase and uppercase letters indicate significant differences among different elevations of a tree species and among tree species at the same elevation, respectively (p < 0.05). SCs: structural carbohydrates; M. maudiae: Michelia maudiae; S. superba: Schima superba; C. eyrei: Castanopsis eyrei and C. fargesii: Castanopsis fargesii.
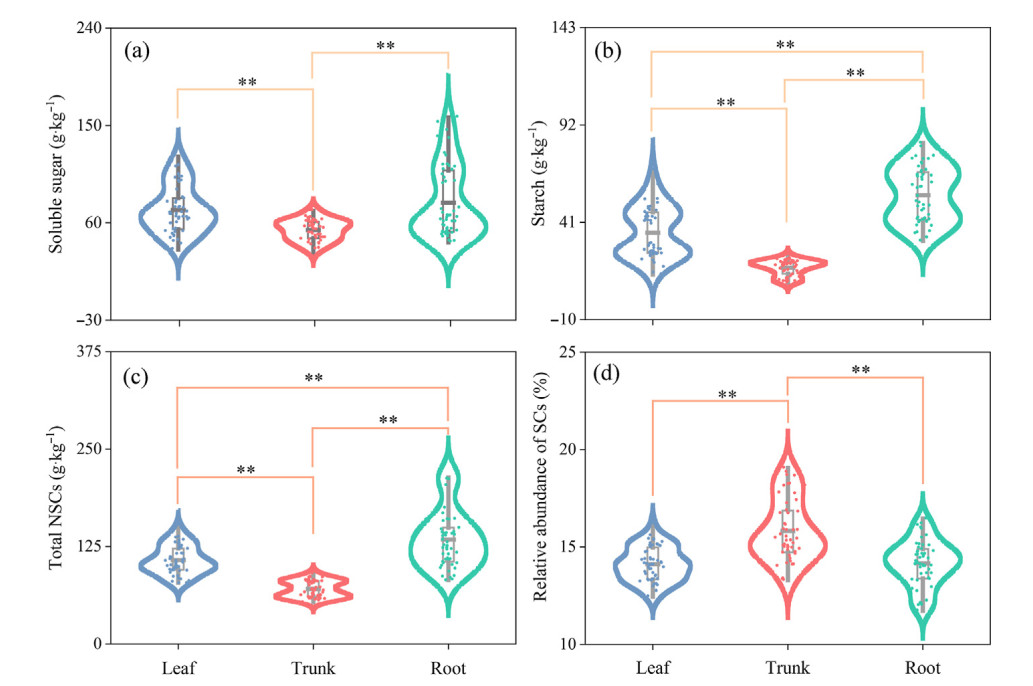
Tree organs significantly influenced SS, ST and NSCs. The SS concentration in leaves and roots was higher than that in trunks by 34.82% and 47.56%, respectively, while no significant difference was detected in SS between leaves and roots (Fig. 3a). The ST and NSCs concentrations were highest in the root, which were significantly higher than those in the trunk and leaf, and the ST in the trunk was lower than that in the leaf (Fig. 3b and c). Unlike NSCs, the relative abundance of SCs in leaves and roots was significantly lower by 10.9% and 10.6% than in trunks, respectively (Fig. 3d).
Figure
3.
Soluble sugar, starch, nonstructural and structural carbohydrates between three organs of four tree species in subtropical evergreen broad-leaved forest. The bars above and below the box represent the upper and lower limits of the data, respectively. *p < 0.05; **p < 0.01. NSCs: nonstructural carbohydrates; SCs: structural carbohydrates.
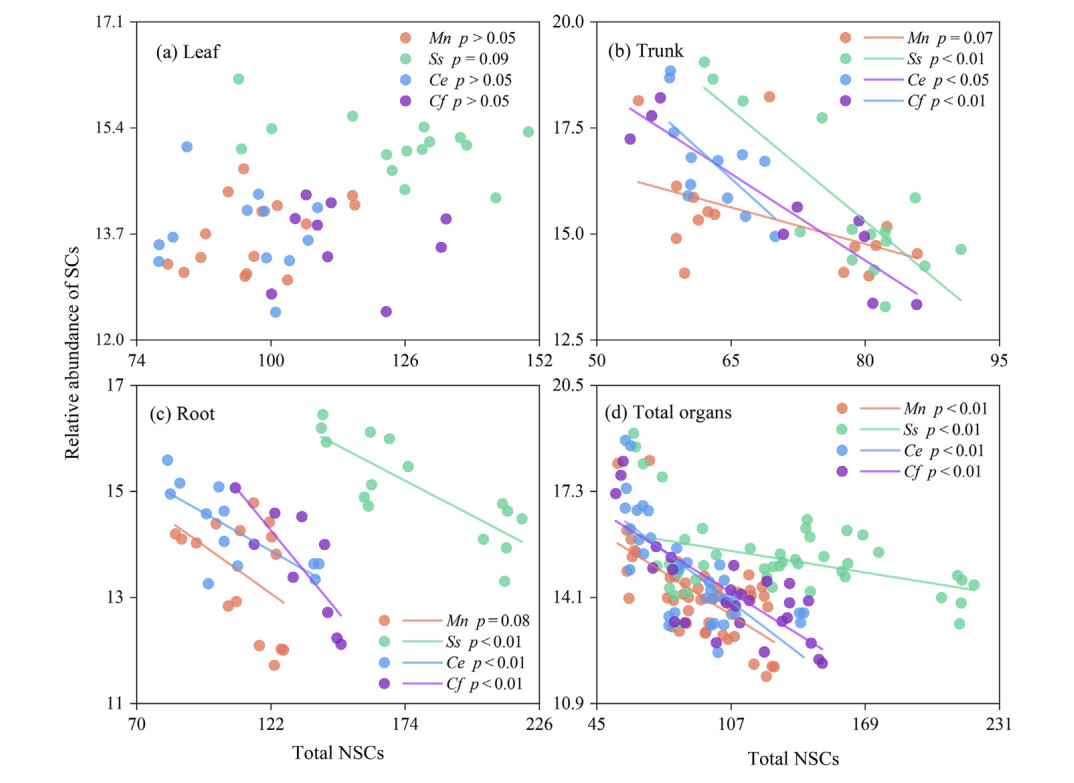
There was no significant correlation between the relative abundance of SCs and NSCs concentrations in leaves of the four tree species (Fig. 4a). Trunk and root SCs of Michelia maudiae showed a weak negative correlation with NSCs, while trunk and root SCs in the other three tree species showed a significant negative correlation with NSCs (Fig. 4b and c). When all organs were considered, the SCs of the four tree species were significantly negatively correlated with NSCs (Fig. 4d).
Figure
4.
The correlations between nonstructural and structural carbohydrates in tree organs of four tree species in subtropical evergreen broad-leaved forests. NSCs: nonstructural carbohydrates; SCs: structural carbohydrates. Mn: Michelia maudiae; Ss: Schima superba; Ce: Castanopsis eyrei and Cf: Castanopsis fargesii.
3.6
Drivers of NSCs concentrations and the relative abundance of SCs
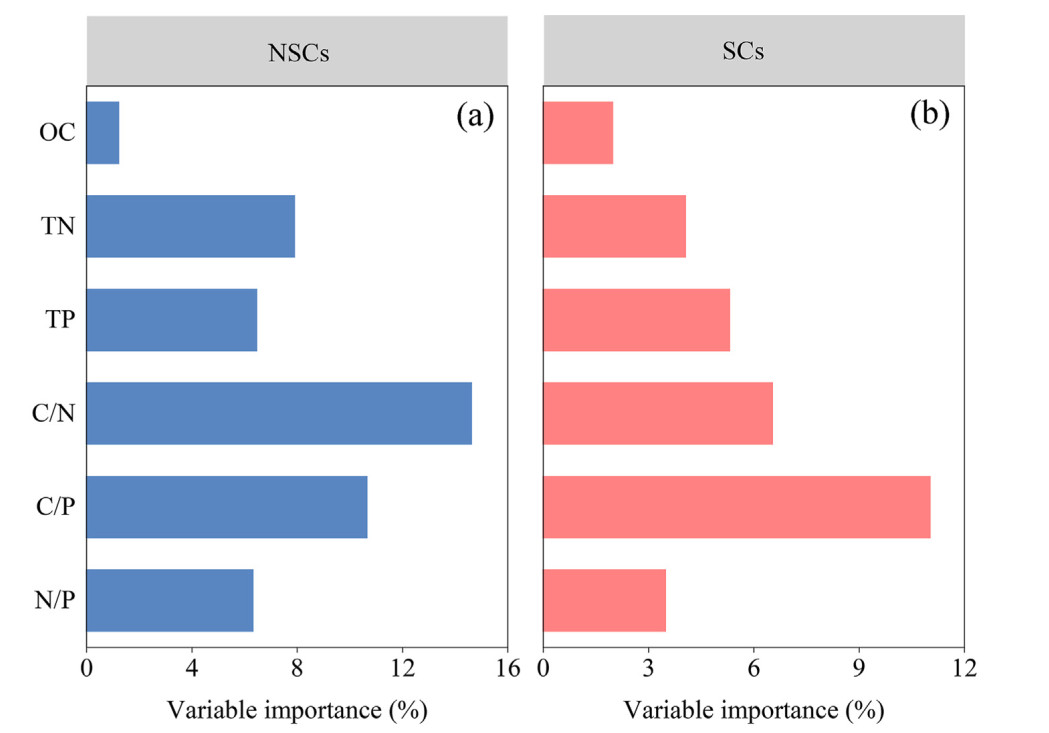
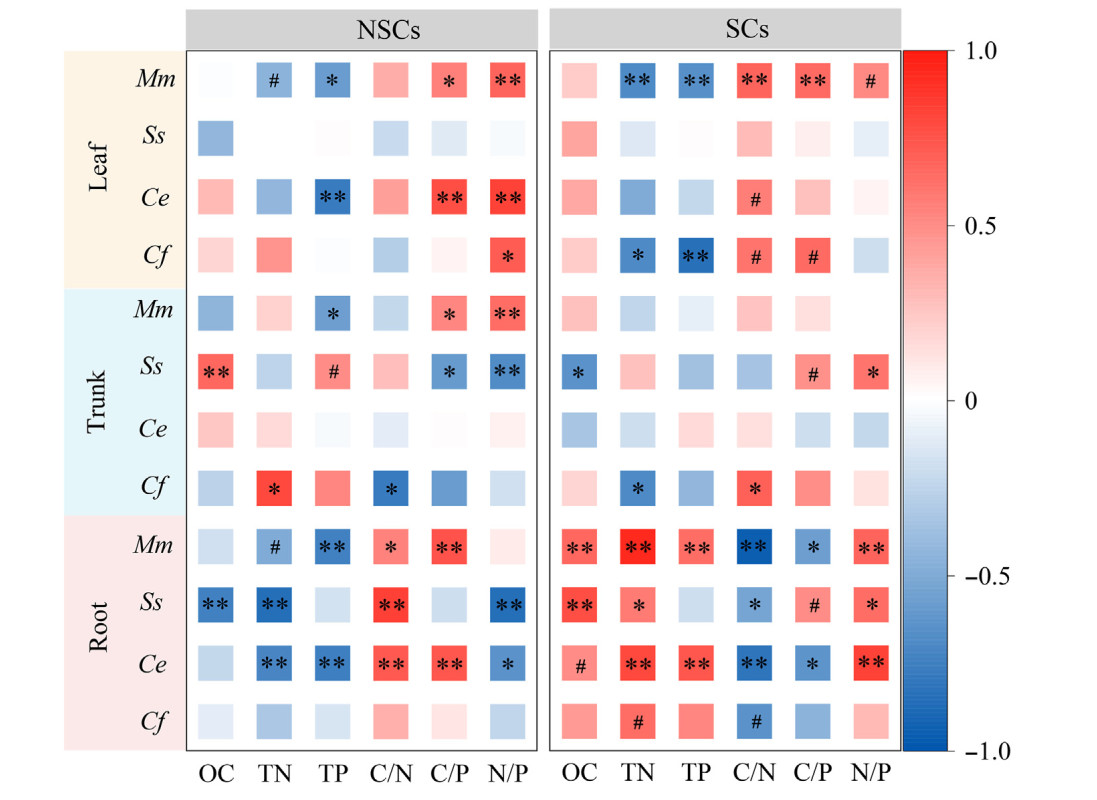
Hierarchical partitioning analysis showed that in decreasing order, plant C/N, C/P and TN were the main predictors of changes in NSCs. Similarly, plant C/P explained the highest proportion of SCs changes, followed by C/N and TP (Fig. 5). Leaf NSCs were positively correlated with the leaf N/P of Michelia maudiae, Castanopsis eyrei, and Castanopsis fargesii. Root NSCs were positively correlated with root C/N, while they were negatively correlated with root TN of Michelia maudiae, Schima superba and Castanopsis eyrei. Leaf SCs showed a significant positive correlation with the leaf C/N of Michelia maudiae, Castanopsis eyrei and Castanopsis fargesii. Root SCs showed a significant positive correlation with root TN, N/P and OC, while it showed a negative correlation with root C/N of three (Michelia maudiae, Schima superba and Castanopsis eyrei) or four tree species (Fig. 6).
Figure
5.
Individual importance (%) of plant variables to explain the variation of tree nonstructural and structural carbohydrates in subtropical evergreen broad-leaved forests by hierarchical partitioning. NSCs: nonstructural carbohydrates; SCs: structural carbohydrates. OC: organic carbon; TN: total nitrogen; TP: total phosphorus.
Figure
6.
The correlations among nonstructural carbohydrates, structural carbohydrates and plant chemical parameters in three organs of four tree species in subtropical evergreen broad-leaved forest. NSCs: nonstructural carbohydrates; SCs: structural carbohydrates. OC: organic carbon; TN: total nitrogen; TP: total phosphorus. Mn: Michelia maudiae; Ss: Schima superba; Ce: Castanopsis eyrei and Cf: Castanopsis fargesii.#p < 0.1; *p < 0.05; **p < 0.01.
4.1
Response of tree C distribution along the elevation gradient
Trees adapt to changing environmental conditions by regulating the distribution of photosynthates. Our results showed that there was an overall tradeoff between utilization and storage of tree C in the subtropics, but this phenomenon had a significant organ specificity (Figs. 1, 2 and 4).
No significant correlations between NSCs and SCs in leaves of four tree species were found. Leaf NSCs increased initially and then decreased with increasing elevation, with a maximum at 750–900 m elevation and no linear relationship between the leaf NSCs and the elevation was found, which was inconsistent with previous studies (Cao et al., 2018; Wang et al., 2018; Zhou et al., 2023). Meanwhile, the relative abundance of SCs in leaves showed a decreasing trend with increasing elevation. We speculated that NSCs and SCs in leaves were regulated by different factors. Changes in leaf NSCs with increasing elevation may be related to leaf nutrient limitation, because NSCs and N/P in leaves show a positive correlation (Fig. 6). Leaf N/P has been used as an indicator of plant nutrient limitation in many studies, and it is generally accepted that plants are P-limited when N/P is >16, N-limited when N/P is <14, and N and P co-limited when N/P is between 14 and 16 (Koerselman and Meuleman, 1996; Güsewell, 2004). Leaf N/P increased at first and then decreased with increasing elevation, with a mean of 14.3 across elevations, 15.2 at 600–900 m elevation, and 12.2 at 1,050–1,200 m elevation, indicating that trees growing at lower elevations in the region are limited by both N and P and that the N limitation of tree growth increased with increasing elevation. N deficiency causes a decrease in chlorophyll concentration, assimilation ability, and enzyme activities, further leading to a reduction in leaf area and photosynthetic assimilates (Güsewell, 2004; Cao et al., 2018). Similarly, leaf N deficiency can increase photosynthetic inhibitors that hinder photosynthetic processes and photosynthetic efficiency (Li et al., 2013; Liu et al., 2020). Moreover, when P supply becomes a limiting factor, it will have a significant impact on the expansion of plant leaves and reduce leaf growth rate, area and leaf numbers, inducing a decline in assimilation area and total C fixation by photosynthesis (Mollier and Pellerin, 1999; Cao et al., 2018). Additionally, a lack of P in the plant will result in a blockage of the organic P cycle during photosynthetic phosphorylation, which limits photosynthesis in the leaves (Mollier and Pellerin, 1999; Lambers et al., 2008). Therefore, the N and P restriction along the elevation gradient may be the main factor affecting the variation in leaf NSCs.
Although the leaf NSCs decreased with increasing elevation above 900 m, the NSCs above 900 m elevation were not lower than that at 600 m. The results showed that there was no considerable C restriction on the growth of trees between high and low elevations. Under the condition of a sufficient supply of NSCs, the decrease in leaf SCs may be attributed to the tree growth restriction caused by the decrease in temperature with increasing elevation. Trees at higher elevations with lower temperatures will put less in moving carbohydrates into structural growth, such as cellulose synthesis, than trees at lower elevations (higher temperatures). The lower temperature limits the growth rate related to cell division and elongation (Chapin et al., 1990), which is the reason for the decrease in the leaf SCs with increasing elevation (Hoch et al., 2003; Körner, 2003; Lenz et al., 2014). e.g. Richardson (2004) analyzed the cell wall compounds in the fir and spruce needles in an elevation sample belt and found that the needle cellulose of the two species decreased significantly with increasing elevation.
We found a clear tradeoff between the utilization and storage of C in the trunk and root (Fig. 4). The trunk NSCs concentration increased with increasing elevation, while the relative abundance of trunk SCs showed an opposite trend (Fig. S1). NSCs are mainly stored in plants in the form of SS and ST. SS is the main form of transport and utilization of carbohydrates in trees and plays an important physiological role in tree resistance to low temperature and osmotic regulation (Signori-Müller et al., 2021; Guo et al., 2022). Usually, a low-temperature environment can promote the accumulation of SS, increase the concentration of protoplasts and reduce plant cells' osmotic potential and freezing point, thus improving trees' adaptability to cold resistance (Zhu et al., 2012; Lenz et al., 2014; Blumstein et al., 2023). Trees with higher NSCs concentrations can be considered to contribute to active osmotic regulation at high elevations, which is one of the key strategies for plants to adapt to environmental stresses (such as freezing temperature) to avert the formation of intracellular ice (Zhu et al., 2012; Lenz et al., 2014; Blumstein et al., 2023). Therefore, the higher the concentration of SS is, the stronger the cold resistance of tree organs. The increase in SS in the trunk with increasing elevation is an adaptive strategy for the decrease in temperature, especially the lowest temperature (Signori-Müller et al., 2021; Guo et al., 2022). If more C is stored in the form of NSCs in the NSCs sink organ, this means a reduction in the amount of C allocated to SCs, which in turn led to a negative correlation between NSCs and SCs in the trunk.
The trend of NSCs in roots with increasing elevation was significantly different from that in leaves and trunks, and root NSCs decreased with increasing elevation. Trunk and root, as sink organs of NSCs, had different responses to the elevation gradient, which is related to their functions. The main function of root is to absorb water and nutrients from the soil and transports them upward to other plant organs (Corlett, 2016; Furze et al., 2018). Roots had the highest NSCs concentration, which was significantly higher than trunks and leaves (Fig. 3), indicating that tree roots are NSCs-consuming organs (Mollier and Pellerin, 1999; Furze et al., 2018; Yang et al., 2022). We speculate that the decrease in root NSCs with increasing elevation is related to its use of NSCs because there is a significant positive correlation between NSCs and SCs in the tree root. Leaf and root growth is limited by the availability of N, as shown by the N/P of roots and leaves (Table 1). The relative shortage of N supply may lead to an increase in C input in roots to obtain N, such as enhancing root morphogenesis, increasing root lifespan, and reducing turnover (Cannell et al., 1989; Zhang et al., 2018), which in turn increases N use efficiency and root acquisition of soil N (Osaki et al., 1991; Moinet et al., 2020; Yang et al., 2022). These processes induced a shift in photosynthetic products from NSCs to SCs, which led to an increase in the relative abundance of SCs and a decrease in NSCs concentration with increasing elevation. The positive correlation of SCs with TN and N/P in roots and the increase in root N/P with increasing elevation supported our speculations.
SS will be converted into ST when SS accumulates at high concentrations, and ST can be hydrolyzed into SS to maintain physiological activities when the SS level is low (Chapin et al., 1990; Furze et al., 2018). Although the trend of root ST decreasing along the elevation gradient had a certain fluctuation, the fact that not only SS but also ST in roots decreased with increasing elevation indicates that trees mobilize a large amount of NSCs, including mobilizing the decomposition of ST for the construction of root structure to cope with the relative N deficiency environment (Cannell et al., 1989; Zhang et al., 2018; Yang et al., 2022).
Meanwhile, we analyzed the transformation between SS and ST in three organs. SS can be directly used as a substrate in cell metabolism (Zhu et al., 2012; Overdieck, 2016), while ST serves as a long-term carbon storage because of its osmotic inactivity (Hartmann et al., 2020). Increased organ SS/ST is thought to be more C used in plant metabolism and growth, such as defense, osmotic regulation and symbiosis (Zhang et al., 2018; Signori-Müller et al., 2021; Yang et al., 2022). Since the ST in leaf and trunk did not change significantly with increasing elevation, the ratios of SS/ST were mainly related to the change of SS. Changes in SS were mainly attributed to the nutrient limitation of SS synthesis in leaves and the responses of trunks to low temperatures, as discussed earlier (Zhu et al., 2012; Lenz et al., 2014; Blumstein et al., 2023). Due to the lack of nutrients in trees, more C received by roots was transformed into SCs, resulting in the decrease of SS and ST synchronously and inducing no significant change in root SS/ST (Moinet et al., 2020; Wang et al., 2022). However, the leaf and trunk SCs decreased, while the root SCs increased along the elevation gradient, which was not consistent with the changes of SS/ST. This means that organ SS/ST may not fully represent the C input for plant structural growth, and the differences in responses of SCs and SS/ST to increasing elevation are worthy in the further study.
Our results suggested that there is a tradeoff of tree C distribution between growth and storage in trunks and roots and highlighted that we should consider the differences in the response of tree organs along the elevation gradient in the future when evaluating the response of tree growth to elevation.
4.2
Differences of NSCs and SCs among organs or tree species
The differences of C distribution among tree organs were reflected not only in their responses to the elevation gradient, but also in their concentrations. The SS, ST and NSCs in leaves and roots were significantly higher than those in trunks, while the relative abundance of SCs showed an opposite trend (Fig. 3). The NSCs in tree organs are closely related to their activity, and organs with active metabolism usually have high levels of NSCs (Kuster et al., 2013; Martínez-Vilalta et al., 2016), which was also confirmed in our study. Higher NSCs means more active tissue metabolism, which provides a guarantee for plants to obtain light, water and nutrients through leaves and roots (Cannell et al., 1989; Zhang et al., 2018; Wang et al., 2022, 2023). The metabolic rate of the trunk is generally lower than that of the root and leaf, and the trunk performs more support and transport functions, so it had a higher abundance of structural carbohydrates.
The differences of NSCs and SCs among tree species were determined by their living habits. In this study, Michelia maudiae is a sun-loving plant, while Schima superba, Castanopsis eyrei and Castanopsis fargesii are shade-tolerant plants (Jian et al., 2009; Liu et al., 2020). It is generally believed that the NSCs concentration increases with the increase of shade resistance. Shade-tolerant tree species have higher NSCs concentrations, but light-loving plants are on the contrary (Poorter and Kitajima, 2007; Zhang et al., 2013; Liu et al., 2020). Moreover, Schima superba has stronger adaptability than two Fagaceae tree species (Cai and Song, 1997). Schima superba population forms a community with other dominant populations, such as Castanopsis eyrei and Castanopsis fargesii, in habitats with sufficient resources, while Schima superba population can form a single dominant community in harsh habitats (Cai and Song, 1997; Jian et al., 2009). Tree NSCs concentration, as a result of plants’ long-term response to environmental changes, usually corresponds to their adaptability, which explained why the NSCs was highest in Schima superba. High NSCs provided sufficient substrate for the synthesis of SCs and cell metabolism (Lambers et al., 2008; Overdieck, 2016), which led to similar differences in SCs among tree species.
4.3
Potential response of tree C allocation to global climate change
Global climate change, such as global warming, is changing resource availability and plant physiology in forest ecosystems around the world, thereby affecting tree resource allocation and growth (Zhu et al., 2012; Zhou et al., 2022). However, much of our knowledge about the response of forests to global climate change was based on the growth of seedlings/saplings under artificially controlled conditions (Kuster et al., 2013; Li et al., 2017). Elevation can serve as an agent of global warming in the natural environment, predicting the possible response and adaptation of trees (Wang et al., 2018).
The organs NSCs and SCs of four tree species showed unique responses to the increase of elevation, which indicates that global warming will further affect the tree growth and community structure by influencing plant physiological processes (Carvalhais et al., 2014; Qi et al., 2015). Moreover, the utilization and allocation of C by trees and their physiological responses to global warming were organ-specific (Zhu et al., 2012; Yang et al., 2022). Although the trends of NSCs concentrations in the three organs were different with increasing elevation (Fig. 1), no C limitation situation was demonstrated. Thus, the changes of NSCs may not theoretically become a factor restricting plant growth under global warming.
However, we speculate that warming will increase the C allocation of shoots and decrease the C allocation of roots, thus increasing the growth potential of trees, because the relative abundance of SCs in leaves and trunks increased while the SCs in roots decreased with increasing temperature (decrease in elevation). This result is supported by previous studies (Wang et al., 2012; Li et al., 2017). Wang et al. (2012) found that warming induced Abies faxoniana seedlings to devote more biomass into leaves and significantly decreased the root:shoot ratio by simulating the increase of temperature for 6 years. Similarly, global warming will increase the decomposition of aboveground litter and soil organic matter (Petraglia et al., 2019; Wu et al., 2020), and enhance the availability of soil nutrients, thereby reducing plant investment of SCs in roots. Such changes may favor better utilization of light resources by trees and somewhat increase the growth and competitiveness of trees in the scenario of global warming, leading to an upward shift of the treelines or a northward movement of the tree range in the subtropics (Hoch et al., 2003; Qi et al., 2015). Of course, this conclusion has limitations, because warming also implies a decrease in soil available water and the occurrence of drought, which may lead to an increase in C investment in tree roots and consequently reduce aboveground C allocation (Zhou et al., 2022). Therefore, our findings are more applicable in the subtropics, where water is abundant and cannot be a factor restricting tree growth, because the average annual precipitation of this study site is greater than 1,800 mm.
One of the study's deficiencies is the possible differences among tree species at different elevations due to local adaptation, which could confound the observed responses to different elevations. As a result, the difference observed may be due to genetic differences, not a direct response to environmental conditions. A seedling transplanting experiment study should be conducted to tease apart the genetic and ecological responses through planting seedlings from the same population at different elevations and planting seedlings from the study plots of different elevations in the same environment (i.e. a common garden) in the future.
5.
Conclusions
We investigated the distribution of NSCs and SCs in leaves, trunks, and roots of four tree species in subtropical evergreen broad-leaved forests across an elevation gradient and highlighted the variability in the response of tree organs to elevation. The relative abundance of SCs in leaves and trunks decreased, while the relative abundance of SCs in roots increased with increasing elevation, indicating that the increase in elevation will inhibit the growth of the aboveground parts and enhance the growth of the underground parts of trees. No significant correlation was found between the relative abundance of SCs and NSCs in leaves, while SCs were negatively correlated with NSCs in trunks, roots, and all organs, suggesting that there is a tradeoff between the C allocation used for growth and storage, which is mainly manifested in the “sink” organ of NSCs. Our study provides valuable insights into the growth and adaptation mechanisms of subtropical forests under climate change scenarios by simultaneously investigating the distribution and tradeoff of NSCs and SCs in different tree organs.
Data availability statement
The data are available from the corresponding author on reasonable request.
The authors declare that they have no known competing financial interests or personal relationships that could have appeared to influence the work reported in this paper.
Blumstein, M., Gersony, J., Martínez-Vilalta, J., Sala, A., 2023. Global variation in nonstructural carbohydrate stores in response to climate. Glob. Change Biol. 29, 1854-1869. .
Cai, F., Song, Y.C., 1997. A study on the structure and dynamics of Schima superba population on Wuyi mountain. Chin. J. Plant Ecol. 21, 138-148 (in Chinese).
Cannell, M.G.R., Grace, J., Booth, A., 1989. Possible impacts of climatic warming on trees and forests in the United Kingdom: a review. Forestry 62, 337-364. .
Cao, Y., Li, Y.N., Chen, Y.M., 2018. Non-structural carbon, nitrogen, and phosphorus between black locust and Chinese pine plantations along a precipitation gradient on the Loess Plateau, China. Trees (Berl.) 32, 835-846. .
Carvalhais, N., Forkel, M., Khomik, M., Bellarby, J., Jung, M., Migliavacca, M., Μu, M., Saatchi, S., Santoro, M., Thurner, M., Weber, U., Ahrens, B., Beer, C., Cescatti, A., Randerson, J.T., Reichstein, M., 2014. Global covariation of carbon turnover times with climate in terrestrial ecosystems. Nature 514, 213-217. .
Chapin, F.S., Schulze, E., Mooney, H.A., 1990. The ecology and economics of storage in plants. Annu. Rev. Ecol. Syst. 21, 423-447. .
Corlett, R.T., 2016. The impacts of droughts in tropical forests. Trends Plant Sci. 21, 584-593. .
Feng, J.Y., Chen, F.S., Tang, F.R., Wang, F.C., Liang, K., He, L.Y., Huang, C., 2022. The trade-offs and synergies of ecosystem services in Jiulianshan National Nature Reserve in Jiangxi Province, China. Forests 13, 416. .
Furze, M.E., Huggett, B.A., Aubrecht, D.M., Stolz, C.D., Carbone, M.S., Richardson, A.D., 2018. Whole-tree nonstructural carbohydrate storage and seasonal dynamics in five temperate species. New Phytol. 221, 1466-1477. .
Guo, X.W., Liu, S.R., Wang, H., Chen, Z.C., Zhang, J.L., Chen, L., Nie, X.Q., Zheng, L., Cai, D.X., Jia, H.Y., Niu, B.L., 2022. Divergent allocations of nonstructural carbohydrates shape growth response to rainfall reduction in two subtropical plantations. For. Ecosyst. 9, 100021. .
Güsewell, S., 2004. N:P ratios in terrestrial plants: variation and functional significance. New Phytol. 164, 243-266. .
Hartmann, H., Bahn, M., Carbone, M., Richardson, A.D., 2020. Plant carbon allocation in a changing world – challenges and progress: Introduction to a virtual issue on carbon allocation. New Phytol. 227, 981-988. .
Herrera-Ramírez, D., Sierra, C.A., Römermann, C., Muhr, J., Trumbore, S., Silvério, D., Brando, P.M., Hartmann, H., 2021. Starch and lipid storage strategies in tropical trees relate to growth and mortality. New Phytol. 230, 139-154. .
Hoch, G., Richter, A., Körner, C., 2003. Non-structural carbon compounds in temperate forest trees. Plant Cell Environ. 26, 1067-1081. .
Jian, M.F., Liu, Q.J., Zhu, D., You, H., 2009. Inter-specific correlations among dominant populations of tree layer species in evergreen broad-leaved forests in Jiulianshan Mountain of subtropical China. Chin. J. Plant Ecol. 33, 672-680. (in Chinese).
Koerselman, W., Meuleman, A., 1996. The vegetation N:P ratio: a new tool to detect the nature of nutrient limitation. J. Appl. Ecol. 33, 1441-1450. .
Körner, C., 2003. Carbon limitation in trees. J. Ecol. 91, 4-17. .
Kuster, T.M., Arend, M., Günthardt-Goerg, M.S., Schulin, R., 2013. Root growth of different oak provenances in two soils under drought stress and air warming conditions. Plant Soil 369, 61-71. .
Lai, J.S., Zou, Y., Zhang, J.L., Peres-Neto, P.R., 2022. Generalizing hierarchical and variation partitioning in multiple regression and canonical analyses using the rdacca. hp R package. Methods Ecol. Evol. 13, 782-788. .
Lambers, H., Chapin, F.S., Pons, T.L., 2008. Photosynthesis. In: Lambers, H., Chapin, F.S., Pons, T.L. (Eds.), Plant Physiological Ecology. Springer, New York, pp. 11–99.
Lenz, A., Vitasse, Y., Hoch, G., Körner, C., 2014. Growth and carbon relations of temperate deciduous tree species at their upper elevation range limit. J. Ecol. 102, 1537-1548. .
Li, M.H., Cherubini, P., Dobbertin, M., Arend, M., Xiao, W.F., Rigling, A., 2013. Responses of leaf nitrogen and mobile carbohydrates in different Quercus species/provenances to moderate climate changes. Plant Biol. 15, 177-184. .
Li, W.Q., Huang, Y.X., Chen, F.S., Liu, Y.Q., Lin, X.F., Zong, Y.Y., Wu, G.Y., Yu, Z.R., Fang, X.M., 2021. Mixing with broad-leaved trees shapes the rhizosphere soil fungal communities of coniferous tree species in subtropical forests. For. Ecol. Manag. 480, 118664. .
Li, Y.Y., Zhou, G.Y., Liu, J.X., 2017. Different growth and physiological responses of six subtropical tree species to warming. Front. Plant Sci. 8, 1511. .
Liu, Q.Q., Huang, Z.J., Wang, Z.N., Chen, Y.F., Wen, Z.M., Liu, B., Tigabu, M., 2020. Responses of leaf morphology, NSCs contents and C:N:P stoichiometry of Cunninghamia lanceolata and Schima superba to shading. BMC Plant Biol. 20, 354. .
Martínez-Vilalta, J., Sala, A., Asensio, D., Galiano, L., Hoch, G., Palacio, S., Piper, F.I., Lloret, F., 2016. Dynamics of non-structural carbohydrates in terrestrial plants: a global synthesis. Ecol. Monogr. 86, 495-516. .
Moinet, G.Y.K., Moinet, M., Hunt, J.E., Rumpel, C., Chabbi, A., Millard, P., 2020. Temperature sensitivity of decomposition decreases with increasing soil organic matter stability. Sci. Total Environ. 704, 135460. .
Mollier, A., Pellerin, S., 1999. Maize root system growth and development as influenced by phosphorus deficiency. J. Exp. Bot. 50, 487-497. .
Moreau, L., Thiffault, E., Cyr, D., Boulanger, Y., Beauregard, R., 2022. How can the forest sector mitigate climate change in a changing climate? Case studies of boreal and northern temperate forests in eastern Canada. For. Ecosyst. 9, 100026. .
Ni, J., Song, Y.C., 1997. The water-temperature distributional groups of dominants and companions of subtropical evergreen broad-leaved forest in China. Chin. J. Plant Ecol. 21, 349-359 (in Chinese).
Osaki, M., Shinano, T., Tadano, T., 1991. Redistribution of carbon and nitrogen compounds from the shoot to the harvesting organs during maturation in field crops. Soil Sci. Plant Nutr. 37, 117-128. .
Overdieck, D., 2016. Nonstructural and structural carbohydrates. In: Overdieck, D. (Ed.), CO2, Temperature, and Trees: Experimental Approaches. Springer Singapore, pp. 65–79.
Petraglia, A., Cacciatori, C., Chelli, S., Fenu, G., Calderisi, G., Gargano, D., Abeli, T., Orsenigo, S., Carbognani, M., 2019. Litter decomposition: effects of temperature driven by soil moisture and vegetation type. Plant Soil 435, 187-200. .
Poorter, L., Kitajima, K., 2007. Carbohydrate storage and light requirements of tropical moist and dry forest tree species. Ecology 88, 1000-1011. .
Prates, L.L., Refat, B., Lei, Y.G., Mariana, L.P., Yu, P.Q., 2018. Relationship of carbohydrates and lignin molecular structure spectral profiles to nutrient profile in newly developed oats cultivars and barley grain. Spectrochim. Acta Mol. Biomol. Spectrosc. 188, 495-506. .
Qi, Z.H., Liu, H.Y., Wu, X.C., Hao, Q., 2015. Climate-driven speedup of alpine treeline forest growth in the Tianshan Mountains, Northwestern China. Glob. Change Biol. 21, 816-826. .
Richardson, A.D., 2004. Foliar chemistry of balsam fir and red spruce in relation to elevation and the canopy light gradient in the mountains of the northeastern United States. Plant Soil 260, 291-299. .
Seifter, S., Dayton, S., 1950. The estimation of glycogen with the anthrone reagent. Arch. Biochem. 25, 191–200. (accessed 15 December 2023).
Signori-Müller, C., Oliveira, R.S., Barros, F.D.V., Tavares, J.V., Gilpin, M., Diniz, F.C., Zevallos, M.J.M., Yupayccana, C.A.S., Acosta, M., Bacca, J., Chino, R.S.C., Cuellar, G.M.A., Cumapa, E.R.M., Martinez, F., Mullisaca, F.M.P., Nina, A., Sanchez, J.M.B., Da Silva, L.F., Tello, L., Tintaya, J.S., Ugarteche, M.T.M., Baker, T.R., Bittencourt, P.R.L., Borma, L.S., Brum, M., Castro, W., Coronado, E.N.H., Cosio, E.G., Feldpausch, T.R., Fonseca, L.d’A.M., Gloor, E., Llampazo, G.F., Malhi, Y., Mendoza, A.M., Moscoso, V.C., Araujo-Murakami, A., Phillips, O.L., Salinas, N., Silveira, M., Talbot, J., Vasquez, R., Mencuccini, M., Galbraith, D., 2021. Non-structural carbohydrates mediate seasonal water stress across Amazon forests. Nat. Commun. 12, 2310. .
Wang, A., Bose, A.K., Lehmann, M.M., Rigling, A., Gessler, A., Yu, L.F., Li, M.H., 2023. Water status and macronutrient concentrations, but not carbon status, of Viscum album ssp. album are determined by its hosts: a study across nine mistletoe–host pairs in central Switzerland. Front. Plant Sci. 14, 1142760. .
Wang, A., Wang, X., Tognetti, R., Lei, J.P., Pan, H.L., Liu, X., Jiang, Y., Wang, X.Y., He, P., Yu, F.H., Li, M.H., 2018. Elevation alters carbon and nutrient concentrations and stoichiometry in Quercus aquifolioides in southwestern China. Sci. Total Environ. 622 (623), 1463-1475. .
Wang, J.C., Duan, B.L., Zhang, Y.B., 2012. Effects of experimental warming on growth, biomass allocation, and needle chemistry of Abies faxoniana in even-aged monospecific stands. Plant Ecol. 213, 47-55. .
Wang, W.M., Li, C.H., Shu, J.W., Chen, W., 2019. Changes of vegetation in southern China. Sci. China Earth Sci. 62, 1316-1328. .
Wang, X., Yu, F.H., Jiang, Y., Li, M.H., 2021. Carbon and nutrient physiology in shrubs at the upper limits: a multispecies study. J. Plant Ecol. 14, 301-309. .
Wang, Z.H., Zheng, R., Yang, L.L., Tan, T.H., Li, H.B., Liu, M., 2022. Elevation gradient distribution of indices of tree population in a montane forest: the role of leaf traits and the environment. For. Ecosyst. 9, 100012. .
Wu, Q.Q., Yue, K., Wang, X.C., Ma, Y.D., Li, Y., 2020. Differential responses of litter decomposition to warming, elevated CO2, and changed precipitation regime. Plant Soil 455, 155-169. .
Xin, H.S., Ding, X., Zhang, L.Y., Sun, F., Wang, X.F., Zhang, Y.G., 2017. Investigation of the spectroscopic information on functional groups related to carbohydrates in different morphological fractions of corn stover and their relationship to nutrient supply and biodegradation characteristics. J. Agric. Food Chem. 65, 4035-4043. .
Yang, X.J., Jiang, Y., Xue, F., Ding, X.Y., Cui, M.H., Dong, M.Y., Kang, M.Y., 2022. Soil moisture controls on the dynamics of nonstructural carbohydrate storage in Picea meyeri during the growing season. Agric. For. Meteorol. 326, 109162. .
Zhang, C.X., Meng, S., Li, M.J., Zhao, Z., 2018. Transcriptomic insight into nitrogen uptake and metabolism of Populus simonii in response to drought and low nitrogen stresses. Tree Physiol. 38, 1672-1684. .
Zhang, M., Zhu, J.J., Li, M.C., Zhang, G.Q., Yan, Q.L., 2013. Different light acclimation strategies of two coexisting tree species seedlings in a temperate secondary forest along five natural light levels. For. Ecol. Manag. 306, 234-242. .
Zhang, X.W., Yu, P.Q., 2012. Relationship of carbohydrate molecular spectroscopic features in combined feeds to carbohydrate utilization and availability in ruminants. Spectrochim. Acta Mol. Biomol. Spectrosc. 92, 225-233. .
Zhou, L.Y., Zhou, X.H., He, Y.H., Fu, Y.L., Du, Z.G., Lu, M., Sun, X.Y., Li, C.H., Lu, C.Y., Liu, R.Q., Zhou, G.Y., Bai, S.H., Thakur, M.P., 2022. Global systematic review with meta-analysis shows that warming effects on terrestrial plant biomass allocation are influenced by precipitation and mycorrhizal association. Nat. Commun. 13, 4914. .
Zhou, Q., Shi, H., Zhang, Q.F., Dang, H.S., 2023. Global patterns of mobile carbon partitioning in mountain trees in response to elevation. Environ. Exp. Bot. 208, 105248. .
Zhu, W.Z., Xiang, J.S., Wang, S.G., Li, M.H., 2012. Resprouting ability and mobile carbohydrate reserves in an oak shrubland decline with increasing elevation on the eastern edge of the Qinghai–Tibet Plateau. For. Ecol. Manag. 278, 118-126. .
Table
1.
Mean values of plant chemical parameters in three organs of four tree species along an elevation gradient.
Elevation (m)
Organ
OC (g·kg−1)
TN (g·kg−1)
TP (g·kg−1)
C/N
C/P
N/P
609
Leaf
445.9 ± 5.4 ABa
12.7 ± 0.2 Ca
0.85 ± 0.02 Ba
35.3 ± 0.5 Ac
525.2 ± 10.3 Ac
14.9 ± 0.2 Ba
Trunk
434.8 ± 4.1 Aa
1.6 ± 0.1 Ac
0.32 ± 0.01 Cc
284.2 ± 14.6 Ba
1,376.5 ± 53.6 Aa
4.9 ± 0.1 Ac
Root
422.7 ± 2.4 Bb
3.4 ± 0.2 Cb
0.52 ± 0.01 Bb
128.3 ± 8.1 Ab
818.7 ± 18.9 Ab
6.6 ± 0.4 Bb
759
Leaf
435.1 ± 5.0 Ba
13.4 ± 0.3 Ca
0.86 ± 0.02 Ba
32.7 ± 0.7 Bc
509.0 ± 11.4 ABc
15.5 ± 0.1 Aa
Trunk
436.6 ± 4.0 Aa
1.7 ± 0.1 Ac
0.46 ± 0.01 Ac
275.3 ± 16.1 Ba
969.1 ± 34.1 Ca
3.6 ± 0.2 Bc
Root
421.9 ± 2.3 Bb
3.7 ± 0.3 Cb
0.53 ± 0.01 Bb
119.7 ± 9.1 Ab
806.4 ± 19.3 Ab
7.1 ± 0.4 Bb
903
Leaf
432.2 ± 5.1 Ba
13.8 ± 0.4 BCa
0.91 ± 0.03 Ba
31.5 ± 0.7 Bc
480.5 ± 14.6 Bc
15.2 ± 0.2 ABa
Trunk
437.6 ± 3.3 Aa
1.7 ± 0.1 Ac
0.40 ± 0.01 Bc
281.5 ± 22.2 Ba
1,109.5 ± 30.8 Ba
4.2 ± 0.3 ABc
Root
438.8 ± 3.1 Aa
4.4 ± 0.4 Cb
0.53 ± 0.01 Bb
111.2 ± 10.6 Ab
835.8 ± 15.1 Ab
8.3 ± 0.6 Bb
1,062
Leaf
436.1 ± 4.8 Ba
15.2 ± 0.5 Aa
1.22 ± 0.04 Aa
29.0 ± 0.8 Cc
358.3 ± 9.3 Cc
12.4 ± 0.2 Ca
Trunk
441.9 ± 2.7 Aa
1.6 ± 0.1 Ac
0.34 ± 0.01 Cc
296.5 ± 21.7 Ba
1,315.3 ± 53.4 Aa
4.7 ± 0.4 Ac
Root
435.3 ± 3.8 Aa
7.0 ± 0.4 Ab
0.69 ± 0.04 Ab
63.5 ± 3.9 Bb
659.3 ± 48.7 Bb
10.6 ± 0.4 Ab
1,207
Leaf
459.6 ± 5.0 Aa
14.7 ± 0.8 ABa
1.22 ± 0.07 Aa
31.8 ± 1.5 Bc
381.2 ± 16.6 Cc
12.0 ± 0.2 Ca
Trunk
439.6 ± 4.3 Ab
1.3 ± 0.1 Bc
0.31 ± 0.00 Cc
375.2 ± 41.3 Aa
1,414.2 ± 29.5 Aa
4.2 ± 0.5 ABc
Root
439.8 ± 2.5 Ab
5.7 ± 0.5 Bb
0.70 ± 0.05Ab
79.9 ± 6.3 Bb
646.7 ± 47.0 Bb
8.1 ± 0.1 Bb
Mean ± 1 standard error. Different uppercase and lowercase letters in the superscript indicate significant differences among different elevations and among three organs, respectively (p < 0.05). OC: organic carbon; TN: total nitrogen; TP: total phosphorus.

 DownLoad:


 Email Alerts
 RSS Feeds