Tong Zheng, Jordi Martínez-Vilalta, Raúl García-Valdés, Antonio Gazol, J. Julio Camarero, Changcheng Mu, Maurizio Mencuccini. Growth plasticity of conifers did not avoid declining resilience to soil and atmospheric droughts during the 20th century[J]. Forest Ecosystems, 2023, 10(1): 100107. DOI: 10.1016/j.fecs.2023.100107
Citation:
Tong Zheng, Jordi Martínez-Vilalta, Raúl García-Valdés, Antonio Gazol, J. Julio Camarero, Changcheng Mu, Maurizio Mencuccini. Growth plasticity of conifers did not avoid declining resilience to soil and atmospheric droughts during the 20th century[J]. Forest Ecosystems, 2023, 10(1): 100107. DOI: 10.1016/j.fecs.2023.100107
Tong Zheng, Jordi Martínez-Vilalta, Raúl García-Valdés, Antonio Gazol, J. Julio Camarero, Changcheng Mu, Maurizio Mencuccini. Growth plasticity of conifers did not avoid declining resilience to soil and atmospheric droughts during the 20th century[J]. Forest Ecosystems, 2023, 10(1): 100107. DOI: 10.1016/j.fecs.2023.100107
Citation:
Tong Zheng, Jordi Martínez-Vilalta, Raúl García-Valdés, Antonio Gazol, J. Julio Camarero, Changcheng Mu, Maurizio Mencuccini. Growth plasticity of conifers did not avoid declining resilience to soil and atmospheric droughts during the 20th century[J]. Forest Ecosystems, 2023, 10(1): 100107. DOI: 10.1016/j.fecs.2023.100107
Northeast Forestry University, Harbin, 150040, China
b.
CREAF, E08193 Bellaterra (Cerdanyola del Vallès), Catalonia, Spain
c.
Universitat Autònoma de Barcelona, E08193 Bellaterra (Cerdanyola del Vallès), Catalonia, Spain
d.
Centre de Ciència i Tecnologia Forestal de Catalunya (CTFC), E-25280, Solsona, Spain
e.
Department of Biology, Geology, Physics and Inorganic Chemistry, Rey Juan Carlos University, 28933, Móstoles, Madrid, Spain
f.
Instituto Pirenaico de Ecologia (IPE-CSIC), Zaragoza, 50059, Spain
g.
ICREA, 08010, Barcelona, Spain
Funds: TZ acknowledges contribution from the China Scholarship Council (CSC). MM and JM-V received support from the Spanish Ministry of Science and Innovation (MICINN) via competitive grant CGL2017-89149-C2-1-R. MM also received support from the EU2020 competitive grant Forgenius. JM-V and RG-V benefited from an ICREA Academia award. AG and JJC were supported by the FUNDIVER project of the Spanish Ministry of Science and Innovation (CGL2015-69186-C2-1-R)
Background Plasticity in response to environmental drivers can help trees cope with droughts. However, our understanding of the importance of plasticity and physiological adjustments in trees under global change is limited.
Methods We used the International Tree-Ring Data Bank (ITRDB) to examine 20th century growth responses in conifer trees during (resistance) and following (resilience) years of severe soil and atmospheric droughts occurring in isolation or as compound events. Growth resilience indices were calculated using observed growth divided by expected growth to avoid spurious correlations, in which the expected values were obtained by the autoregressive moving average (ARIMA) model. We used high atmospheric vapour pressure deficit (VPD) to select years of atmospheric drought and low annual values of the Standardized Precipitation-Evapotranspiration Index (SPEI) to select years with soil drought. We acquired the sensitivities (i.e., the slopes of the relationships) by fitting the resilience indices as a function of environmental drivers, and assessed how these sensitivities changed over time for different types of drought events using linear mixed models. We also checked whether plasticity in growth responses was sufficient to prevent long-term trends of growth reductions during or after severe droughts. We acknowledge that by focusing on the response of surviving trees from the ITRDB we are potentially biasing our results towards higher resilience, as stand level responses (e.g., mortality) may result in lowered competition after the disturbance event.
Results Sensitivities of resilience to VPD and SPEI changed throughout the 20th century, with the directions of these changes often reversing in the second half of the century. For the 1961–2010 period, changing sensitivities had positive effects on resilience, especially following years of high-VPD and compound events, avoiding growth losses that would have occurred if sensitivities had remained constant. Despite sensitivity changes, resilience was still lower at the end of the 20th century compared to the beginning of the century.
Conclusions Future adjustments to low-SPEI and high-VPD events are likely to continue to compensate for the trends in climate only partially, leading to further generalized reductions in tree growth of conifers. An improved understanding of these plastic adjustments and their limits, as well as potential compensatory processes at the stand level, is needed to project forest responses to climate change.
Understanding how forests respond to environmental drivers is crucial for projecting impacts of climatic changes worldwide (IPCC, 2013). Drought stress is a major driver of plant distribution (Engelbrecht et al., 2007), demography (Anderegg et al., 2016) and physiology (McDowell, 2011). Drought severity is predicted to increase in many regions as a result of climate change (Ault, 2020; Cayan et al., 2010; Vicente-Serrano et al., 2020; Vicente-Serrano et al., 2020a). Even in the absence of changes in rainfall regime, increased temperatures will lead to increased atmospheric water demand and increased vapour pressure deficit (VPD). Other drivers, such as nitrogen deposition and increased atmospheric CO2 may lead however to significant water savings for plant leaves and canopies (Levesque et al., 2017; Craine et al., 2018; Guerrieri et al., 2020). Because of the interacting nature of many environmental drivers and plant physiological processes, it is difficult to predict whether long-term chronic effects of repeated severe droughts become amplified during subsequent events (Reichstein et al., 2013). By contrast, it is possible that past drought events coupled to elevated CO2 concentrations and nitrogen deposition, elicit positive adjustments to future severe droughts (Drake et al., 2018; Franklin et al., 2020).
Trees can be plastic in their responses to severe droughts, in the sense that the sensitivity of the growth response to an environmental driver (i.e., the slope of the relationship between growth and that factor) can vary over time (Peltier and Ogle, 2020), i.e., lack of stationarity (Wilmking et al., 2020). This plasticity may result in adjustments to the gradually changing environmental conditions, such that impacts of subsequent severe droughts on growth may either increase or decrease. Overall, the relative balance of these positive and negative effects caused by antecedent events and their legacies is central in understanding the long-term impacts of extreme climatic events, and especially drought, on tree responses (Schwalm et al., 2017; Yin and Bauerle, 2017; Serra-Maluquer et al., 2021).
Adjustments of trees to drought are thought to depend on the existence of a stress memory (Fleta-Soriano and Munné-Bosch, 2016; Julio Camarero et al., 2018; Mu et al., 2022). Adjustment mechanisms that are adaptive during periods of severe stress are costly to maintain during subsequent periods favourable to growth (DeWitt et al., 1998; Valladares et al., 2007), but they may reduce the negative impacts of the stressful events in the face of their increased frequency and/or intensity. The alternative hypothesis is that accumulated physiological damage caused by recurrent and severe droughts will lead to growth decline and, ultimately, to catastrophic loss of function and tree death, as stress severity increases.
Whether soil drought severity (understood in terms of reductions in the balance between rainfall and evaporation) has changed systematically across most biomes is debated (Trenberth et al., 2014; Ault, 2020; Padrón et al., 2020). However VPD, which mostly depends on temperature, has increased globally since about the 1970s–1980s (Yuan et al., 2019). Increased VPD amplified not only the frequency of years of high-VPD, but also of events when high-VPD and soil drought occurred jointly (De Boeck et al., 2010; Zscheischler and Seneviratne, 2017; Alizadeh et al., 2020). The frequency of combined hot drought events is predicted to increase further in the future (IPCC, 2013; Allen et al., 2015). Because xylem growth is mechanistically linked to plant water potential and turgor (De Schepper and Steppe, 2010; Cabon et al., 2020a), this may lead to reduced resistance (i.e., growth occurring during the severe drought) and resilience (post-drought growth relative to growth during non-drought years). Here we take advantage of long-term records of growth in tree rings during the 20th century to examine whether limitations to growth caused by two classes of potentially very different droughts, i.e., anomalies in site water balance between precipitation and potential evapotranspiration (i.e., soil drought) and anomalies in VPD (i.e., atmospheric drought), resulted in plastic, i.e., non-stationary, growth responses over time. We then examine the consequences of these plastic responses. We acknowledge, however, that our tree-level analysis does not explicitly account for compensating processes at the stand level, such as stand density reductions resulting from drought-induced mortality (Lloret et al., 2012; Giuggiola et al., 2016).
Because of land-atmosphere feedbacks, strong spatial and temporal interactions are expected to occur between soil and atmospheric droughts (Seneviratne et al., 2006; Zscheischler and Seneviratne, 2017; Pagán et al., 2019; Zhou et al., 2019). This correlation is especially strong at multi-daily to seasonal time scales, as a result of weather patterns. Here, we exploit the low correlation existing between cumulative 12-month SPEI (Standardized Precipitation-Evapotranspiration Index), a widely used drought index accounting for changes in site water balance, and spring-to-summer VPD to explore individual and combined effects of these two types of severe droughts during the 20th century. Our approach to exploring the effects of severe droughts based on SPEI and VPD is explained in Fig. 1. Because both SPEI and VPD are standardized on a Gaussian scale (i.e., site-specific anomalies), we employ identical thresholds to select events of equivalent severity, following prior work, e.g., Anderegg et al. (2020), Li et al. (2020), and Senf et al. (2020). Combining 1-year SPEI and spring-to-summer VPD to determine growth responses to severe climatic events is important for several reasons: 1) temporal variability in SPEI and other drought indices is driven more by precipitation than by atmospheric evaporative demand for many biomes (Vicente-Serrano et al., 2020b), 2) atmospheric evaporative demand and soil drought conditions have very different effects on plant physiology (Novick et al., 2016; Kannenberg et al., 2019; Brodribb et al., 2020; Grossiord et al., 2020) and both can contribute to growth reductions (Williams et al., 2010; Anderegg et al., 2013) and 3) tree growth shows strong memory effects (i.e., antecedent conditions can affect drought responses and drought effects can last for several years post-drought) at different time scales (Peltier et al., 2018). Although, VPD and SPEI provide only a partial representation of atmospheric and soil drought conditions, their joint examination provides complementary perspectives on the responses of growth to severe drought events (Liu et al., 2020).
Figure
1.
Bivariate distribution of anomalies in 1-year cumulative SPEI and mean spring-to-summer VPD for 1,660 sites. Both SPEI and VPD are standardized (centred around zero and normalized to standard deviation of 1) for each site independently. As severe drought years, we select those site-years when either a) spring-to-summer VPD ≥1.5 and the sum (VPD - SPEI) < 3.0 (pale blue points), b) 1-year SPEI ≤ −1.5 and the sum (VPD - SPEI) < 3.0 (green points), or c) the sum (VPD - SPEI) ≥ 3.0 (red points on or above the red bisector line of slope +1). Cases a) and b) represent situations when the severe event is defined based on the occurrence of either severe spring-to-summer atmospheric or 12-months soil water balance limitations but not both (according to an OR scenario of a Survival Kendall multivariate distribution, i.e., either one of the severe events occurs (Zscheischler and Fischer, 2020)), and case c) when the two types of events co-occurred (AND scenario (Zscheischler and Fischer, 2020)), with a variable contribution of the two components. Values exceeding a threshold of 1.5 on a standardized scale equate to a probability of occurrence of ~7% for univariate distributions. On average, ~11% of all site-year events are classed as severe (i.e., less than the expected 14% if the two univariate distributions did not overlap). Of these events, 20% of all SPEI and 27% of all VPD are compound events. Grey points in otherwise coloured areas indicate events in time series with <5 events overall, which are excluded from further analysis, resulting in 1,660 series retained (cf., Tables S1–2 for further details on species and sites sampled). (For interpretation of the references to colour in this figure legend, the reader is referred to the Web version of this article.)
Following the reasoning above, here we test the following hypotheses: 1) The sensitivity of conifer tree growth to VPD and soil moisture balance during droughts changed during the 20th century for the three types of droughts (high-VPD, low-SPEI or compound droughts). 2) As a consequence of these shifts in sensitivity throughout the century, drought-year and post-drought growth differed from the growth obtained if sensitivities had not changed over time. Because high-VPD events became globally more frequent towards the end of the 20th century, we hypothesise that the increased severity of stressful events elicited a memory response and that the consequent endogenous adjustments reduced the negative effects on growth for VPD and compound events. 3) We finally assess whether this plasticity in growth responses was sufficient to prevent long-term trends of growth reductions during or after the severe droughts of the 20th century (complete adjustment) or whether there is evidence of incomplete adjustment, depending on the nature of the drought (high-VPD, low soil moisture or compound events).
We focus on Gymnosperm, and specifically coniferous, trees for two reasons. First, there is evidence that Gymnosperms, and more extensively the Pinaceae, have been severely affected by extreme events in recent decades (Williams et al., 2010; Gazol et al., 2018; Cailleret et al., 2019; Anderegg et al., 2020; DeSoto et al., 2020). For example, Gazol et al. (2018) showed that evergreen gymnosperms of semi-arid Mediterranean forests showed the lower resistance to drought episodes compared to deciduous angiosperms, while Cailleret et al. (2019) showed a gradual increase in inter-annual growth variability and a decrease in growth synchrony in conifers in the final part of the 20th century. Finally, DeSoto et al. (2020) showed that conifers show stronger and longer legacies of drought on tree radial growth relative to angiosperms. Second, significant historical trends were reported in both growth resistance and resilience of Gymnosperms for the second half of the 20th century (Li et al., 2020; Zheng et al., 2021). Although Angiosperms are also known to have been affected by severe droughts at several locations around the world, the availability of a large tree core collection for Gymnosperms provides the opportunity for a robust test of these hypotheses.
2.
Materials and methods
2.1
Tree-ring width data
We employed the site-averaged quality controlled tree ring width dataset produced by Zhao et al. (2019) and downloaded from https://doi.org/10.5061/dryad.kh0qh06. This dataset is a subset of the International Tree-Ring Data Bank (ITRDB), a global repository for tree-ring data, mainly from extra-tropical biomes (Grissino-Mayer and Fritts, 1997) and focusing on living trees. To obtain site-specific chronologies, individual ring width data were detrended and standardized using the dplR library (Bunn, 2008). Starting from the raw files, we used a cubic smoothing spline with a 50% frequency cut-off at 30 years to eliminate long-term trends in all time-series (2,195 series) (Klesse, 2021). Detrending and standardization involved dividing ring-width values by the corresponding fitted values to generate a series of normalized growth anomalies with mean close to 1 (Cook, 1985; Cook and Kairiukstis, 2013). Finally, series were averaged onto site chronologies using Tukey's Biweight Robust Means. We cut all datasets to the 20th century. A first level of filtering was carried out to retain only those sites in which a) gymnosperm species were present (where sites represent sampling locations within species, 1,830 sites). We then retained only those sites in which b) at least five severe SPEI or VPD events occurred during the 20th century, to reduce the uncertainty in the detection of temporal trends (1,707 sites). Additionally, c) we only retained sites where, for all decades in the 20th century, series age >90 years (1,686 sites) and finally, d) in which (see later) VPD estimates were extracted from data available from the local cell as opposed to interpolation from surrounding cells (1,660 sites, genera and spatial distributions are shown in Table S1 and Fig. S1). Severe events occurring at short time distances from one another were considered separate events. Separately, as a cross-check, we also considered the subset of 429 series that began before 1900 and ended after 2000. Tree-ring data for non-surviving trees were not used, as they do not allow assessing resilience. We acknowledge that this may bias our results towards higher resilience, as stand level responses (e.g., mortality) may result in lowered competition after the disturbance event.
2.2
Site-level climate, drought indices and additional variables
To characterise climatic differences across the 1,660 sites, elevation-corrected monthly temperature and precipitation data were downloaded from the CRU database v.4.05 on a 0.5° latitude by 0.5° longitude grid (https://crudata.uea.ac.uk/cru/data/hrg/). To estimate soil water balance at each site, we used the Standardized Precipitation Evapotranspiration Index (SPEI) (Vicente-Serrano et al., 2010). SPEI is based on the difference D between precipitation PRE and potential evaporation PET. D values are cumulated over pre-defined periods of time up to a specified month. The standardization of site-level SPEI allows comparing drought anomalies across sites. SPEI thresholds of drought severity have a probabilistic meaning, e.g., SPEI = −1.0, −1.5 and −2.0 imply a 16%, 7% and 2% probability or a one in six-, 14- and 50-year return intervals, respectively. SPEI has been validated to detect moisture anomalies for agricultural (Zipper et al., 2016; Páscoa et al., 2017) and environmental applications (Pasho et al., 2011; Greenwood et al., 2017; Zhang et al., 2017). We downloaded 6-month and 12-month-long SPEI data ending in the months from May to August for the Northern hemisphere (November to February for the Southern hemisphere) from the CSIC SPEI global database available at http://spei.csic.es/database.html. We compared different SPEI thresholds (i.e., < −1.0, < −1.5 and < −2.0, respectively) and used different end-months for both datasets. Similar results were obtained with the various combinations (data not shown). August was preferred since it cumulates D through the entire growing season and the previous 12 months. From the same website, we also downloaded time series of 3-months SPEI values ending in the months of February, May, August and November for each site and year. The season with the lowest SPEI value (variable Season; spring: March–May, summer: June–August, autumn: September–November, winter: December–February; reversed classification for the southern hemisphere) was determined for each site.
We also considered severe atmospheric droughts based on high values of vapour pressure deficit VPD spanning the period 1900-present. We downloaded monthly gridded temperature and vapour pressure data from the CRU time series (TS4.04 Dataset, Harris et al., 2020). The VPD time series has much lower spatial coverage for the second than for the first half of the 20th century, because of lower density of vapour pressure measurements. In the CRU dataset, VPD is estimated either from primary vapour pressure measurements or from empirical regressions against daily temperature ranges, a variable more widely measured than vapour pressure. In version TS4 of CRU, these synthetic estimates of VPD are calculated from primary station observations as opposed to gridded data and they therefore reflect the intrinsic spatial dependency of daily temperature range as opposed to the mean regional climatology (with a mean correlation decay distance of about 750 km). We used the available quality flag to exclude all site-year combinations where VPD interpolation was carried out from the regional climatology as opposed to the local gridded cell. We calculated absolute vapour pressure for the months of May to August, then obtained saturated vapour pressure using formulas given in (Yuan et al., 2019), corrected for atmospheric pressure and site elevation, then calculated VPD as saturated minus actual vapour pressure. We calculated temporal anomalies of VPD for each site and forced a normalization of the data onto a Gaussian curve with mean of zero and standard deviation of one, similar to SPEI. We chose a threshold of +1.5 to detect years of severe high-VPD values.
Because the same probability threshold was chosen for both types of droughts, we could examine differences in tree responses to the two classes of events. To detect years when strongly negative values of SPEI and strongly positive values of VPD co-occurred, we summed years when (VPD ‒ SPEI) ≥ 3.0. Under those conditions, either a) the two types of severe events co-occurred (VPD ≥1.5 and SPEI ≤ −1.5), or b) one of the two drivers did not reach the threshold for severe values but the second driver more than exceeded its threshold thereby compensating the other. This approach is an approximation to modelling compound severe events using a survival Kendall distribution (Zscheischler and Seneviratne, 2017), a frequently applied bivariate copula for the study of, e.g., the return periods of extreme temperature and precipitation and their effects on crop yield variability (Zscheischler et al., 2017). We similarly determined the sum of the 1-year SPEI and of the spring-to-summer VPD values that occurred during the four years prior to the severe event (SPEIprev and VPDprev) as well as during the four years following the event (SPEIpost and VPDpost). Overall, each chronology had between 5 and 23 severe events (median of 10 events). On average, 10.8% of all site_year events were classed as severe. Of these events, 20% of all SPEI events and 26.6% of all VPD events were compound events. Overall, we examined >16,000 events. Before use in the regressions, spline-frequency detrending was applied also to SPEI and VPD data, as above for tree ring data.
2.3
Growth time series modelling
The auto-correlated nature of tree growth must be taken into account in the analysis of growth rates during (drought-year growth) or following severe events (post-drought growth). A frequently applied procedure is to divide growth during or after a severe event by growth during a reference condition (e.g., growth prior to the severe event, Lloret et al., 2011), thereby obtaining estimates of resistance and of resilience ratios. This is problematic because in many widely employed approaches, resistance and resilience strongly and spuriously co-vary with one another because of growth year-to-year persistence, an issue that was only recently identified (Li et al., 2020; Zheng et al., 2021; Serra-Maluquer et al., 2022). In Supplementary Materials, we show that spurious covariation between resistance and resilience occurs in almost all of the pairs of resilience (Rs)/resistance (Rt) indices found in the literature. Consistent with this, we employ the approach by MacGillivray et al. (1995) for all our subsequent analyses, because this approach ensures that resilience and resistance are mathematically independent from one another, albeit they may still show temporal covariation as a result of autocorrelation in the time series, reflecting a real biological property as opposed to a mathematical artefact. Using this definition, resistance Rt is obtained dividing observed drought-year growth by the expected growth that would have taken place had the drought not occurred in that year. Conversely, resilience Rs is obtained dividing observed post-drought growth by the growth expected in the hypothesis that the drought had not occurred (Martínez-Vilalta et al., 2012). Expected drought-year growth and post-drought growth are derived by employing the autocorrelation properties of the time series and forecasting the time series for those years.
Growth expected to occur in the absence of the severe event and the subsequent four years was estimated for each time series independently using ARIMA (autoregressive moving average) modelling. The period of four years over which to assess growth is a compromise between the recovery usually taking up to 4 years after a severe drought and the need to minimise the overlap with subsequent drought periods (Anderegg et al., 2015; Wu et al., 2018). For each time series, we determined the four parameters of the best non-seasonal ARIMA model for the entire time series, i.e., intercept c, autoregressive term p, moving average term q and degree of first differencing d, using the ARIMA function of the fable package in R (Hyndman and Khandakar, 2008) applied to log-transformed tree ring indices (to avoid occasional negative predictions). The ARIMA function uses a variation of the Hyndman-Khandakar algorithm, which combines unit root tests, minimisation of Akaike Information Criterion AIC and maximum likelihood estimation to automate a stepwise search procedure for the best fitting ARIMA model (Hyndman and Athanasopoulos, 2018). We did not include environmental variables as predictors because environmental drivers of growth may have changed over time during the 20th century (Brienen et al., 2012; Duchesne et al., 2019), a finding that our own results support (cf., Table S9 for a summary of all the ARIMA models). In addition, the analysis in the Supplementary Materials demonstrates that modelling based only on ARIMA properties replicates the main features of the time series. After excluding the values corresponding to severe SPEI or VPD years (plus subsequent four years), the fitted ARIMA parameters were used to derive expected growth values for each event using a Kalman smoother, obtained using the average of the forward and backward forecasts for the missing section corresponding to the severe event. The interpolation routine used the interpolate function in fable. The median root mean square error of the forecasts across all models was 0.19 (min = 0.04, max = 0.76). A summary of the workflow employed for the analysis is given in Fig. 2. In the case of partially overlapping severe events, the interpolation was carried out for the entire sequence of excluded years. We also considered two more ARIMA models. One in which the autocorrelation properties were determined after excluding all drought episodes in each non-gapped filled time series and one in which ARIMA parameters were derived sequentially after excluding each drought at a time. All ARIMA methods gave very similar results. Finally, all log-transformed values were exponentiated.
Figure
2.
Summary of the workflow employed for the construction of the resilience/resistance indices. Further details are given in the text.
To examine the first hypothesis, i.e., that 20th century environmental changes modified the sensitivity of growth to its drivers during severe events, we applied hierarchical models separately for each of the decades from 1900 to 2010 and for each event type. We incorporated descriptors of concurrent soil drought and VPD severity (, and Season of strongest drought) and the pre-drought and post-drought 4-year cumulative SPEI and average VPD (, and , ).
(1)
(2)
where and are the resistance indices. Resistance is defined as the ratio of observed growth during the drought year to the growth in the same year predicted from the autocorrelation property of the site-specific time series. Equivalently, resilience is defined as the ratio of observed growth in the four years following the drought to the predicted growth in the same four years. is the random intercept effects of the i site nested within species, while are also random coefficients varying by decade j, crossed with species/site. Three separate models were fitted, one for each type of severe event (low-SPEI, high-VPD, compound). Random effects were tested with the ranova command library lmerTest, and were found to be always very highly significant (i.e., at least P < 0.0001). Trends of changes in the random coefficients of Eqs. 1 and 2 across decades were examined with weighted least square linear models (with or without a quadratic term for decade to examine curvilinear responses) as well as with weighted generalized additive models (GAM). The weights were set to the inverse of the variance of the coefficients for each decade, because variance accounts both for unequal sample size as well as unequal precision over time. The GAM models were employed primarily to confirm that the quadratic models were able to capture the trends in the data. Finally, we considered the potential confounding effect caused by varying contributions from different sites during the 20th century, because different chronologies started and ended in different years. To account for this effect, we repeated these analyses by subsetting the database only to those 429 series that began before 1900 and ended after 2000.
To examine the second hypothesis, i.e., that the effects of sensitivity shift on resistance and resilience differ depending on the type of the event considered, we employed Eqs. 1 and 2 to predict resistance and resilience separately for each decade in the century. As above, models were run separately for each event type. We used two complementary approaches to isolate the effects of changes in sensitivity to drivers on resilience indices from the changes in drivers themselves. In the first approach, because drought severity varied from decade to decade, we calculated the value of the differences of resilience indices estimated using decade-specific sensitivities (as per in the first hypothesis) minus resilience indices estimated using reference-decade sensitivities, while letting VPDprev/d/post and SPEIprev/d/post vary from year to year. As for the reference decades, we take the sensitivities of 1901–1910 for the period 1911–1960, and those of 1961–1970 for the period 1971–2010. For each decadal period, we test whether resilience indices predicted from variable sensitivities are larger or smaller than predicted from constant sensitivities. We split the century at 1960 and chose the first decade of each period as the reference decade based on the results of the previous analyses (Fig. 3), showing that many sensitivities to the environmental factors changed following a parabolic function with an inflection point at or after the middle of the century. This also matches trends of increased VPD which began to become apparent from the subsequent decade (1970s).
Figure
3.
Changes in the sensitivities of growth to VPD and SPEI by decade of the 20th century for resistance (top half, a–d) and resilience (bottom half of the graph, e–j). Sensitivities are the slope of standardized resilience indices to the two environmental drivers. P values refer to the significance of the regression of each sensitivity coefficient against decade for the three severe event types, using a linear or a quadratic model (cf., Fig. S4 for GAM models results), with the linear model preferred if the AIC of the quadratic model remains within two units of the linear model. Bars are 95% confidence intervals for each point. For each response variable, suffixes prev, d and pp refer to variables measured in the 4 years prior to the event, during or in the 4 years following the event year.
In the second approach, mean decadal values of the environmental drivers (SPEIprev/d/post and VPDprev/d/post) were calculated separately by site within species, year of the decade and type of severe event, and eventually averaged across sites and species to correspond with the decadal estimates of the sensitivity coefficients. We then selected one reference decade and recycled its values of the environmental drivers for the entire century. We chose to recycle the decade 1991–2000 because it is representative of a period where increases in VPD and compound events are already apparent (see Fig. S6, calculations were also made using the mean climatic conditions of the 1901–1910 and the 1951–1960 decades). We then used all the decadal-values of the sensitivity coefficients from 1901 to 2010, together with the recycled 1991–2000 climatic factors to calculate century-long resilience indices at constant climate.
Therefore, in the first analysis, climatic data vary through the century and one compares growth under constant versus variable sensitivities. Conversely, in the second analysis climate is constant and only the decadal variations in sensitivities affect resilience indices. Overall, the first approach asks the question of how varying sensitivities affect resilience indices relative to constant sensitivities under the varying climatic conditions of the 20th century. The second approach asks the question of how resilience indices varied at constant climate in response to varying sensitivity.
For the first approach, we compared the paired differences between the two growth rates across all sites with paired Kruskal-Wallis tests using library coin and the command independence_test, using a conditional distribution for the null against an asymptotic approximation of the exact distribution of the statistics. Analysis of the same data after aggregation of all events to species level led to the same conclusions. We confirmed this analysis by running a linear mixed model of predicted growth based on variable sensitivities against predicted growth based on fixed sensitivities for the reference decade, decade, event type and the interaction between these last two variables. For the second approach, we examined whether growth at constant climate changed through the century using linear, quadratic and GAM regression models as described above for the first hypothesis.
To examine the third hypothesis, i.e., whether plasticity in growth responses was sufficient to prevent long-term trends of growth reductions during or after severe droughts, we employed a mixed model framework similar to the one of Eqs. 1 and 2. In this analysis we pooled all the data for the century and described the linear responses of resistance and resilience to time (Year), with and without the effects of environmental drivers. The following two models were therefore employed:
(3)
where stands for either or (both centred to mean of 0 and normalized to a standard deviation of 1), Year is the centred and normalized year in the century and Severe is a three-level variable (VPD, SPEI or compound events).
(4)
where and stand for , in the case of regressions of , whereas they stand for in the case of .
In Eqs. 3 and 4, are now global coefficients for the century, not decade-specific. Eq. 3 provide an estimate of overall linear time trends, Eq. 4 of time trends net of the effects of year-specific environmental conditions. In these models, is the random intercept of sites nested within species. Trends of changes in the resilience indices of Eqs. 3 and 4 were also examined with hierarchical GAM to confirm the linearity assumption inherent in Eqs. 3 and 4. All analyses were conducted in R (v. 3.5.1) (R Core Team, 2018). Mixed models corresponding to Eqs. 1 and 2 were fitted with lmer, those corresponding to Eqs. 3 and 4 with nlme. Library arm was used to obtain estimates of standard deviation of the random effects. Linearity in responses, model convergence, singularity, multicollinearity, normality of fixed and random effects, violations of homogeneity of variance, homoscedasticity and overall goodness-of-fit were examined using library performance (Lüdecke et al., 2020). We employed library BestNormalize (Peterson and Cavanaugh, 2019) and choose the Ordered Quantile Normalization (OQN) to normalize all variables (including the response variables of growth) to a mean of 0 and standard deviation of 1 (cf., further discussion on why this was required in Supplementary Materials). The OQN is a one-to-one transformation technique that is guaranteed to convert any arbitrary distribution to a normal distribution. It can be shown that if a dataset fits a pre-defined theoretical distribution of any kind, the OQN will produce a transformation that will approximate that distribution (Peterson and Cavanaugh, 2019). Significance of each variable was tested using the anova command using type III sums of squares. Marginal (fixed factors) and conditional (fixed and random factors) proportions of explained variance were obtained using the r.squaredGLMM function in the MuMIn package (Barton, 2009). The packages effects (Fox, 2003) and emmeans (Lenth, 2016) were employed to plot interactions and test differences across levels of categorical factors.
3.
Results
To examine our three hypotheses on the significance of plasticity in growth responses of Gymnosperm trees to drought, we compare growth rates measured during or in the four years following droughts (defined based on high-VPD, low-SPEI or compound events) against expected growth from the ARIMA model. In other words, the prediction is obtained from the autocorrelation properties of the time series (cf., Methods). We purposely avoid traditional resistance/resilience indices based on measured growth rates prior to droughts because our earlier results showed that these metrics are often not independent, preventing the interpretation of the two indices in isolation (Zheng et al., 2021; Serra-Maluquer et al., 2022). We comprehensively examine the literature on resilience and find that, almost universally, its definition implies non-independence from resistance (Supplementary Materials, Sections 1 to 3, Figs. S2 and S3; Table S3‒S5). Because resistance and resilience define conceptually different dimensions of vegetation responses to stresses (Nimmo et al., 2015), avoiding non-independent definitions is essential. The use of ARIMA models (Martínez-Vilalta et al., 2012) achieves this goal perfectly. Using autocorrelation features to derive estimates of ‘expected’ growth is consistent with the definition of resilience (MacGillivray et al., 1995) and with our own earlier work on growth responses to drought events (Martínez-Vilalta et al., 2012; Ovenden et al., 2021).
3.1
Plasticity of the sensitivities to environmental drivers
We first examine hypothesis 1, that during the 20th century, growth sensitivities to environmental factors are not stationary for the three types of high-VPD, low-SPEI and compound events. To test this hypothesis, we calculate the response functions of resistance and resilience as a function of VPD and SPEI as predictor variables for each decade of the 20th century in linear mixed models (Eqs. 1 and 2). For resistance (Fig. 3a‒d), three out of the four sensitivities to VPD and SPEI vary significantly (the one for VPDd only marginally) throughout the 20th century, suggesting plasticity in growth sensitivity to some environmental drivers. Specifically, the significant quadratic trend for SPEId (the annual SPEI during the drought year, Fig. 3b) suggests a positive effect on resistance during severe events for the majority of the 20th century with a minimum around 1960s, i.e., other things being equal, positive SPEId coefficients correlate with increased resistance. The signs of VPDd (the summertime VPD during the drought year) are mostly negative for high-VPD and compound events (Fig. 3d, averages of −0.11, −0.09 and 0.03 for compound, high-VPD and low-SPEI events, respectively), indicating that higher VPDd reduced resistance and drought-year growth, while the signs for the period preceding the severe events (VPDprev) are expected to vary in the opposite direction. Overall, the magnitudes of the changes in sensitivity are substantially larger for compound than high-VPD or low-SPEI events (mean ranges, i.e., max-min, of 0.56, 0.45, 0.36). To relax assumptions of linearity, we also employed weighted GAM (generalized additive models) regressions of sensitivities against decade by extreme event type instead of linear regression. Similar results are obtained (Fig. S4a‒d).
For resilience (i.e., observed divided by expected post-drought growth), four out of six of the sensitivities to VPD and SPEI significantly vary throughout the 20th century (Fig. 3e‒j), suggesting stronger plasticity in growth sensitivity to individual environmental drivers following severe events. In two instances, sensitivities vary nonlinearly over time with an inflection point around the middle of the 20th century (AIC of quadratic versus linear regression « −2). The magnitudes of these changes are substantially larger for compound events relative to high-VPD and low-SPEI events (mean ranges of 0.73, 0.37, 0.35, respectively). For all three kinds of droughts, negative correlations are found between SPEIprev and Rs at early and late 20th century, however, the effect all turn positive during the middle of the century (Fig. 3e). Decreasing trends are found for the effect of SPEId on Rs in low-SPEI and compound events, while its effect in high-VPD events is almost unchanged (Fig. 3f). The values of slope for Rs to SPEIpost in all drought types are always above 0, indicating that higher post-drought SPEI always leads to higher post-drought growth, yet the sensitivity in high-VPD and compound events decline with the time and that for low-SPEI events is stable (Fig. 3g). The majority of the slopes of Rs to VPDd are below 0, expressing that high VPDd usually result in low post-drought growth, the sensitivity of Rs to VPDd in three kinds of droughts all shift considerably (Fig. 3i). Most significantly, for the four variables where significant trends are seen (SPEIprev, SPEId, SPEIpost and VPDd), the directions of the changes during the second half of the century are always towards a reduction in the sensitivity of resilience to changes in the drivers, especially so for high-VPD and compound extreme events. Overall, considering both resistance and resilience, the sensitivities to SPEI metrics are substantially more plastic than those of VPD metrics (Fig. 3a‒j).
In all these analyses, the random effects of species (and sites within species) are almost always highly significant (often P < 0.0001) for both growth metrics, suggesting that the magnitude of the temporal trends vary systematically from species to species and site to site. When linearity assumptions are relaxed using GAM models, similar changes in the sensitivity to environmental drivers are also seen (Fig. S4 bottom). When the analysis is repeated using only the 429 series that started prior to 1990 and ended after 2000, similar results were also found (Fig. S5), albeit with lower significance level. This confirms that responses to VPD and SPEI during and following severe events changed significantly and often curvilinearly throughout the century.
3.2
Effects of shifts in sensitivities to environmental drivers
Our second hypothesis predicts that, as a consequence of shifts in sensitivities, resilience indices vary, with the variation dependent on the nature of the severe event, i.e., whether high-VPD, low-SPEI or compound event. For this analysis, we couple two approaches that allow isolating the plasticity effect (i.e., eliminating the climatic effects) in two complementary ways (as described in 2.4).
Using the first approach, for the period 1901–1960, both resistance (Fig. 4a top line) and resilience (Fig. 4b top line), showed distributions that are significantly skewed towards negative values (except Rt in low-SPEI events). These negative distributions are more accentuated during high-VPD and compound years than during low-SPEI years, especially for resilience (P < 0.0001 using paired t-tests within event types, Fig. 4b). The predominant negative departures during drought events suggest that with changes in growth sensitivity, both resistance and resilience with varying sensitivities was lower than it would have been with the constant 1901–1910 sensitivities. Keeping in mind the results of Rt in Fig. 3, considering the relatively larger changes of sensitivities to environmental drivers in high-VPD/compound events taken place during 1901–1960, the most likely interpretation is that the additive effects of the changes in sensitivities 1–4 years prior to and during high-VPD/compound events increased the negative effects of drought on growth, which result in the reduction of resistance. For resilience, in addition to the previous reasons, a significant decline in the sensitivity of SPEIpost may also account for the decrease (Fig. 3g). Finally, for low-SPEI events, changes are small for resistance, but a larger negative shift in the distribution is seen for resilience.
Figure
4.
Analysis of the effects of plasticity on the sensitivity parameters (pars) of growth rates. The time-varying sensitivity parameters are calculated for each decade as in Fig. 3. The x axis plots the value of the differences of resilience indices predicted based on decade-specific sensitivity parameters ( calculated from Eqs. 1 and 2 as we did in subtitle 3.1) minus the same indices predicted based on a reference-decade sensitivity parameters ( fixed at the reference decade), for each severe event. The same values of environmental variables are employed in both cases to scale the resilience indices. Results are given for resistance Rt (panel A) and resilience Rs (panel B). Within each panel, the first line refers to the 1901–1960 period (reference decade 1901–1910) and the second line to the 1961–2010 period (reference decade 1961–1970). From left to right, results are given for high-VPD, low-SPEI and compound events, respectively. Values to the left of the vertical dashed line at 0 indicate that decade-specific sensitivities led to smaller resilience indices compared to reference-decade sensitivities. The Delta and P values in each figure give the mean difference and probability of the Kruskal-Wallis test of the differences between the two growth estimates by pooling all events of each period. Results are almost identical when site-level data are averaged by species.
Conversely, for the 1961–2010 period, resistance (Fig. 4, second line of panel a) shows only very small shifts in the distribution for VPD events and moderate negative changes for SPEI and compound events. This suggests that, despite changes in sensitivities after 1960, plasticity did not improve growth responses, and drought-year growth remained even lower than at the reference decade for all types of drought events. Resilience shows instead positive shifts in the distributions for VPD and compound, but not SPEI, years (Fig. 4b, second line). These results imply that plasticity in growth sensitivities increased growth especially following high-VPD and compound events towards the end of the century. Because we pooled data within each period, we also ran mixed model regressions against Decade and Event type to confirm these conclusions (Table S6).
We then use our second approach, to further isolate the effects of temporal changes in the sensitivity coefficients from climate variability. We predict resilience indices at constant climatic conditions (taken from the 1991–2000 decade) but with varying sensitivities. To facilitate interpretation, we draw horizontal lines in our figures corresponding to the unnormalized values of Rt = 1 (corresponding to observed growth equals expected growth during the drought) or Rs = 1 (corresponding to observed growth equals expected growth following the drought), but it needs to be remembered that resilience indices for evaluating the effects of plasticity have been normalized. Temporal changes in the sensitivity coefficients at constant climatic conditions do not cause systematic trends in predicted resistance (P > 0.05 for the effect of decade and the interaction between decade and event type, Fig. 5a). The lack of a temporal trend in predicted resistance at varying sensitivities and constant climate is consistent with the limited plasticity in the sensitivity coefficients for resistance through the century (Fig. 4a).
Figure
5.
Changes in the resistance (a, Rt) and resilience (b, Rs) by decade of the 20th century. In this analysis, climate was kept constant at the severity values for all sites using the data from the decade 1991–2000, whereas the sensitivity coefficients were allowed to vary by decade (cf., Fig. 3). P values refer to the significance of F-tests for decade from the regression ANOVAs, and separate lines are given for the three types of severe event years. The combined regressions against decade × Severe event type had R2 = 0.13 (AIC of parabolic relative to linear model = 1.6) and R2 = 0.50 (AIC of parabolic relative to linear model = −7.7), for resistance (a) and resilience (b), respectively. Bars are 95% confidence intervals for each point. To facilitate legibility, data points are dodged 3 units to the right side from the beginning year of the decade. Black points are averages across all event types. Rt and Rs are standardized at mean = 0 and standard deviation = 1. The thin black lines give the values at which unnormalized Rt = 1 and Rs = 1. Similar analyses were carried out using climatic data from the 1901–1910 and the 1951–1960 decades (Fig. S6).
In contrast, for resilience, plastic responses in the sensitivity coefficients at constant climatic conditions are sufficient to cause substantial increases for the final third of the century (Fig. 5b). Interestingly, using a quadratic regression model, the temporal recovery is identical in magnitude for all three event types, without a significant interaction term (P > 0.05) and despite a significant difference in absolute values across event types (P < 0.05). Fig. 5 demonstrates that what might seem as relatively minor trends in growth sensitivity coefficients (Fig. 3) result in substantial differences when the effects of individual coefficients are added up. As expected from Fig. S5, the substantial increases in resilience at constant climate is also confirmed when data from only the 429 century-long series are considered (Fig. S6).
Considering together the results of Figs. 4 and 5 suggests a substantial difference between low-SPEI events on the one hand, and high-VPD and compound events, on the other, in how resilience varied in responses to both climate and plasticity in sensitivities. For low-SPEI events, the increase in resilience at constant climate post-1960 (Fig. 5b) entirely disappears when decadal-related climatic differences are considered (Fig. 4b, the middle of second line). In other words, the plasticity of many of the sensitivity coefficients (Fig. 3, bottom panel) translates into positive adjustments in resilience only under constant climatic conditions for low-SPEI events. By contrast, for compound and even more high-VPD events, the plasticity in growth remains whether resilience is compared at the constant climate of the 1991–2000 decade (i.e., the second approach, Fig. 5b) or by employing actual post-1960 climate. Furthermore, we should notice that the adjustments of sensitivities can occur not only at individual, but importantly also at stand scale. In this case, the historical trends in resilience during the 20th century would be biased towards zero, when considering the fact that dead trees were not involved, i.e., the true effects of historical shifts in sensitivities would be larger than we report.
3.3
Long-term trends in resilience indices
The evidence above addresses hypotheses 2 and 3, i.e., that physiological adjustments reduced, but did not eliminate, the negative effects of severe droughts on resilience towards the end of the 20th century. We further examine hypothesis 3 by looking at the long-term trends in resistance and resilience throughout the 20th century, while taking both trends in environmental conditions as well as potential plasticity in growth responses into account. In this analysis, we pool data from all decades and fit linear mixed models as a function of year, or year plus environmental conditions. Resistance declines throughout the century only for high-VPD years (P < 0.05 for the significance of the linear decline, and P < 0.0001 for the difference in slope between low-SPEI and high-VPD years) (Fig. 6a; Table S7), while trends for low-SPEI and compound events are flat. The magnitude of the response varies across event types (P < 0.0001), with lower values for compound and low-SPEI relative to high-VPD years (P < 0.0001, Tukey post-hoc comparisons significant level = 0.05, for both cases). Interestingly, while resistance predicted during high-VPD years is substantially higher than for the other event types during the earlier part of the 20th century, the difference disappears towards the end of the century. The inclusion of environmental covariates in the model does not alter these time trends (Fig. 6b).
Figure
6.
Results of linear mixed models of the changes of resistance (top line) or resilience (bottom line) as a function of year in the 20th century. In each line, the panels give the trends as a function of year only (model I, left-hand-side), or as a function of year plus SPEI and VPD drivers (model II, right), separately for the three types of severe events. Each panel gives the ANOVA results of the F-tests for year, event type and the interaction between the two, ns is short for not significant. Bands around each line are one standard error.
Resilience declines throughout the century for all drought types (P < 0.0001 for the significance of the linear decline, Fig. 6c and d; Table S8). Even though compound events tend to have a significantly steeper slope, the difference across event types is not significant, i.e., P = 0.35). The magnitude of the response varies across event types, with higher values for low-SPEI relative to high-VPD and compound years (P < 0.0001, Tukey post-hoc comparisons significant level = 0.05, for both cases). The difference between time trends is consistent with results in Figs. 4 and 5, in showing a flat or marginal declining trend for resistance and a consistently declining trend for resilience. Similar results are obtained using GAM models (Fig. S7). We note again, however, that these results focus on surviving trees, and therefore result from a combination of individual-and stand-level adjustments.
4.
Discussion
4.1
Effects of shifts in sensitivities
We show that the sensitivities of tree growth to several environmental variables during severe drought years has changed throughout the 20th century in a direction that reduced the sensitivities to external drivers during high-VPD and compound events. Besides, these changes have also altered the resilience indices independent of climatic changes. Finally, the adjustments in these responses in the final third of the century substantially reduced the negative trends in resilience of Gymnosperm trees. The finding of plastic responses to environmental factors was the same, independent of which specific ARIMA imputation approach was employed. It also remained the same, independent of whether we included all the time series or we subset only those series that spanned the entire century. Both of these checks suggest that it is a robust finding. The consequences on growth of these adjustments in sensitivities were visible during all types of severe events, if climate conditions were kept constant at 1991–2000 levels. However, under realistic climatic conditions of the 20th century, these adjustments in sensitivities did not alter resilience following years of low-SPEI events. Altogether, our results are consistent with the hypothesis that more frequent high-VPD years affected growth rates negatively after the 1970s, but also elicited compensatory responses by trees that reduced these negative effects. These compensatory responses are largely driven by changes in how drought legacies affect responses to drought.
Our comparative analysis of resilience indices highlights a conceptual problem whose significance had been overlooked. Despite their widespread use and repeated invitations to examine the different components of resilience (Orwin and Wardle, 2004; Lloret et al., 2011; Nimmo et al., 2015; Ingrisch and Bahn, 2018), spurious correlations between resilience and resistance indices were almost universal. Spurious correlations complicate the analysis of the different physiological or ecological processes leading to resilience. We show that it is possible to avoid spurious correlations in the analysis of the components of resilience via a reference null model. Conceptually, our approach is equivalent to (MacGillivray et al., 1995), originally intended for experimental comparisons against a control. Our null model maintains the temporal memory of the process via its autocorrelation structure (Peltier et al., 2016; Ovenden et al., 2021) and differs therefore from (Anderegg et al., 2015; Jiang et al., 2019), where null expectations of growth were obtained from static growth-climate relationships.
Up to the decade of the 1960s, plasticity in responses following severe VPD and SPEI years (Fig. 3) was associated with declines in resilience and partly resistance (Fig. 4, Table S6). Large declines in resilience were also seen when we replicated the 1991–2000 climate conditions across the entire 20th century (Fig. 5), confirming the casual link between plasticity in sensitivity and growth responses. Although the rate of decline in resilience predicted under the constant climatic conditions of the 1991–2000 decade did not vary significantly across all three event types, values were generally lower for high-VPD and compound events, suggesting substantial greater impacts of VPD compared to SPEI on post-drought growth across all sites and species. The causes of this substantial decline in growth caused by altered sensitivities need to be investigated further. One can speculate that this may have resulted from canopy overshoots, one possible mechanism being CO2-driven increases in canopy size, leading to wrong-way responses and amplification of competition for water during/after droughts (Jump et al., 2017; Zhang et al., 2021).
These effects on resilience dramatically reversed during the second half of the 20th century, especially but not only for high-VPD and compound years, when changes in sensitivity to environmental variables prevented further losses in post-drought growth. Changes during the second half of the century support the hypothesis that a higher frequency and/or severity of high-VPD events after the 1970s–1980s elicited a positive memory response, and therefore that physiological adjustments took place. This interpretation is consistent with the results of both analyses where the effects of decadal changes in sensitivity on growth were examined, i.e., either by varying the climate through the 20th century, while comparing sensitivities against a reference decade (Fig. 4), or by varying sensitivities at constant climate (Fig. 5). Our mixed models assumed linearity in the responses of growth to environmental drivers. To test whether responses may have varied through the range of possible conditions, we tested the constant climate scenario of Fig. 5 by replicating instead the climate data from the 1901–1910 and the 1951–1960 decades. We found almost identical patterns, both with regard to absolute differences across event types as well as to opposing trends during first and second parts of the century (Fig. S8). In additional preliminary analyses, we also employed GAM models to directly explore the linearity in the responses to environmental drivers and found very little evidence of nonlinearities. We are therefore confident that our analysis captures a genuine shift in the responses of trees to environmental and endogenous drivers.
Table 1 summarises all estimates of resilience losses avoided thanks to plasticity obtained in this analysis. These results suggest substantial resilience adjustments in the last decades of the 20th century, implying that plasticity in sensitivity made a marked difference to growth during high-VPD and compound years. Altogether, these findings suggest that acclimation to more frequent and severe high-VPD years may have occurred during the final part of the 20th century.
Table
1.
Summary of the estimates of the role of plasticity in avoiding resilience losses during the second half of the 20th century. Estimates are obtained based on different assumptions using the results given in the corresponding figures and tables. The first line in the table provides an estimate of plasticity having accounted for climatic conditions in different ways. The second line gives the estimate of avoided losses in resilience by relating the plasticity changes of the first line to the observed net temporal losses of Fig. 5c. Data from Fig. 3 are obtained from the model in Table S6 as the linear slope of Decade for compound events for the post-1960 period. Estimates of plasticity effects from Figs. S6 and 4 are obtained as the linear slope of Decade for compound events for the post-1960 period for the 1901–1910, 1951–1960 and 1991–2000 constant-climate scenarios, respectively. Because resilience indices are standardized with mean of 0 and standard deviation of 1, changes due to plasticity are given as % of 1 standard deviation.
Although our data allow to analyse the variations over time in the sensitivity of resilience indices to VPD and SPEI during the 20th century, identifying the factors that might have driven this plasticity is more complex. Several processes may explain adjustments to severe drought years during the latter part of the 20th century, i.e., lower stomatal sensitivity to soil drought or VPD (Poyatos et al., 2007), higher sapwood-leaf area ratios (Rosas et al., 2019; Trugman et al., 2019), direct temperature responses in growth (Cabon et al., 2020b) and altered whole-tree carbon balance (Dietze et al., 2014). Considering the directions of the changes in the sensitivity coefficients during the second half of the century and the fact that the most important shifts in the sensitivity coefficients occurred for SPEI, rather than VPD, metrics (Fig. 3), one might conclude that trees have become less sensitive to changes in soil drought drivers under high VPD conditions. Responses to changes in VPD over time may be confounded by covariation between temperature and VPD. We believe that this is unlikely, because of the strong mechanistic link between growth and soil and atmospheric drought (De Schepper and Steppe, 2010; Cabon et al., 2020a). Even when temperature has been shown to control cambial sink activity, this appears to be mediated by cell turgor effects (Peters et al., 2021). It cannot be excluded that long-term declines in nitrogen availability (globally evident for most of the 20th century in some cases (Mason et al., 2022)) contributed to reduced nitrogen concentration in leaves and therefore helped with responses to extreme events. In any case, our central argument remains, that plasticity in growth sensitivity during severe VPD and compound-event years reduced but did not entirely prevent reductions in resilience during the second half of the 20th century.
The approach we took here is similar to the comparison of observed growth versus growth predicted under reference null scenarios (Anderegg et al., 2015; Jiang et al., 2019), although previous studies did not examine temporal plasticity. Several hypotheses have been put forward to explain variable growth-climate sensitivity (Peltier and Ogle, 2020). The hypothesis of changes in climate change drivers (Levesque et al., 2017; Peñuelas et al., 2017) is consistent with the significant directional shifts in sensitivities (Fig. 3). However, as mentioned above, plastic changes in the sensitivity to VPD and SPEI do not necessarily reflect a direct response to historical changes in these two abiotic drivers. Even so, the intensity of both low-SPEI and high-VPD events varied through the 20th century, but in different directions (towards less strong SPEI, but stronger VPD events, Fig. S9), while their frequency increased on average (by 4% and 18% for SPEI and VPD, respectively), between 1901‒1950 and 1951–2000. Attributing observed plastic changes to individual environmental or biotic drivers will require a separate analysis, but we note that some regional studies have attributed recent mortality episodes of gymnosperm-dominated forests to temperature and VPD (Stovall et al., 2019). A recent global synthesis identified the imprint of hotter-drought events on reported mortality episodes (Hammond et al., 2022). The hypothesis of directional changes in plant physiological processes (i.e., hydraulic damage, carbon source-sink dynamics, structural changes (Peltier and Ogle, 2020)) is also consistent with previous diachronic and synchronic analyses of the autocorrelation term in paired chronologies from surviving and dead gymnosperm trees (Cailleret et al., 2019; DeSoto et al., 2020).
In our analyses, the random effect of species was almost always highly significant, suggesting that the magnitude of these temporal trends varied from species to species. In a separate analysis using a slightly larger dataset (1931 site series), we showed that species having a stronger relationship between ring width index and SPEI drought episodes, and having low resistance and high recovery from low-SPEI years, tended to have higher wood density and more negative leaf water potentials, consistent with the interpretation provided above and suggesting that species hydraulic traits underlie some of these temporal responses (Serra-Maluquer et al., 2022). One should note that the vast majority of the tree growth records from the ITRDB come from natural stands, not plantations. We recognize that our conclusions would be stronger if site-specific information was available on stand conditions (e.g., type of management, species composition, density) of the stands from which the tree cores were taken. Unfortunately, this information is not available for the vast majority of the sites in ITRDB. This likely adds considerable noise (and potential biases, cf. below) to the results and prevents a more in-depth interpretation. We also recognize that additional insights into species-specific drought responses could be obtained by a more detailed examination of resilience patterns of genera known to differ for their average rooting depth (e.g., deep-rooted pines versus shallow-rooted spruce). Although this analysis was not possible for this study, we mention it as an obvious future expansion of the present project.
4.3
Long-term trends in resilience indices
Despite evidence of compensatory mechanisms, our data show that resilience did decline during the 20th century even when changes in VPDprev/d/post and SPEIprev/d/post were accounted for. This historical decline in resilience is consistent with an earlier analysis using a different resilience metric (Zheng et al., 2021), but contrasts with the conclusion using an impact-normalized index that quantifies recovery (Li et al., 2020), by taking the obtained level of drought stress as a reference, as opposed to resilience per se (Ingrisch and Bahn, 2018). Our results help to clarify the distinction between trends in recovery and resilience. We show that growth sensitivities changed plastically over time (Fig. 3) and that these plastic adjustments reduced the magnitudes of time-related declines in resilience post-1960 (Figs. 4 and 5). We therefore posit that these findings explain the increases in impact-normalized post-1950 recovery reported by (Li et al., 2020), i.e., increased recovery capacity via plasticity did not elicit complete adjustment and did not prevent long-term declines in actual resilience. This conclusion is robust whether calculated relative to measured growth prior to drought (Lloret indices (Lloret et al., 2011) in (Zheng et al., 2021)) or to expected growth that would have occurred in absence of droughts (this paper). We also show that this conclusion applies not only to low-SPEI but even more to high-VPD and compound events.
Publicly available tree ring data remain spatially limited (Zhao et al., 2019) and biased towards old or dominant trees of a limited number of species often growing under marginal conditions, for which strong climatic sensitivities can be expected (Klesse et al., 2018). The distribution of tree ages remained roughly constant through the 20th century, with a prevalence of relatively older trees (Fig. S10). Also, tree age was not found to be a significant variable in our models. To avoid potential confounding age effects, we excluded series with age lower than 90 years for each decade. However, when we did not exclude these data, similar trends were found. Similarly, the number of study sites and sample species (Table S2) only showed declines in frequencies in the decade after the year 2000 (Zhao et al., 2019). Because temporal adjustments in sensitivity can only be documented in trees that survive extreme events, it is possible that our analysis over-estimates the significance of plasticity and consequently under-estimates the decline occurring in trees that eventually lose resilience and succumb (Brienen et al., 2012; DeSoto et al., 2020). Improved information on stand-level responses to drought, which are not usually documented in the ITRDB, would facilitate a better understanding of the drivers of the adjustments observed at the tree-level. Overall, we show that the combination of negative effects caused by climate change forcing and subsequent adjustment of Gymnosperm trees during the 20th century can be conceptualised in terms of the net balance between the physiological damage caused by increased severity of extreme droughts, and trait plasticity and potentially acclimation preventing higher levels of damage, especially in response to high VPD. Understanding the nature and magnitude of these compensatory mechanisms in relation to current warming trends is crucial to predict whether trees will continue to head towards more challenging conditions during the 21st century.
5.
Conclusions
We studied the sensitivity of resilience indices of conifer trees to climatic factors (VPD and SPEI) during three types of droughts (high-VPD, low-SPEI, and compound events) in the 20th century. Our findings demonstrate that the sensitivities of resistance and resilience to VPD and SPEI changed remarkably throughout the 20th century, with the directions of these changes often reversing in the second half of the century. Changing sensitivities had positive effects on resilience, especially following years of high-VPD and compound events, avoiding growth losses that would have occurred if sensitivities had remained constant. Despite sensitivity changes, resilience was still lower at the end of the 20th century compared to the beginning of the century. Future adjustments to low-SPEI and high-VPD events are likely to continue to compensate for the trends in climate only partially, leading to further generalized reductions in tree growth of conifers during the 21st century. An improved understanding of these plastic adjustments and their limits, as well as potential compensatory processes at the stand level, is needed to project forest responses to climate change.
The authors declare that they have no known competing financial interests or personal relationships that could have appeared to influence the work reported in this paper.
Acknowledgements
We thank all dendrochronologists for providing data to the ITRDB. We thank China Scholarship Council and professor Changcheng Mu for providing the funding and opportunity.
Alizadeh, M.R., Adamowski, J., Nikoo, M.R., AghaKouchak, A., Dennison, P., Sadegh, M., 2020. A century of observations reveals increasing likelihood of continental-scale compound dry-hot extremes. Sci. Adv. 6, eaaz4571. .
[2]
Allen, C.D., Breshears, D.D., McDowell, N.G., 2015. On underestimation of global vulnerability to tree mortality and forest die-off from hotter drought in the Anthropocene. Ecosphere 6, 1–55. .
[3]
Anderegg, L.D., Anderegg, W.R., Berry, J.A., 2013. Not all droughts are created equal: translating meteorological drought into woody plant mortality. Tree Physiol. 33, 672–683. .
[4]
Anderegg, W.R., Klein, T., Bartlett, M., Sack, L., Pellegrini, A.F., Choat, B., Jansen, S., 2016. Meta-analysis reveals that hydraulic traits explain cross-species patterns of drought-induced tree mortality across the globe. Proc. Natl. Acad. Sci. USA 113, 5024–5029. .
[5]
Anderegg, W.R., Schwalm, C., Biondi, F., Camarero, J.J., Koch, G., Litvak, M., Ogle, K., Shaw, J.D., Shevliakova, E., Williams, A., 2015. Pervasive drought legacies in forest ecosystems and their implications for carbon cycle models. Science 349, 528–532. .
Ault, T.R., 2020. On the essentials of drought in a changing climate. Science 368, 256–260. .
[8]
Barton, K., 2009. MuMIn: multi-model inference. . (Accessed 15 December 2022).
[9]
Brienen, R.J., Gloor, E., Zuidema, P.A., 2012. Detecting evidence for CO2 fertilization from tree ring studies: the potential role of sampling biases. Global Biogeochem. Cycles 26. .
[10]
Brodribb, T.J., Powers, J., Cochard, H., Choat, B., 2020. Hanging by a thread? Forests and drought. Science 368, 261–266. .
[11]
Bunn, A.G., 2008. A dendrochronology program library in R (dplR). Dendrochronologia 26, 115–124. .
[12]
Cabon, A., Fernández-de-Uña, L., Gea-Izquierdo, G., Meinzer, F.C., Woodruff, D.R., Martínez-Vilalta, J., De Cáceres, M., 2020a. Water potential control of turgor-driven tracheid enlargement in Scots pine at its xeric distribution edge. New Phytol. 225, 209–221. .
[13]
Cabon, A., Peters, R.L., Fonti, P., Martínez-Vilalta, J., De Cáceres, M., 2020b. Temperature and water potential co-limit stem cambial activity along a steep elevational gradient. New Phytol. 226, 1325–1340. .
[14]
Cailleret, M., Dakos, V., Jansen, S., Robert, E.M., Aakala, T., Amoroso, M.M., Antos, J.A., Bigler, C., Bugmann, H., Caccianaga, M., 2019. Early-warning signals of individual tree mortality based on annual radial growth. Front. Plant Sci. 9. .
[15]
Cayan, D.R., Das, T., Pierce, D.W., Barnett, T.P., Tyree, M., Gershunov, A., 2010. Future dryness in the southwest US and the hydrology of the early 21st century drought. Proc. Natl. Acad. Sci. USA 107, 21271–21276. .
[16]
Cook, E.R., 1985. A Time Series Analysis Approach to Tree Ring Standardization. University of Arizona, Tucson. . (Accessed 15 December 2022).
[17]
Cook, E.R., Kairiukstis, L.A., 2013. Methods of Dendrochronology: Applications in the Environmental Sciences. Springer Science & Business Media. . (Accessed 15 December 2022).
[18]
Craine, J.M., Elmore, A.J., Wang, L., Aranibar, J., Bauters, M., Boeckx, P., Crowley, B.E., Dawes, M.A., Delzon, S., Fajardo, A., 2018. Isotopic evidence for oligotrophication of terrestrial ecosystems. Nat. Ecol. Evol. 2, 1735–1744. .
[19]
De Boeck, H.J., Dreesen, F.E., Janssens, I.A., Nijs, I., 2010. Climatic characteristics of heat waves and their simulation in plant experiments. Global Change Biol. 16, 1992–2000. .
[20]
De Schepper, V., Steppe, K., 2010. Development and verification of a water and sugar transport model using measured stem diameter variations. J. Exp. Bot. 61, 2083–2099. .
[21]
DeSoto, L., Cailleret, M., Sterck, F., Jansen, S., Kramer, K., Robert, E.M., Aakala, T., Amoroso, M.M., Bigler, C., Camarero, J.J., 2020. Low growth resilience to drought is related to future mortality risk in trees. Nat. Commun. 11, 545. .
[22]
DeWitt, T.J., Sih, A., Wilson, D.S., 1998. Costs and limits of phenotypic plasticity. Trends Ecol. Evol. 13, 77–81. .
[23]
Dietze, M.C., Sala, A., Carbone, M.S., Czimczik, C.I., Mantooth, J.A., Richardson, A.D., Vargas, R., 2014. Nonstructural carbon in woody plants. Annu. Rev. Plant Biol. 65, 667–687. .
[24]
Drake, J.E., Tjoelker, M.G., Vårhammar, A., Medlyn, B.E., Reich, P.B., Leigh, A., Pfautsch, S., Blackman, C.J., López, R., Aspinwall, M.J., 2018. Trees tolerate an extreme heatwave via sustained transpirational cooling and increased leaf thermal tolerance. Global Change Biol. 24, 2390–2402. .
[25]
Duchesne, L., Houle, D., Ouimet, R., Caldwell, L., Gloor, M., Brienen, R., 2019. Large apparent growth increases in boreal forests inferred from tree-rings are an artefact of sampling biases. Sci. Rep. 9, 6832. .
[26]
Engelbrecht, B.M., Comita, L.S., Condit, R., Kursar, T.A., Tyree, M.T., Turner, B.L., Hubbell, S.P., 2007. Drought sensitivity shapes species distribution patterns in tropical forests. Nature 447, 80–82. .
[27]
Fleta-Soriano, E., Munné-Bosch, S., 2016. Stress memory and the inevitable effects of drought: a physiological perspective. Front. Plant Sci. 7, 143. .
[28]
Fox, J., 2003. Effect displays in R for generalised linear models. J. Stat. Software 8, 1–27. .
[29]
Franklin, O., Harrison, S.P., Dewar, R., Farrior, C.E., Brännström, Å., Dieckmann, U., Pietsch, S., Falster, D., Cramer, W., Loreau, M., 2020. Organizing principles for vegetation dynamics. Native Plants 6, 444–453. .
[30]
Gazol, A., Camarero, J.J., Vicente-Serrano, S.M., Sánchez-Salguero, R., Gutiérrez, E., de Luis, M., Sangüesa-Barreda, G., Novak, K., Rozas, V., Tíscar, P.A., 2018. Forest resilience to drought varies across biomes. Global Change Biol. 24, 2143–2158. .
[31]
Giuggiola, A., Ogée, J., Rigling, A., Gessler, A., Bugmann, H., Treydte, K., 2016. Improvement of water and light availability after thinning at a xeric site: which matters more? A dual isotope approach. New Phytol. 210, 108–121. .
[32]
Greenwood, S., Ruiz-Benito, P., Martínez-Vilalta, J., Lloret, F., Kitzberger, T., Allen, C.D., Fensham, R., Laughlin, D.C., Kattge, J., Bönisch, G., 2017. Tree mortality across biomes is promoted by drought intensity, lower wood density and higher specific leaf area. Ecol. Lett. 20, 539–553. .
[33]
Grissino-Mayer, H.D., Fritts, H.C., 1997. The International Tree-Ring Data Bank: an enhanced global database serving the global scientific community. Holocene 7, 235–238. .
Guerrieri, R., Vanguelova, E., Pitman, R., Benham, S., Perks, M., Morison, J.I., Mencuccini, M., 2020. Climate and atmospheric deposition effects on forest water-use efficiency and nitrogen availability across Britain. Sci. Rep. 10, 12418. .
[36]
Hammond, W.M., Williams, A.P., Abatzoglou, J.T., Adams, H.D., Klein, T., López, R., Sáenz-Romero, C., Hartmann, H., Breshears, D.D., Allen, C.D., 2022. Global field observations of tree die-off reveal hotter-drought fingerprint for Earth's forests. Nat. Commun. 13, 1761. .
[37]
Harris, I., Osborn, T.J., Jones, P., Lister, D., 2020. Version 4 of the CRU TS monthly high-resolution gridded multivariate climate dataset. Sci. Data 7, 109. .
[38]
Hyndman, R.J., Athanasopoulos, G., 2018. Forecasting: principles and practice (OTexts). . (Accessed 15 December 2022).
[39]
Hyndman, R.J., Khandakar, Y., 2008. Automatic time series forecasting: the forecast package for R. J. Stat. Software 27, 1–22. .
[40]
Ingrisch, J., Bahn, M., 2018. Towards a comparable quantification of resilience. Trends Ecol. Evol. 33, 251–259. .
[41]
IPCC, 2013. Climate Change 2013: the Physical Science Basis. Contribution of Working Group I to the Fifth Assessment Report of the Intergovernmental Panel on Climate Change. Cambridge University Press, Cambridge. .(Accessed 15 December 2022).
[42]
Jiang, P., Liu, H., Piao, S., Ciais, P., Wu, X., Yin, Y., Wang, H., 2019. Enhanced growth after extreme wetness compensates for post-drought carbon loss in dry forests. Nat. Commun. 10, 195. .
[43]
Julio Camarero, J., Gazol, A., Sangüesa-Barreda, G., Cantero, A., Sánchez-Salguero, R., Sánchez-Miranda, A., Granda, E., Serra-Maluquer, X., Ibáñez, R., 2018. Forest growth responses to drought at short-and long-term scales in Spain: squeezing the stress memory from tree rings. Front. Ecol. Evol. 6, 9. .
[44]
Jump, A.S., Ruiz-Benito, P., Greenwood, S., Allen, C.D., Kitzberger, T., Fensham, R., Martínez-Vilalta, J., Lloret, F., 2017. Structural overshoot of tree growth with climate variability and the global spectrum of drought-induced forest dieback. Global Change Biol. 23, 3742–3757. .
[45]
Kannenberg, S.A., Novick, K.A., Alexander, M.R., Maxwell, J.T., Moore, D.J., Phillips, R.P., Anderegg, W.R., 2019. Linking drought legacy effects across scales: from leaves to tree rings to ecosystems. Global Change Biol. 25, 2978–2992. .
[46]
Klesse, S., 2021. Critical note on the application of the “two-third” spline. Dendrochronologia 65, 125786. .
[47]
Klesse, S., DeRose, R.J., Guiterman, C.H., Lynch, A.M., O'Connor, C.D., Shaw, J.D., Evans, M.E., 2018. Sampling bias overestimates climate change impacts on forest growth in the southwestern United States. Nat. Commun. 9, 5336. .
[48]
Lenth, R.V., 2016. Least-squares means: the R package lsmeans. J. Stat. Software 69, 1–33. .
[49]
Levesque, M., Andreu-Hayles, L., Pederson, N., 2017. Water availability drives gas exchange and growth of trees in northeastern US, not elevated CO2 and reduced acid deposition. Sci. Rep. 7, 46158. .
[50]
Li, X., Piao, S., Wang, K., Wang, X., Wang, T., Ciais, P., Chen, A., Lian, X., Peng, S., Peñuelas, J., 2020. Temporal trade-off between gymnosperm resistance and resilience increases forest sensitivity to extreme drought. Nat. Ecol. Evol. 4, 1075–1083. .
[51]
Liu, Y., Kumar, M., Katul, G.G., Feng, X., Konings, A.G., 2020. Plant hydraulics accentuates the effect of atmospheric moisture stress on transpiration. Nat. Clim. Change 10, 691–695. .
[52]
Lloret, F., Escudero, A., Iriondo, J.M., Martínez-Vilalta, J., Valladares, F., 2012. Extreme climatic events and vegetation: the role of stabilizing processes. Global Change Biol. 18, 797–805. .
[53]
Lloret, F., Keeling, E.G., Sala, A., 2011. Components of tree resilience: effects of successive low-growth episodes in old ponderosa pine forests. Oikos 120, 1909–1920. .
[54]
Lüdecke, D., Makowski, D., Waggoner, P., Patil, I., 2020. Performance: assessment of regression models performance. . (Accessed 15 December 2022).
[55]
MacGillivray, C., Grime, J., Team, T.I.S.P., 1995. Testing predictions of the resistance and resilience of vegetation subjected to extreme events. Funct. Ecol. 9, 640–649. .
[56]
Martínez-Vilalta, J., López, B.C., Loepfe, L., Lloret, F., 2012. Stand-and tree-level determinants of the drought response of Scots pine radial growth. Oecologia 168, 877–888. .
[57]
Mason, R.E., Craine, J.M., Lany, N.K., Jonard, M., Ollinger, S.V., Groffman, P.M., Fulweiler, R.W., Angerer, J., Read, Q.D., Reich, P.B., 2022. Evidence, causes, and consequences of declining nitrogen availability in terrestrial ecosystems. Science 376, eabh3767. .
Mu, Y., Lyu, L., Li, Y., Fang, O., 2022. Tree-ring evidence of ecological stress memory. Proc. Royal Soc. B. 289, 20221850. .
[60]
Nimmo, D., Mac Nally, R., Cunningham, S.C., Haslem, A., Bennett, A.F., 2015. Vive la résistance: reviving resistance for 21st century conservation. Trends Ecol. Evol. 30, 516–523. .
[61]
Novick, K.A., Ficklin, D.L., Stoy, P.C., Williams, C.A., Bohrer, G., Oishi, A.C., Papuga, S.A., Blanken, P.D., Noormets, A., Sulman, B.N., 2016. The increasing importance of atmospheric demand for ecosystem water and carbon fluxes. Nat. Clim. Change 6, 1023–1027. .
[62]
Orwin, K.H., Wardle, D.A., 2004. New indices for quantifying the resistance and resilience of soil biota to exogenous disturbances. Soil Biol. Biochem. 36, 1907–1912. .
[63]
Ovenden, T.S., Perks, M.P., Clarke, T.K., Mencuccini, M., Jump, A.S., 2021. Life after recovery: increased resolution of forest resilience assessment sheds new light on post-drought compensatory growth and recovery dynamics. J. Ecol. 109, 3157–3170. .
[64]
Padrón, R.S., Gudmundsson, L., Decharme, B., Ducharne, A., Lawrence, D.M., Mao, J., Peano, D., Krinner, G., Kim, H., Seneviratne, S.I., 2020. Observed changes in dry-season water availability attributed to human-induced climate change. Nat. Geosci. 13, 477–481. .
[65]
Pagán, B.R., Maes, W.H., Gentine, P., Martens, B., Miralles, D.G., 2019. Exploring the potential of satellite solar-induced fluorescence to constrain global transpiration estimates. Rem. Sens. 11, 413. .
[66]
Páscoa, P., Gouveia, C., Russo, A., Trigo, R., 2017. The role of drought on wheat yield interannual variability in the Iberian Peninsula from 1929 to 2012. Int. J. Biometeorol. 61, 439–451. .
[67]
Pasho, E., Camarero, J.J., de Luis, M., Vicente-Serrano, S.M., 2011. Impacts of drought at different time scales on forest growth across a wide climatic gradient in north-eastern Spain. Agric. For. Meteorol. 151, 1800–1811. .
[68]
Peltier, D.M., Barber, J.J., Ogle, K., 2018. Quantifying antecedent climatic drivers of tree growth in the Southwestern US. J. Ecol. 106, 613–624. .
[69]
Peltier, D.M., Fell, M., Ogle, K., 2016. Legacy effects of drought in the southwestern United States: a multi-species synthesis. Ecol. Monogr. 86, 312–326. .
[70]
Peltier, D.M., Ogle, K., 2020. Tree growth sensitivity to climate is temporally variable. Ecol. Lett. 23, 1561–1572. .
[71]
Peñuelas, J., Ciais, P., Canadell, J.G., Janssens, I.A., Fernández-Martínez, M., Carnicer, J., Obersteiner, M., Piao, S., Vautard, R., Sardans, J., 2017. Shifting from a fertilization-dominated to a warming-dominated period. Nat. Ecol. Evol. 1, 1438–1445. .
[72]
Peters, R.L., Steppe, K., Cuny, H.E., De Pauw, D.J., Frank, D.C., Schaub, M., Rathgeber, C.B., Cabon, A., Fonti, P., 2021. Turgor–a limiting factor for radial growth in mature conifers along an elevational gradient. New Phytol. 229, 213–229. .
[73]
Peterson, R.A., Cavanaugh, J.E., 2019. Ordered quantile normalization: a semiparametric transformation built for the cross-validation era. J. Appl. Stat. .
[74]
Poyatos, R., Martínez-Vilalta, J., Čermák, J., Ceulemans, R., Granier, A., Irvine, J., Köstner, B., Lagergren, F., Meiresonne, L., Nadezhdina, N., 2007. Plasticity in hydraulic architecture of Scots pine across Eurasia. Oecologia 153, 245–259. .
[75]
R Core Team, 2018. R: A Language and Environment for Statistical Computing. R foundation for statistical computing Vienna, Austria. . (Accessed 15 December 2022).
[76]
Reichstein, M., Bahn, M., Ciais, P., Frank, D., Mahecha, M.D., Seneviratne, S.I., Zscheischler, J., Beer, C., Buchmann, N., Frank, D.C., 2013. Climate extremes and the carbon cycle. Nature 500, 287–295. .
[77]
Rosas, T., Mencuccini, M., Barba, J., Cochard, H., Saura-Mas, S., Martínez-Vilalta, J., 2019. Adjustments and coordination of hydraulic, leaf and stem traits along a water availability gradient. New Phytol. 223, 632–646. .
[78]
Schwalm, C.R., Anderegg, W.R., Michalak, A.M., Fisher, J.B., Biondi, F., Koch, G., Litvak, M., Ogle, K., Shaw, J.D., Wolf, A., 2017. Global patterns of drought recovery. Nature 548, 202–205. .
[79]
Seneviratne, S.I., Lüthi, D., Litschi, M., Schär, C., 2006. Land-atmosphere coupling and climate change in Europe. Nature 443, 205–209. .
[80]
Senf, C., Buras, A., Zang, C.S., Rammig, A., Seidl, R., 2020. Excess forest mortality is consistently linked to drought across Europe. Nat. Commun. 11, 6200. .
[81]
Serra-Maluquer, X., Gazol, A., Anderegg, W.R., Martínez-Vilalta, J., Mencuccini, M., Camarero, J.J., 2022. Wood density and hydraulic traits influence species' growth response to drought across biomes. Global Change Biol. 28, 3871–3882. .
[82]
Serra-Maluquer, X., Granda, E., Camarero, J.J., Vilà-Cabrera, A., Jump, A.S., Sánchez-Salguero, R., Sangüesa-Barreda, G., Imbert, J.B., Gazol, A., 2021. Impacts of recurrent dry and wet years alter long-term tree growth trajectories. J. Ecol. 109, 1561–1574. .
[83]
Stovall, A.E., Shugart, H., Yang, X., 2019. Tree height explains mortality risk during an intense drought. Nat. Commun. 10, 4385. .
[84]
Trenberth, K.E., Dai, A., Van Der Schrier, G., Jones, P.D., Barichivich, J., Briffa, K.R., Sheffield, J., 2014. Global warming and changes in drought. Nat. Clim. Change 4, 17–22. .
[85]
Trugman, A.T., Anderegg, L.D., Sperry, J.S., Wang, Y., Venturas, M., Anderegg, W.R., 2019. Leveraging plant hydraulics to yield predictive and dynamic plant leaf allocation in vegetation models with climate change. Global Change Biol. 25, 4008–4021. .
[86]
Valladares, F., Gianoli, E., Gómez, J.M., 2007. Ecological limits to plant phenotypic plasticity. New Phytol. 176, 749–763. .
[87]
Vicente-Serrano, S.M., Beguería, S., López-Moreno, J.I., 2010. A multiscalar drought index sensitive to global warming: the standardized precipitation evapotranspiration index. J. Clim. 23, 1696–1718. .
[88]
Vicente-Serrano, S.M., Quiring, S.M., Pena-Gallardo, M., Yuan, S., Dominguez-Castro, F., 2020. A review of environmental droughts: increased risk under global warming? Earth Sci. Rev. 201, 102953. .
[89]
Vicente-Serrano, S.M., Domínguez-Castro, F., McVicar, T.R., Tomas-Burguera, M., Peña-Gallardo, M., Noguera, I., López-Moreno, J.I., Pena, D., El Kenawy, A., 2020a. Global characterization of hydrological and meteorological droughts under future climate change: the importance of timescales, vegetation-CO2 feedbacks and changes to distribution functions. Int. J. Climatol. 40, 2557–2567. .
[90]
Vicente-Serrano, S.M., McVicar, T.R., Miralles, D.G., Yang, Y., Tomas-Burguera, M., 2020b. Unraveling the influence of atmospheric evaporative demand on drought and its response to climate change. Wiley Interdiscip. Rev. Clim. Change 11, e632. .
[91]
Williams, A.P., Allen, C.D., Millar, C.I., Swetnam, T.W., Michaelsen, J., Still, C.J., Leavitt, S.W., 2010. Forest responses to increasing aridity and warmth in the southwestern United States. Proc. Natl. Acad. Sci. USA 107, 21289–21294. .
[92]
Wilmking, M., van der Maaten-Theunissen, M., van der Maaten, E., Scharnweber, T., Buras, A., Biermann, C., Gurskaya, M., Hallinger, M., Lange, J., Shetti, R., 2020. Global assessment of relationships between climate and tree growth. Global Change Biol. 26, 3212–3220. .
[93]
Wu, X., Liu, H., Li, X., Ciais, P., Babst, F., Guo, W., Zhang, C., Magliulo, V., Pavelka, M., Liu, S., 2018. Differentiating drought legacy effects on vegetation growth over the temperate Northern Hemisphere. Global Change Biol. 24, 504–516. .
[94]
Yin, J., Bauerle, T.L., 2017. A global analysis of plant recovery performance from water stress. Oikos 126, 1377–1388. .
[95]
Yuan, W., Zheng, Y., Piao, S., Ciais, P., Lombardozzi, D., Wang, Y., Ryu, Y., Chen, G., Dong, W., Hu, Z., 2019. Increased atmospheric vapor pressure deficit reduces global vegetation growth. Sci. Adv. 5, eaax1396. .
[96]
Zhang, Q., Kong, D., Singh, V.P., Shi, P., 2017. Response of vegetation to different time-scales drought across China: spatiotemporal patterns, causes and implications. Global Planet. Change 152, 109. .
[97]
Zhang, Y., Keenan, T.F., Zhou, S., 2021. Exacerbated drought impacts on global ecosystems due to structural overshoot. Nat. Ecol. Evol. 5, 1490–1498. .
[98]
Zhao, S., Pederson, N., D'Orangeville, L., HilleRisLambers, J., Boose, E., Penone, C., Bauer, B., Jiang, Y., Manzanedo, R.D., 2019. The International Tree-Ring Data Bank (ITRDB) revisited: data availability and global ecological representativity. J. Biogeogr. 46, 355–368. .
[99]
Zheng, T., Martínez-Vilalta, J., García-Valdés, R., Gazol, A., Camarero, J.J., Mencuccini, M., 2021. Disentangling biology from mathematical necessity in twentieth-century gymnosperm resilience trends. Nat. Ecol. Evol. 5, 733–735. .
[100]
Zhou, S., Williams, A.P., Berg, A.M., Cook, B.I., Zhang, Y., Hagemann, S., Lorenz, R., Seneviratne, S.I., Gentine, P., 2019. Land-atmosphere feedbacks exacerbate concurrent soil drought and atmospheric aridity. Proc. Natl. Acad. Sci. USA 116, 18848–18853. .
[101]
Zipper, S.C., Qiu, J., Kucharik, C.J., 2016. Drought effects on US maize and soybean production: spatiotemporal patterns and historical changes. Environ. Res. Lett. 11, 094021. .
[102]
Zscheischler, J., Fischer, E.M., 2020. The record-breaking compound hot and dry 2018 growing season in Germany. Weather Clim. Extrem. 29, 100270. .
[103]
Zscheischler, J., Orth, R., Seneviratne, S.I., 2017. Bivariate return periods of temperature and precipitation explain a large fraction of European crop yields. Biogeosciences 14, 3309–3320. .
[104]
Zscheischler, J., Seneviratne, S.I., 2017. Dependence of drivers affects risks associated with compound events. Sci. Adv. 3, e1700263. .
Table
1.
Summary of the estimates of the role of plasticity in avoiding resilience losses during the second half of the 20th century. Estimates are obtained based on different assumptions using the results given in the corresponding figures and tables. The first line in the table provides an estimate of plasticity having accounted for climatic conditions in different ways. The second line gives the estimate of avoided losses in resilience by relating the plasticity changes of the first line to the observed net temporal losses of Fig. 5c. Data from Fig. 3 are obtained from the model in Table S6 as the linear slope of Decade for compound events for the post-1960 period. Estimates of plasticity effects from Figs. S6 and 4 are obtained as the linear slope of Decade for compound events for the post-1960 period for the 1901–1910, 1951–1960 and 1991–2000 constant-climate scenarios, respectively. Because resilience indices are standardized with mean of 0 and standard deviation of 1, changes due to plasticity are given as % of 1 standard deviation.

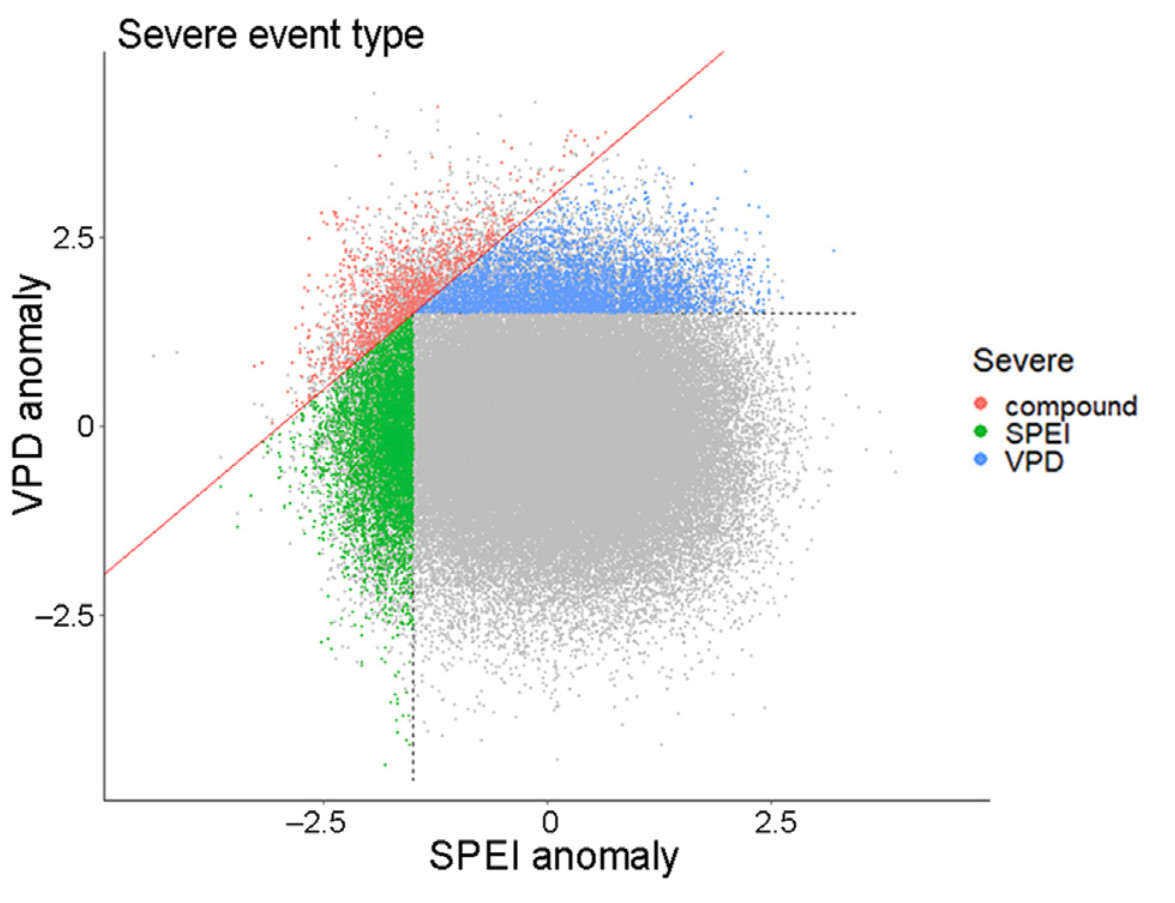
 DownLoad:
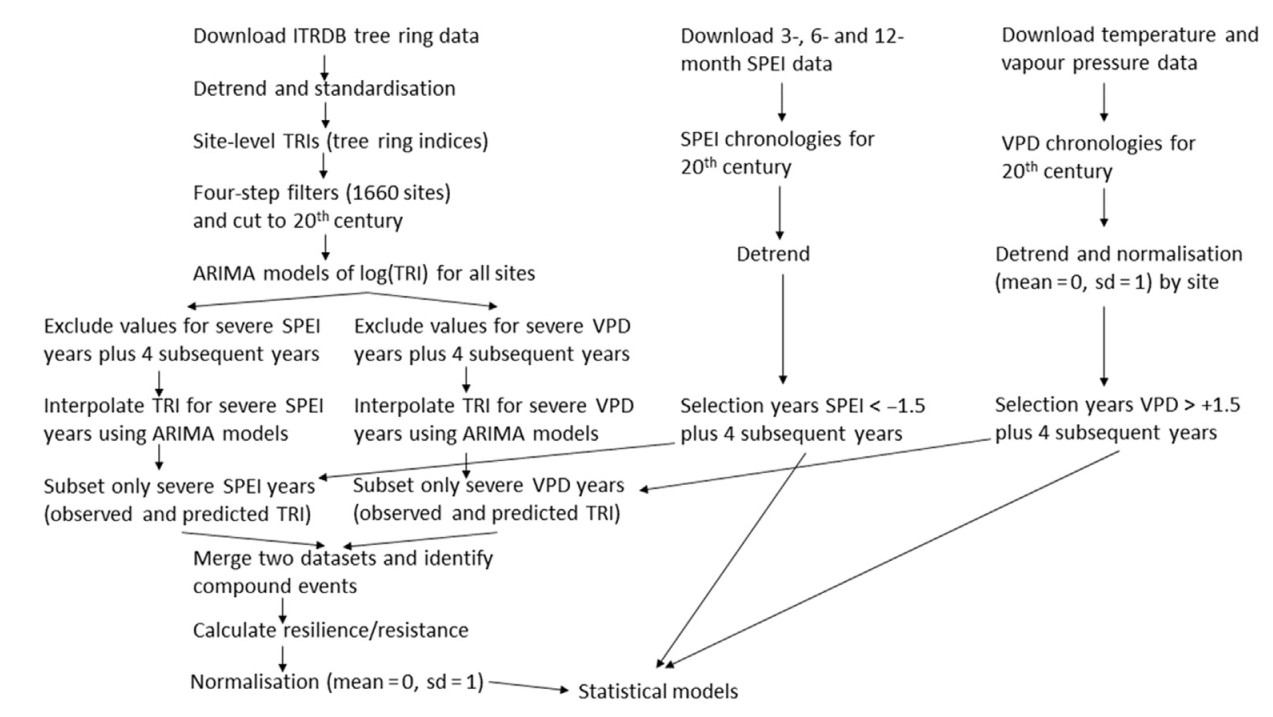
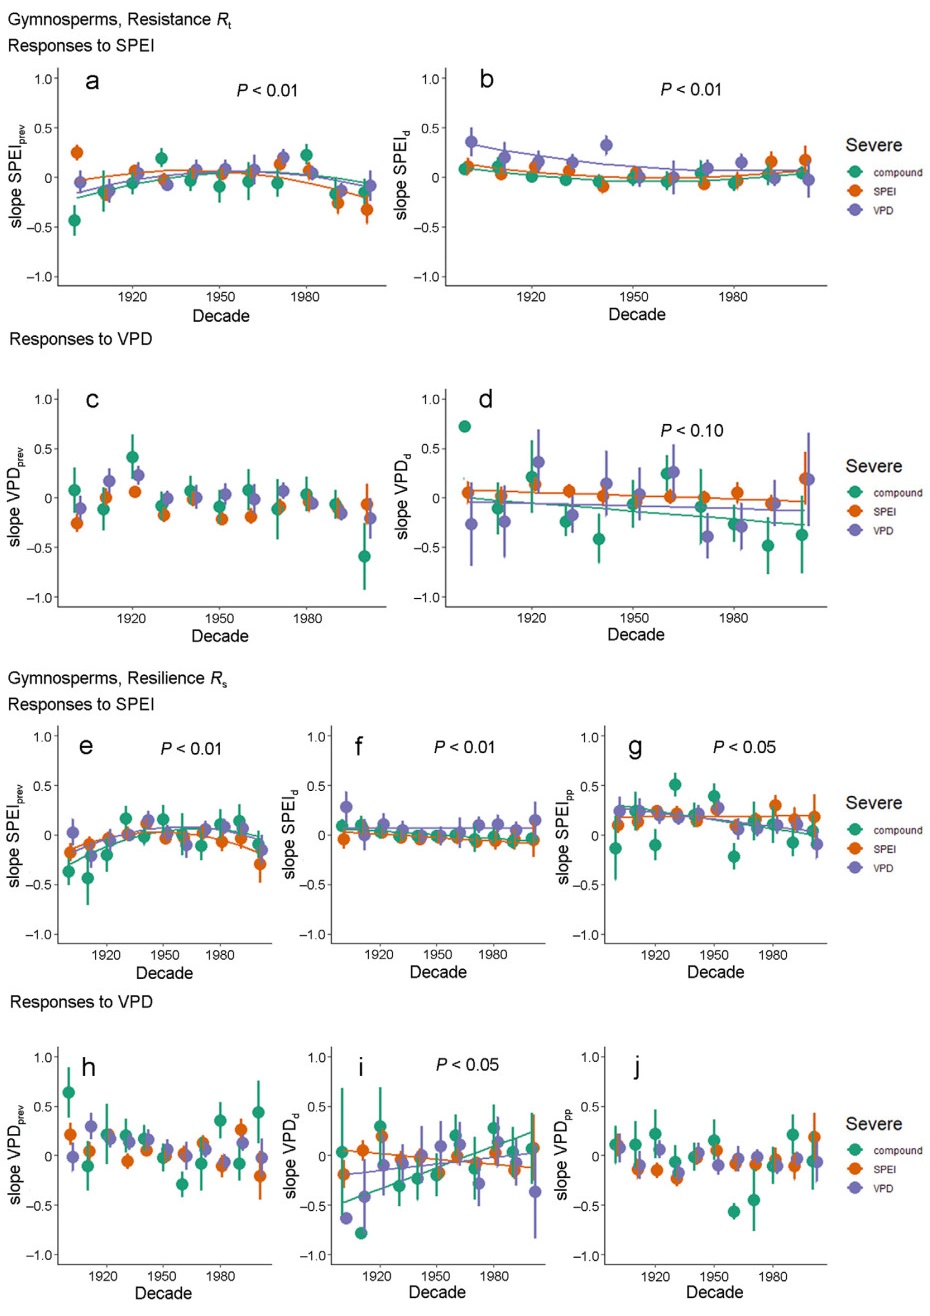
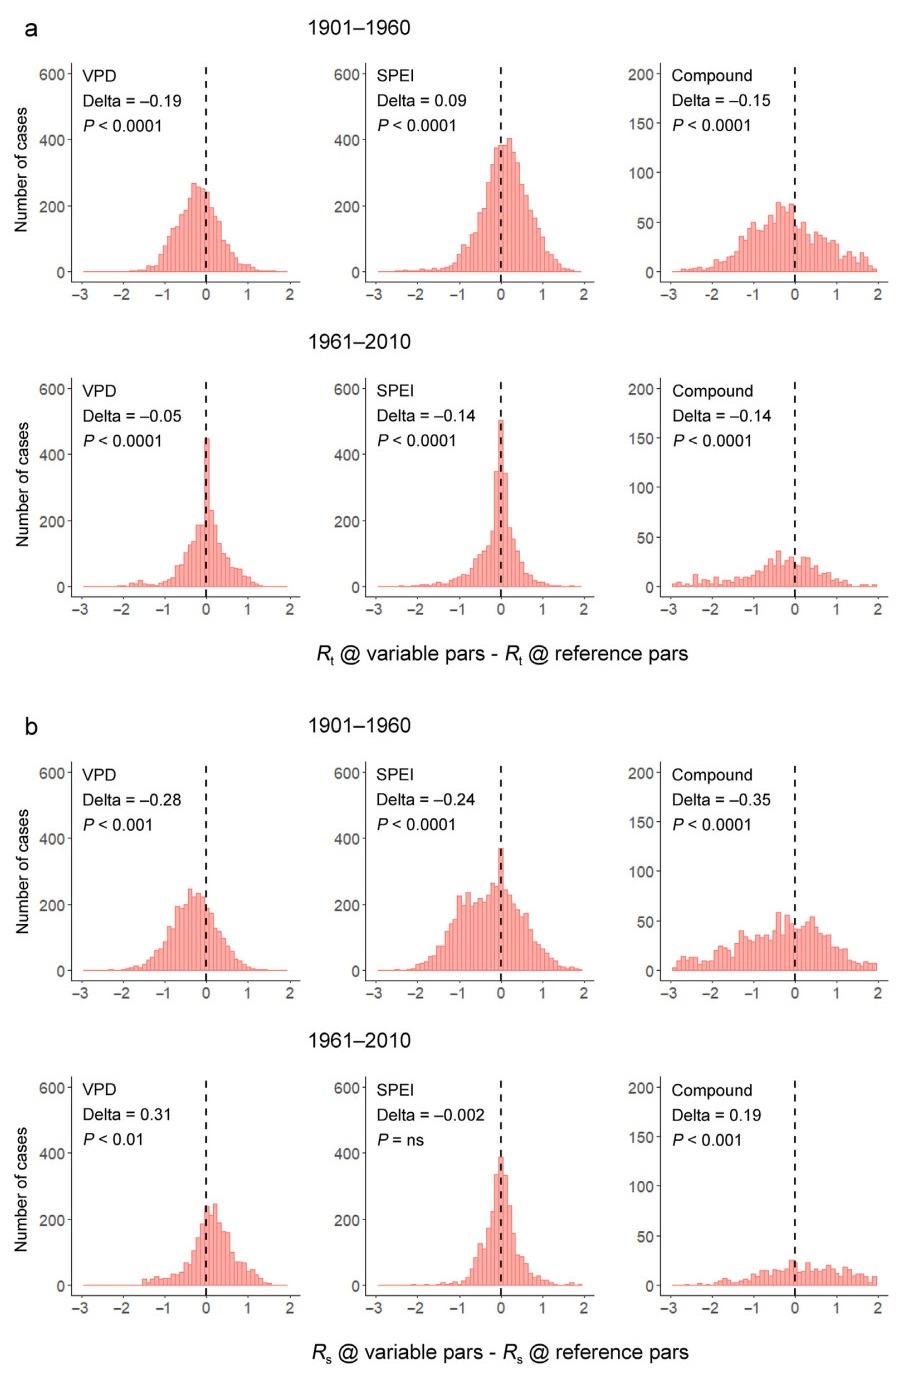
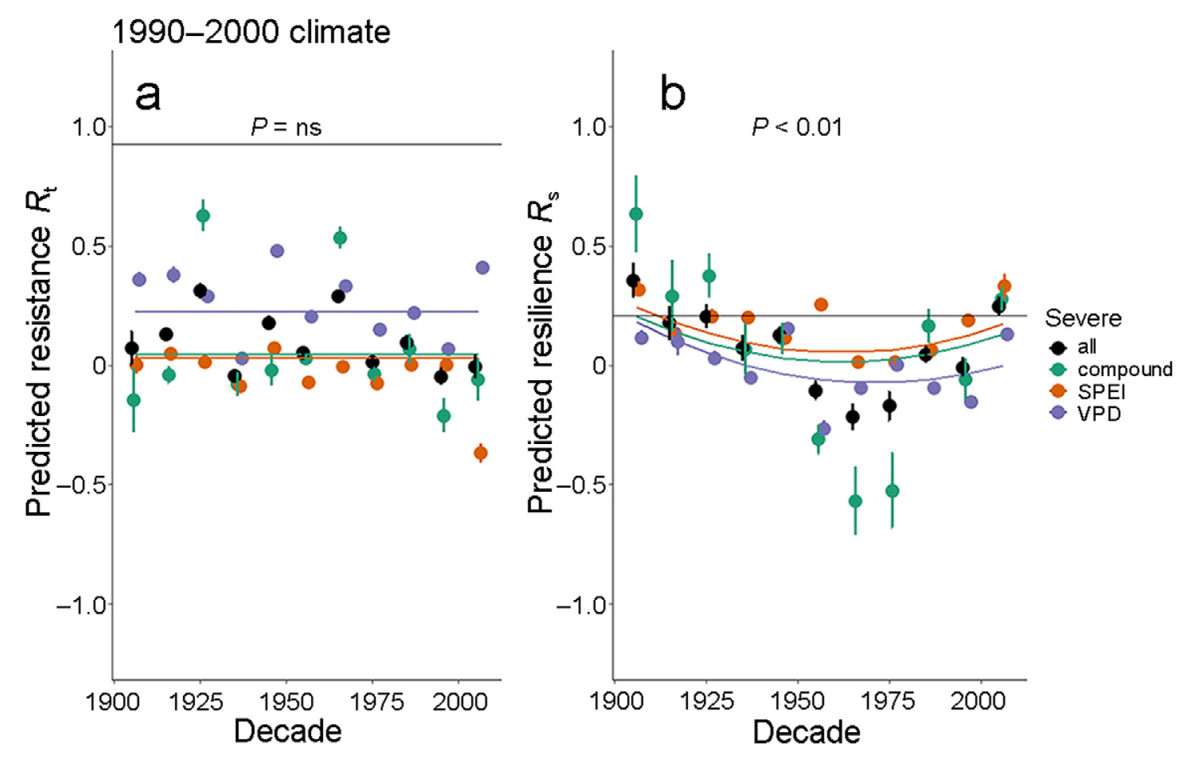
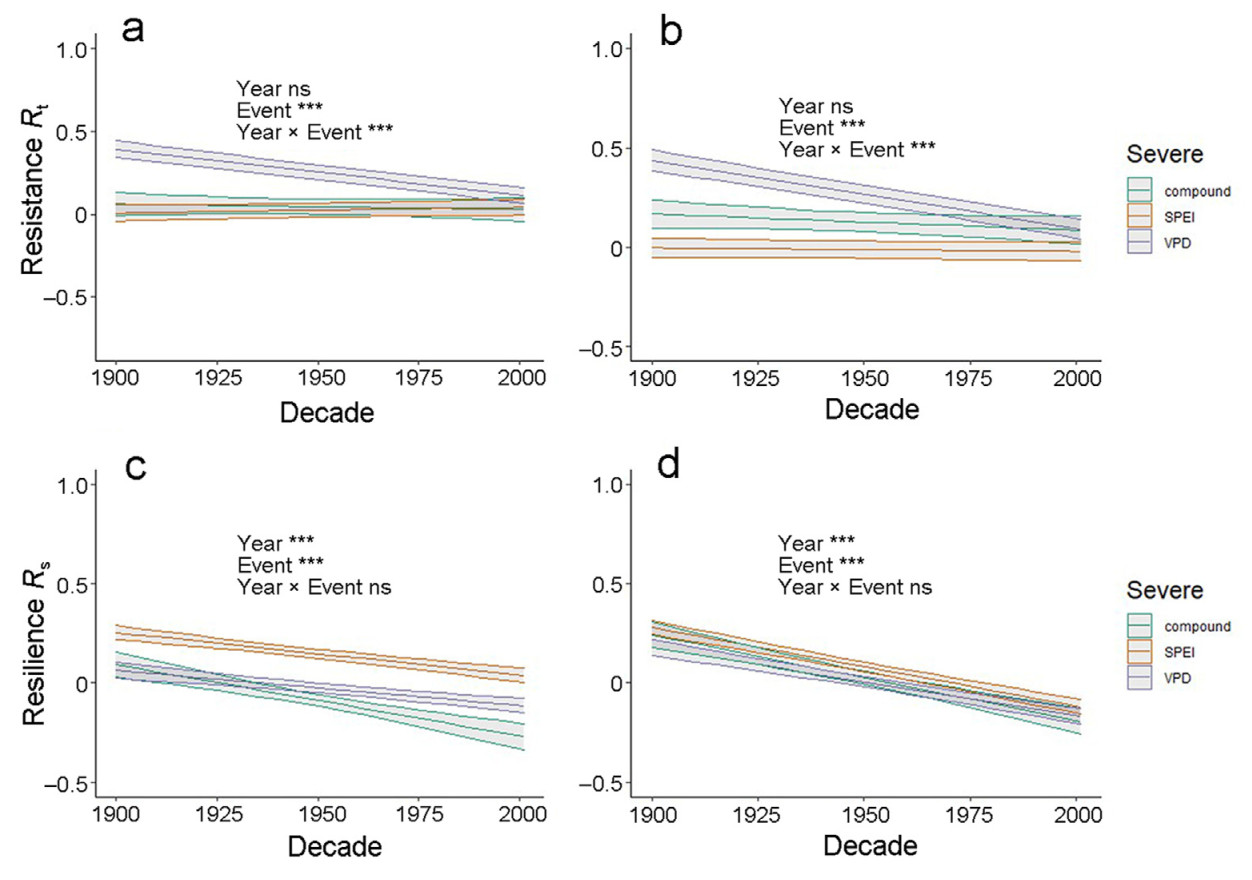


 Email Alerts
 RSS Feeds