Cen Chen, Andrew S. Nelson, Terry Shaw, Mark Kimsey. Effects of fertilization on the growth dominance of Inland Northwest forests of the United States[J]. Forest Ecosystems, 2022, 9(1): 100038. DOI: 10.1016/j.fecs.2022.100038
Citation:
Cen Chen, Andrew S. Nelson, Terry Shaw, Mark Kimsey. Effects of fertilization on the growth dominance of Inland Northwest forests of the United States[J]. Forest Ecosystems, 2022, 9(1): 100038. DOI: 10.1016/j.fecs.2022.100038
Cen Chen, Andrew S. Nelson, Terry Shaw, Mark Kimsey. Effects of fertilization on the growth dominance of Inland Northwest forests of the United States[J]. Forest Ecosystems, 2022, 9(1): 100038. DOI: 10.1016/j.fecs.2022.100038
Citation:
Cen Chen, Andrew S. Nelson, Terry Shaw, Mark Kimsey. Effects of fertilization on the growth dominance of Inland Northwest forests of the United States[J]. Forest Ecosystems, 2022, 9(1): 100038. DOI: 10.1016/j.fecs.2022.100038
University of Idaho, Department of Forest, Rangeland and Fire Sciences, Moscow, ID, 83844, USA
Funds:
Funding for study establishment and remeasurements was provided by members of the Intermountain Forest Cooperative. Funding was also provided by the National Science FoundationIIP-1916699
Large trees have disproportionally large competitive advantage in access to light, which has been proposed to increase growth dominance of large trees (e.g., a larger proportion of volume growth than standing volume is in large trees in a stand). Tree growth may also be limited by the availability of other resources besides light. Nutrient deficiency, especially of nitrogen, is considered common among temperate forests including mixed-conifer forests of the Inland Northwest of the United States. Data from a long-term forest nutrition study across four Inland Northwest states were analyzed to evaluate nitrogen × potassium fertilization's effects on growth dominance over an eight-year period following treatment. Our results show that growth dominance varied substantially across plots in each vegetation series and fertilization treatment, and its mean values generally were at minuscule magnitudes, negative, and not significantly different from 0. We propose that this lack of a clear pattern in growth dominance was the result of the mixed-species composition where shade-tolerant species remained in lower crown positions, yet their relative growth kept pace with large trees. Limited moisture availability at dry sites may have hampered the development of growth dominance. Growth dominance also was lowered by mortality observed among relatively large trees. The largely negative growth dominance across fertilization treatments indicated that small trees seem to have maintained higher relative growth rates than large trees, even if absolute growth was higher among large trees. In the case fertilization does improve stand growth, a significant part of this improved growth will be lost in density-dependent mortality over time if not captured through thinning/harvesting.
Trees in a stand may grow at different rates relative to their sizes, known as growth dominance, which has been proposed to quantify the overall disparities in relative growth across various sized trees (Binkley, 2004). Stand growth usually peaks and declines around the time of canopy closure (Ryan et al., 1997). This pattern in stand growth is related to changes in forest structure driven by resource supply, demand, competition, and use efficiency (Perry, 1985; Binkley, 2004) and reflected in shifts in growth dominance (Binkley et al., 2006). Analyses of growth dominance have been applied to improve understanding of the effects of various resources' availabilities on forest development and productivity.
Light supply generally is consistent albeit limited over the course of forest development. Competition for light among trees is considered size-asymmetric such that large trees have access to a disproportionately larger amount of light than small trees (Weiner, 1990). This is proposed to result in increasing growth dominance of large trees (e.g., a larger proportion of volume growth than standing volume is in large trees in a stand) and declining resource use efficiency of small trees (Binkley, 2004).
Light often is not the only resource limiting forest growth. Tree growth processes are halted when tissue water-potential decreases below thresholds under moisture stress (Cole et al., 1990). Stomata are closed to prevent moisture loss, which prevents carbon uptake and photosynthesis, when moisture stress persists (McDowell et al., 2008). Growing season drought, as is common in the Inland Northwest of the United States (Jain and Graham, 2015), further worsens moisture stress due to high vapor pressure deficits and limits tree growth as high incident radiation is not utilized (Runyon et al., 1994). The ability of trees to compete for moisture is thought to be proportional to their sizes, which gives no competitive advantage to large trees (Lieffers and Titus, 1989; Weiner et al., 1997). The proposed increases in growth dominance related to large trees' disproportionate access to light will be compromised if they have no commensurate access to moisture.
Growth of temperate forests has long been viewed to be limited by nutrient availability (Tamm, 1995). Nitrogen (N) deficiency is considered common among many forest types, including mixed-conifer forests of the Inland Northwest (Coleman et al., 2014). Previous studies, e.g., Shafii et al. (1989) and Moore et al. (1991), have reported positive responses of foliar N concentration and stand growth to N fertilization in this region. However, effects of fertilization on growth dominance likely are more complex as nutrient availability and demand both vary greatly through stand development and across different sized trees. Nutrient uptake from fertilization of young forests is low since tree size is small, and the rapid decomposition of organic materials accumulated on the forest floor and in the upper soil horizons provides nutrients sufficient to meet tree demand (Vitousek and Matson, 1985). Available nutrients are gradually captured by trees and decline over time, but demands increase as trees grow larger (Fox et al., 2007). This eventually results in declines in stand growth around canopy closure when light intercepted by trees also peaks (Ryan et al., 1997). The relationships between forest structure, growth, and growth dominance likely are complicated by changes in nutrient availability (Ryan et al., 1997).
Effects of resource availability, forest composition, and structure on forest growth and hence growth dominance are intertwined. Moisture is more difficult to manipulate than nutrients, yet the efficacy of fertilization interacts with moisture availability (Gessel et al., 1990). For example, Rothstein (2018) proposed that trees had constrained responses to fertilization when moisture was also limited during the growing season, and Maggard et al. (2017) found that fertilization can compensate for decreased moisture availability by increasing water use efficiency of trees. Inland Northwest forests present a complex array of forest vegetation types, which are concomitant with the highly variable moisture regimes (Cooper et al., 1991). Light interception and use efficiency likely increase in mixed stands owing to more shade-tolerant understory trees (Binkley et al., 2006). Tolerance to drought differs across species in addition to tolerance to shade (Niinemets and Valladares, 2006). Trees' adaptive abilities to moisture and light availability may result in differentiated growth and growth dominance. For example, Douglas-fir (Pseudotsuga menziesii var. glauca (Mirbel) Franco) is a major component across vegetation types common in the Inland Northwest, and its competitiveness for growth dominance likely varies across vegetation types owing to varying moisture availability, its crown position, and the relative competitiveness of the other trees.
Fertilization potentially affects not only forest growth but also mortality. Fertilization increases nutrient availability and potentially reduces mortality by alleviating the competition for nutrients (Newton and Amponsah, 2006). Fertilization may also intensify size-asymmetric competition where large trees capture a greater proportion of light and prevent light from reaching small trees (Schwinning and Weiner, 1998). In addition, fertilization may cause nutrient imbalances in the soil that influence tree physiology and production of defensive compounds (Mandzak and Moore, 1994), which may increase density-independent mortality from insect attacks and diseases (Filip et al., 2002). Mortality directly affects growth dominance. For example, in a stand where large trees have growth dominance (e.g., in terms of volume), the death of a large tree will reduce this growth dominance as a larger proportion of potential growth than volume will be eliminated (i.e., the ratio between growth and volume of large trees will be reduced), and vice versa.
The Intermountain Forestry Cooperative at the University of Idaho carried out a long-term forest health and nutrition study across four states of the Inland Northwest of the United States (Shaw et al., 2014). The study provided repeated tree measurements covering major forest types in the region and offered an opportunity to evaluate N × potassium (K) fertilization's effects on forest growth and growth dominance. This evaluation helps understand how availabilities of various resources affect trajectories of forest development in a region of complex forest vegetation types and site conditions. The objectives of this study were to 1) examine changes in growth dominance following different one-time N × K fertilization treatments over an eight-year period across naturally regenerated Inland Northwest forests that cover major regional vegetation series and soil parent materials and 2) assess how temporal changes in growth dominance were related to growth and mortality, and how growth dominance varied by species composition classified by shade tolerance and vegetation series as a surrogate of moisture availability and hence site quality.
2.
Material and methods
2.1
Study sites
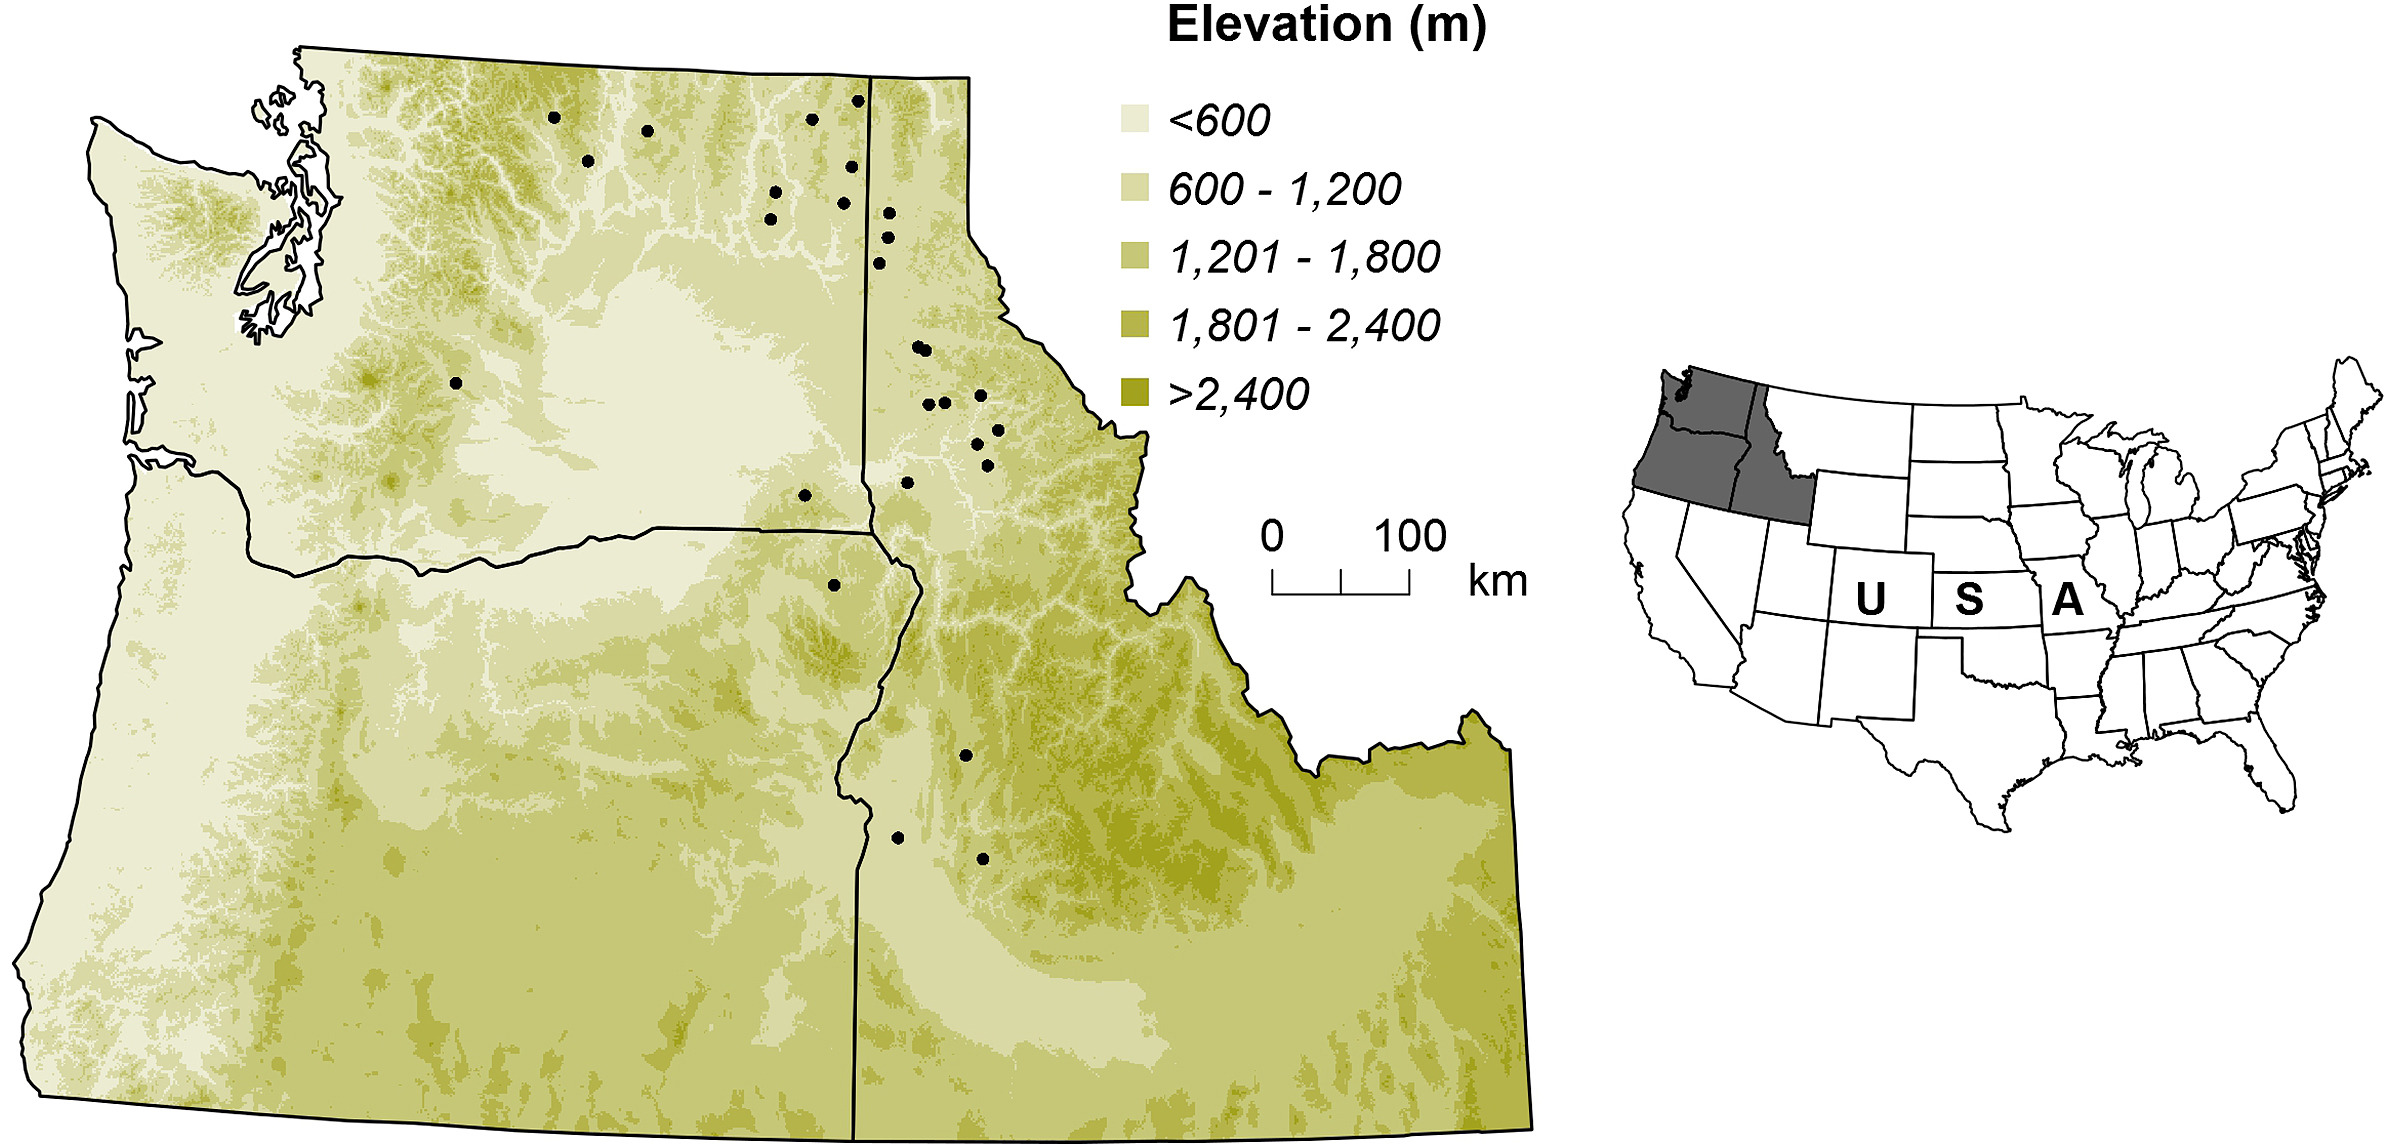
Data used in this study were collected at 27 sites across the Inland Northwest of the United States as a part of the Intermountain Forest Cooperative's forest health and nutrition study established between 1994 and 1996 (Fig. 1; Shaw et al., 2014). These sites of naturally regenerated forests cover soil parent materials and forest vegetation series representative of this region (Shaw et al., 2014). The soil parent materials include granitic, basaltic, metamorphic, and mixed (alluvium and glacial sedimentary deposits), while the vegetation series are dry/low productivity Douglas-fir series, moderate grand fir (Abies grandis (Douglas) Lindley) series, and moist/high productivity western redcedar (Thuja plicata Donn)/western hemlock (Tsuga heterophylla (Raf.) Sarg.) series (Cooper et al., 1991). The most abundant species, by stem count, were Douglas-fir (48%), ponderosa pine (Pinus ponderosa Douglas; 39%), and lodgepole pine (Pinus contorta var. latifolia Engelm.; 9%) at Douglas-fir series sites; Douglas-fir (42%), ponderosa pine (29%), and lodgepole pine (11%) at grand fir series sites; and grand fir (38%), Douglas-fir (35%), and western redcedar (17%) at western redcedar/western hemlock series sites. Site elevation ranged from 671 to 1,737 m.
Figure
1.
The study area and its location in the United States, where black dots are study sites.
At each site, plots receiving different fertilization treatments were established within a single stand to ensure similarities in stand structure, species composition, and stand history. Treatment plots were 0.2-ha squares with a 6.1-m buffer on all four sides. A 0.04-ha growth plot, from where tree measurements were taken, was nested within the center of each treatment plot. A total of 164 plots with initial stand ages between 15 and 74 years were available in this study (some sites had multiple plots of the same treatment). The experimental design of this study is shown in Table 1 and stand attributes from the plots are summarized by fertilization treatment and vegetation series in Table 2.
Table
1.
Numbers of plots by vegetation series, soil parent materials, fertilization treatments, and sites.
2.2
Fertilization treatments and tree measurements
Four one-time fertilization treatments of control (no fertilization), N only at 336 kg N·ha−1, K only at 191 kg K·ha−1, and N + K (same rates as in N and K only plots) were applied to the plots. Fertilization occurred in the fall of the year that the sites were established. N was added as urea (CO(NH2)2), while K was added as potassium chloride (KCl). Fertilizer was applied evenly across the plots using a hand spreader.
Tree measurements were collected in the fall starting with pre-treatment measurements. Species of trees were identified. DBH (diameter at 1.37 m above the ground) was measured on every tree in the growth plots every two years, and total height was measured at four-year intervals. Mortality of individual trees was recorded every two years. A total of eight years of data were available in this study.
2.3
Data preparation and analysis
Height was not measured in the second- and sixth-year measurements, so it was predicted for those years using the height-diameter equations from the Inland Empire Variant of the Forest Vegetation Simulator (FVS-IE; Keyser, 2008). Height and DBH were used to predict tree volumes using Flewelling's two-point profile models contained in the National Volume Estimator Library maintained by the Forest Products Measurement Group in the Forest Service Forest Management Service Center (Wykoff et al., 1982). Individual-tree volumes in each plot were summed and converted to per-hectare values (m3·ha−1). Trees were classified by shade tolerance. The most common shade-tolerant, mid-tolerant, and intolerant species were grand fir, Douglas-fir, and ponderosa pine, respectively, of which shade tolerance indexes are 4.0, 2.8, and 1.6, respectively (Niinemets and Valladares, 2006).
For each plot and measurement period, coefficient of variation (CV) of DBH was computed as standard deviation/mean × 100%. CV is a metric used to summarize size inequality such that a larger value indicates higher size inequality, e.g., wider DBH distribution. CV is unitless and can be viewed as standard deviation normalized by the mean, which makes it comparable across samples of trees of varying sizes and/or trees measured using different units (e.g., cm vs. inch).
Growth dominance (G), a relative measure of how stand volume growth is distributed among trees of different sizes (Binkley, 2004), was computed using the procedure presented by West (2014):
G=1−∑i=1,…,n−1(si+1−si)(di+1+di)
where Si=∑j=1,…,iSj/∑j=1,…,nSj and Sj is the volume of the jth tree such that Sj ≤ Sj, and di=∑j=1,…,iDj/∑j=1,…,nDj and Dj is the volume growth of the jth tree in a plot of n trees. G is unitless and falls within a range from −1 to 1. G = 0 when every tree grows at the same proportion to their initial volumes, G > 0 when large trees account for a larger proportion of stand growth than volume, and G < 0 when small trees account for a larger proportion of stand growth than volume. G was computed for each plot and measurement period. Obviously, other measures of tree sizes and growth can also be used to compute growth dominance despite the use of volume in this study.
Descriptive statistical analyses were used in this study. Specifically, conditional means and their 95% confidence intervals of various attributes including growth dominance are presented for each combination of fertilization treatments and/or shade tolerance and/or years since treatment and/or vegetation series. In addition, a multivariate analysis of variance in the following form was used to present marginal mean growth dominance and its 95% confidence intervals across fertilization treatments and vegetation series, as well as conditional statistics on each combination of the above two factors:
G=fm+vn+fm⋅vn+εmn
where fm and vn are the mean growth dominance of the mth fertilization treatment (m = 1, 2, 3, and 4) and nth vegetation series (n = 1, 2, and 3), respectively, and εmn is the error.
The sample size was not great enough to support another factor of soil parent material in the above analysis (Table 1). Therefore, potential effect of soil parent material on growth dominance was not accounted for in this study.
3.
Results
3.1
Changes in growth dominance
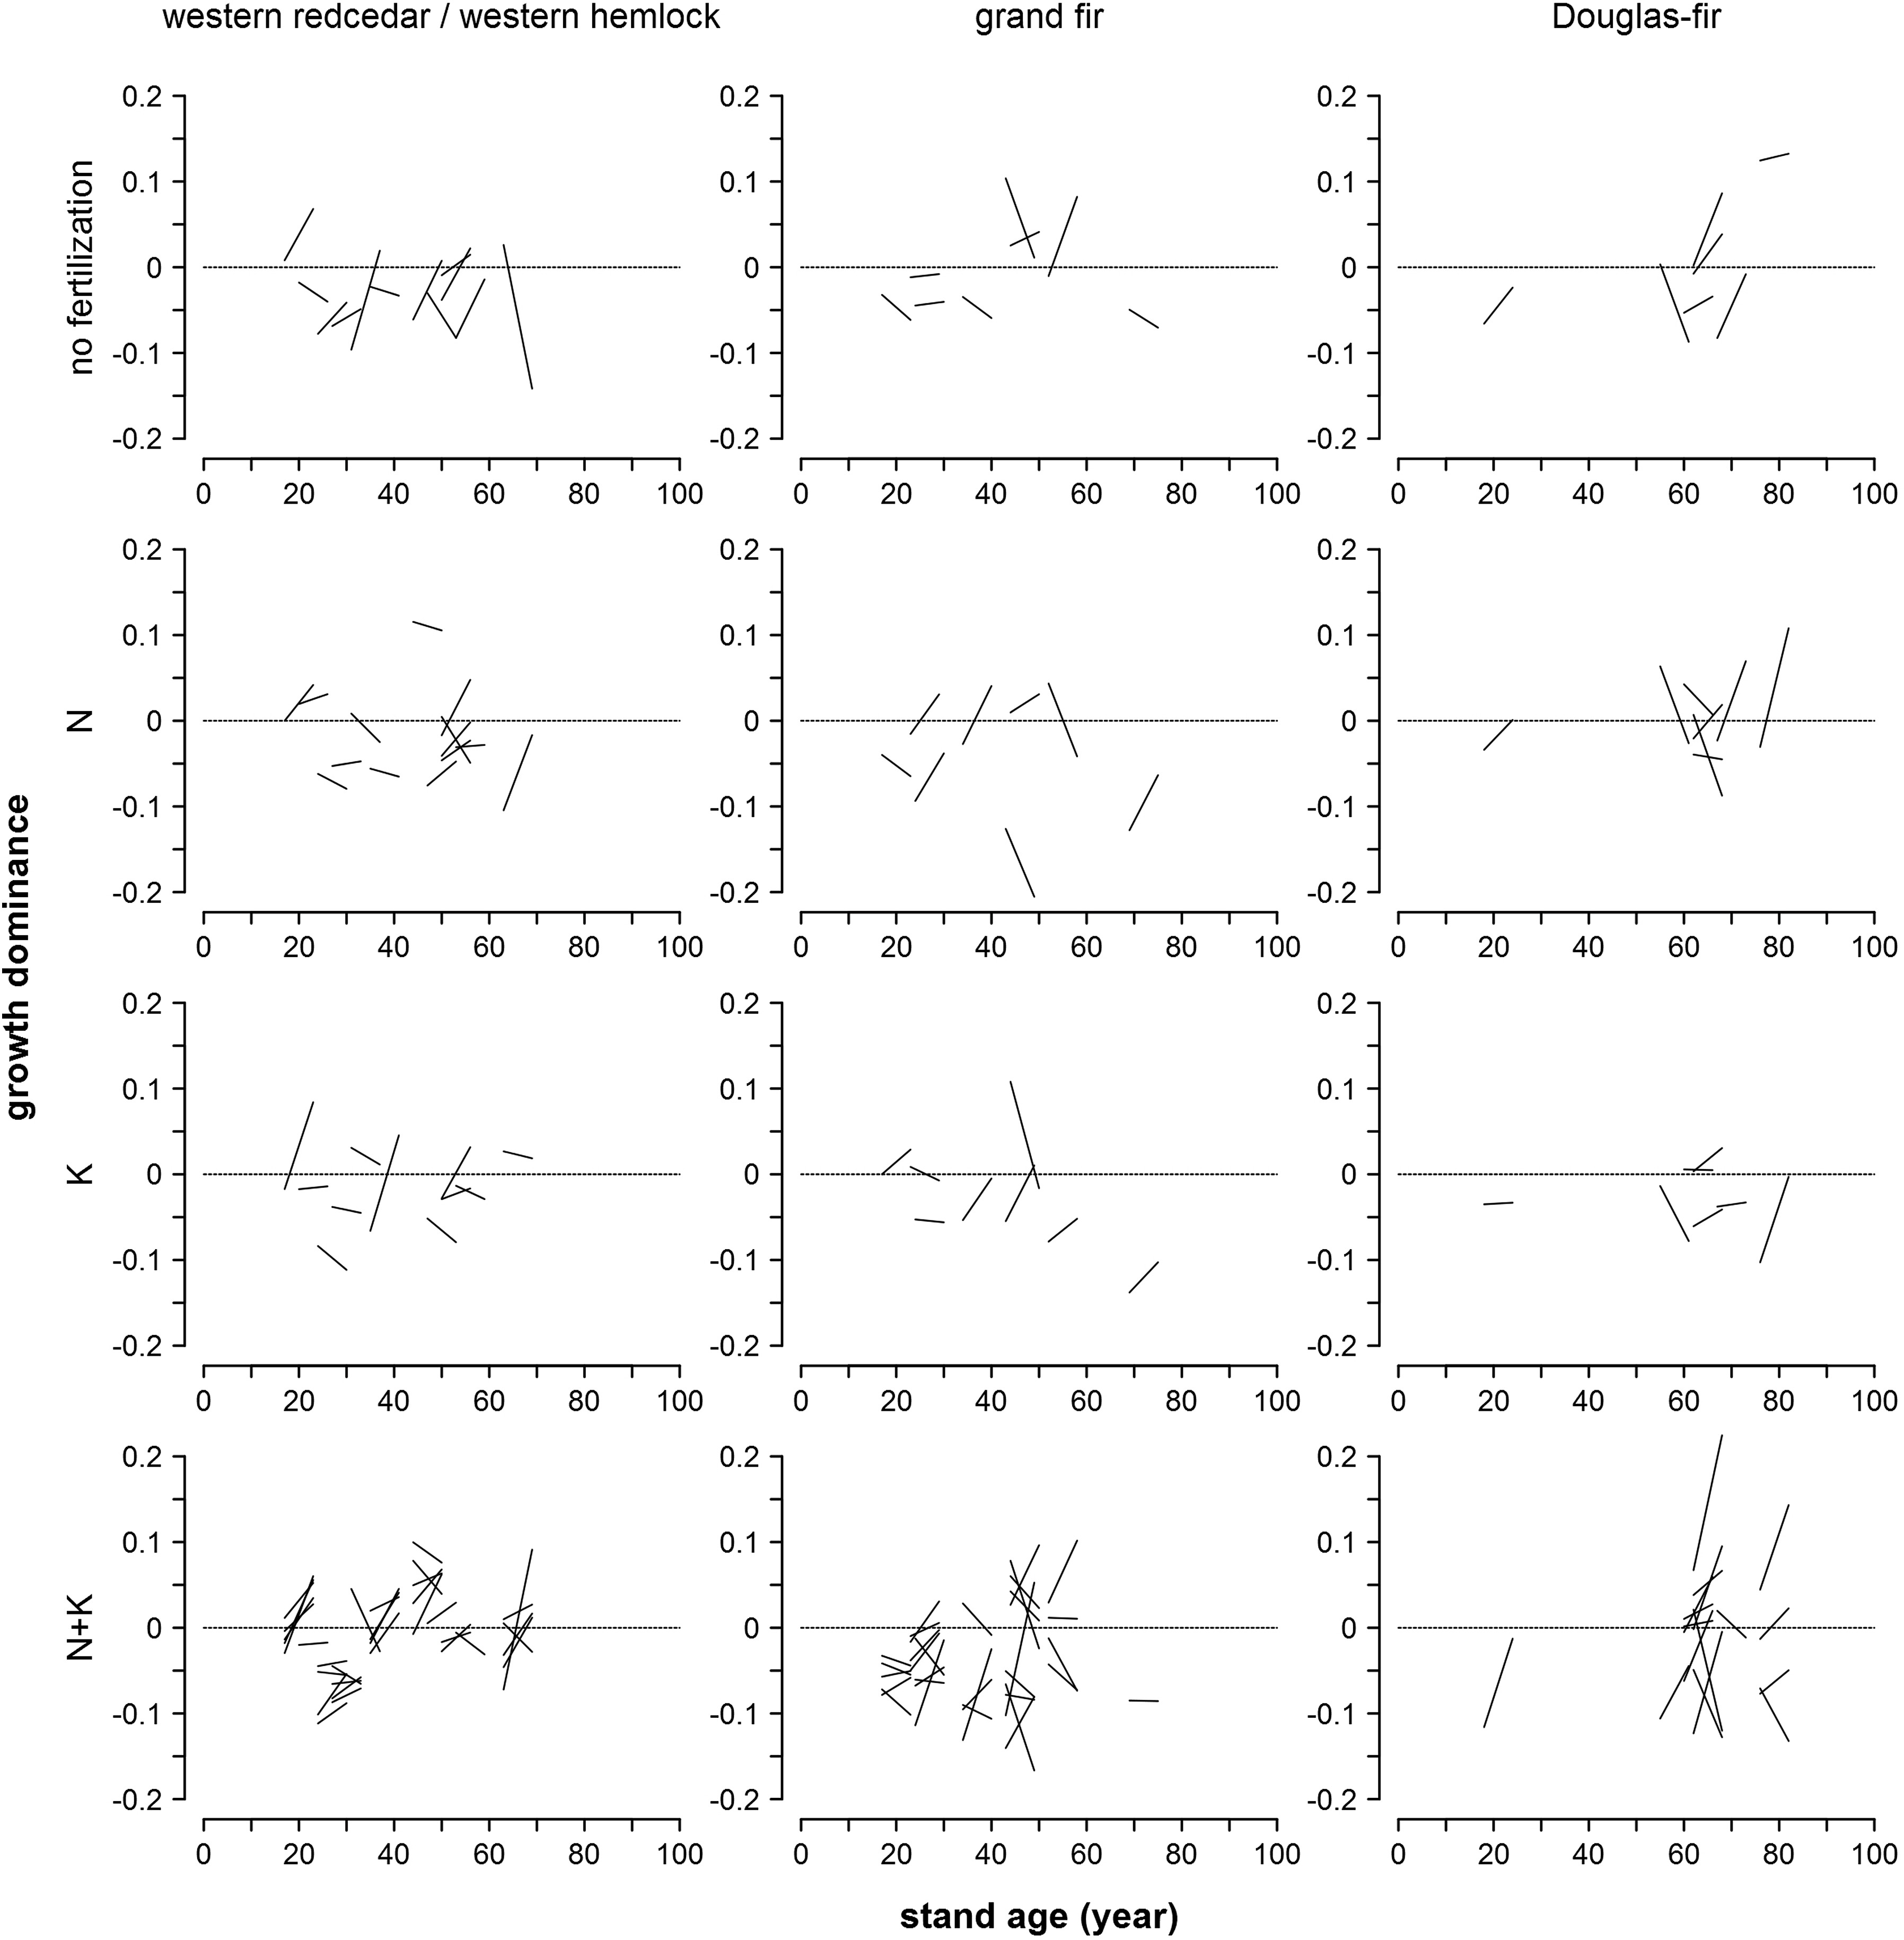
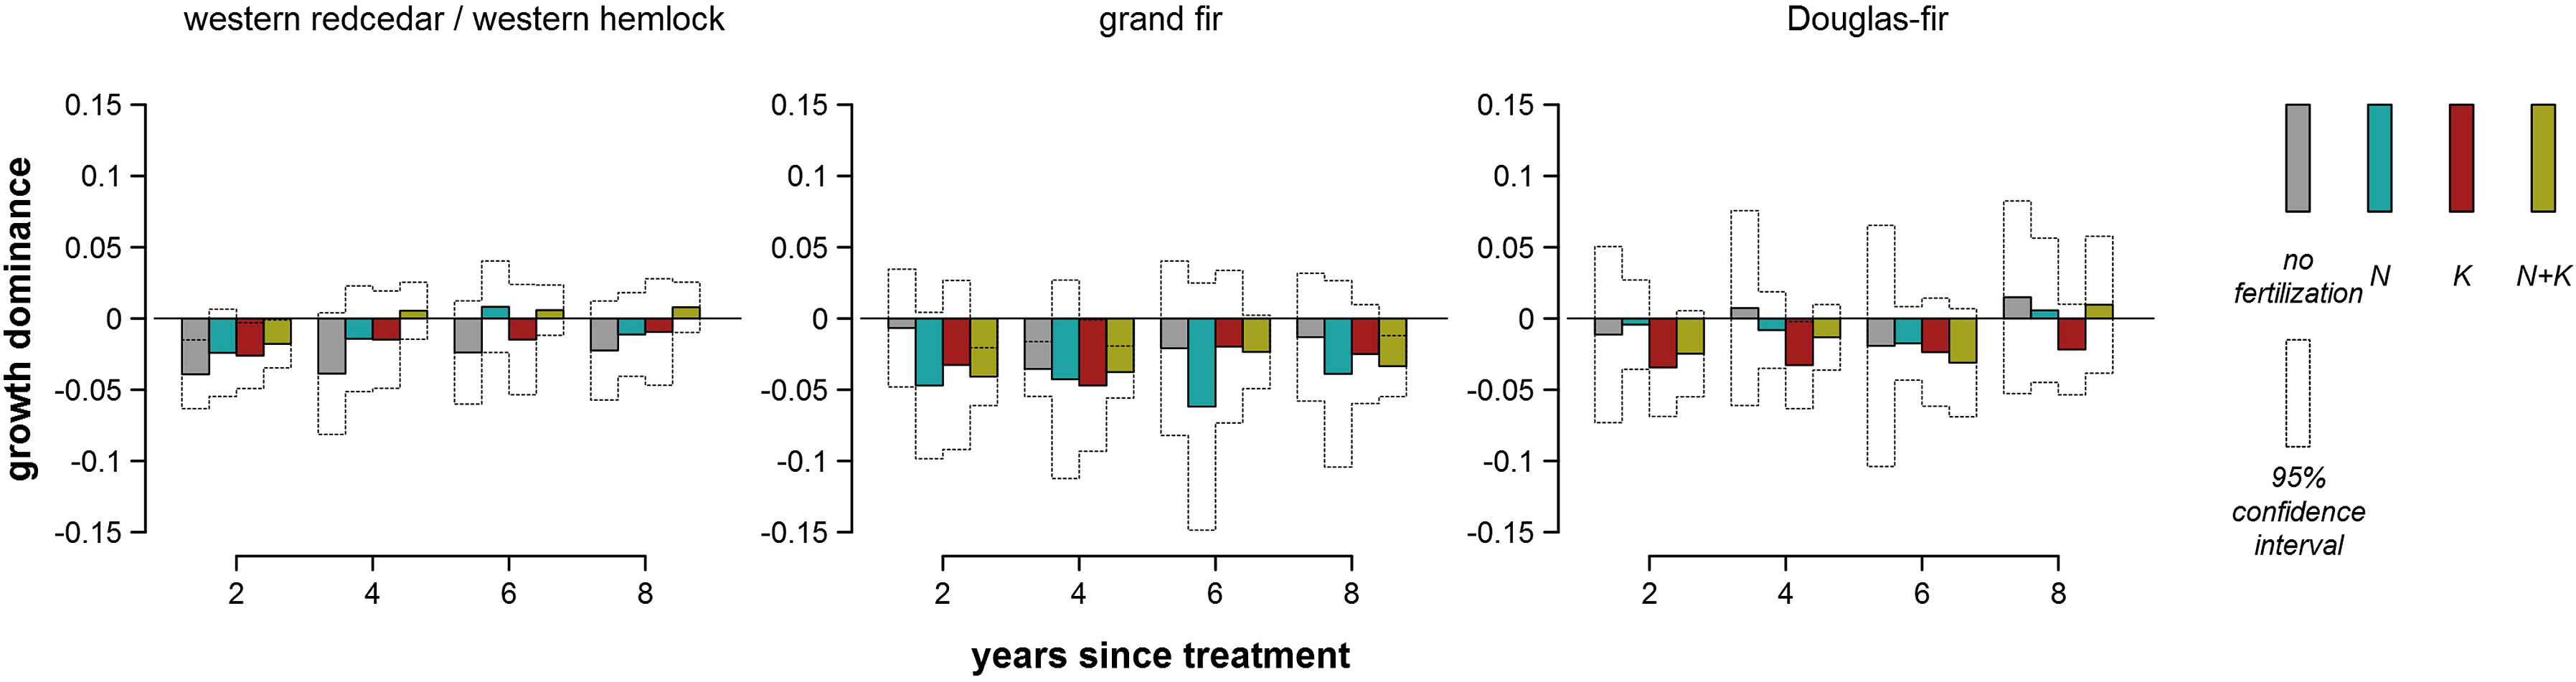
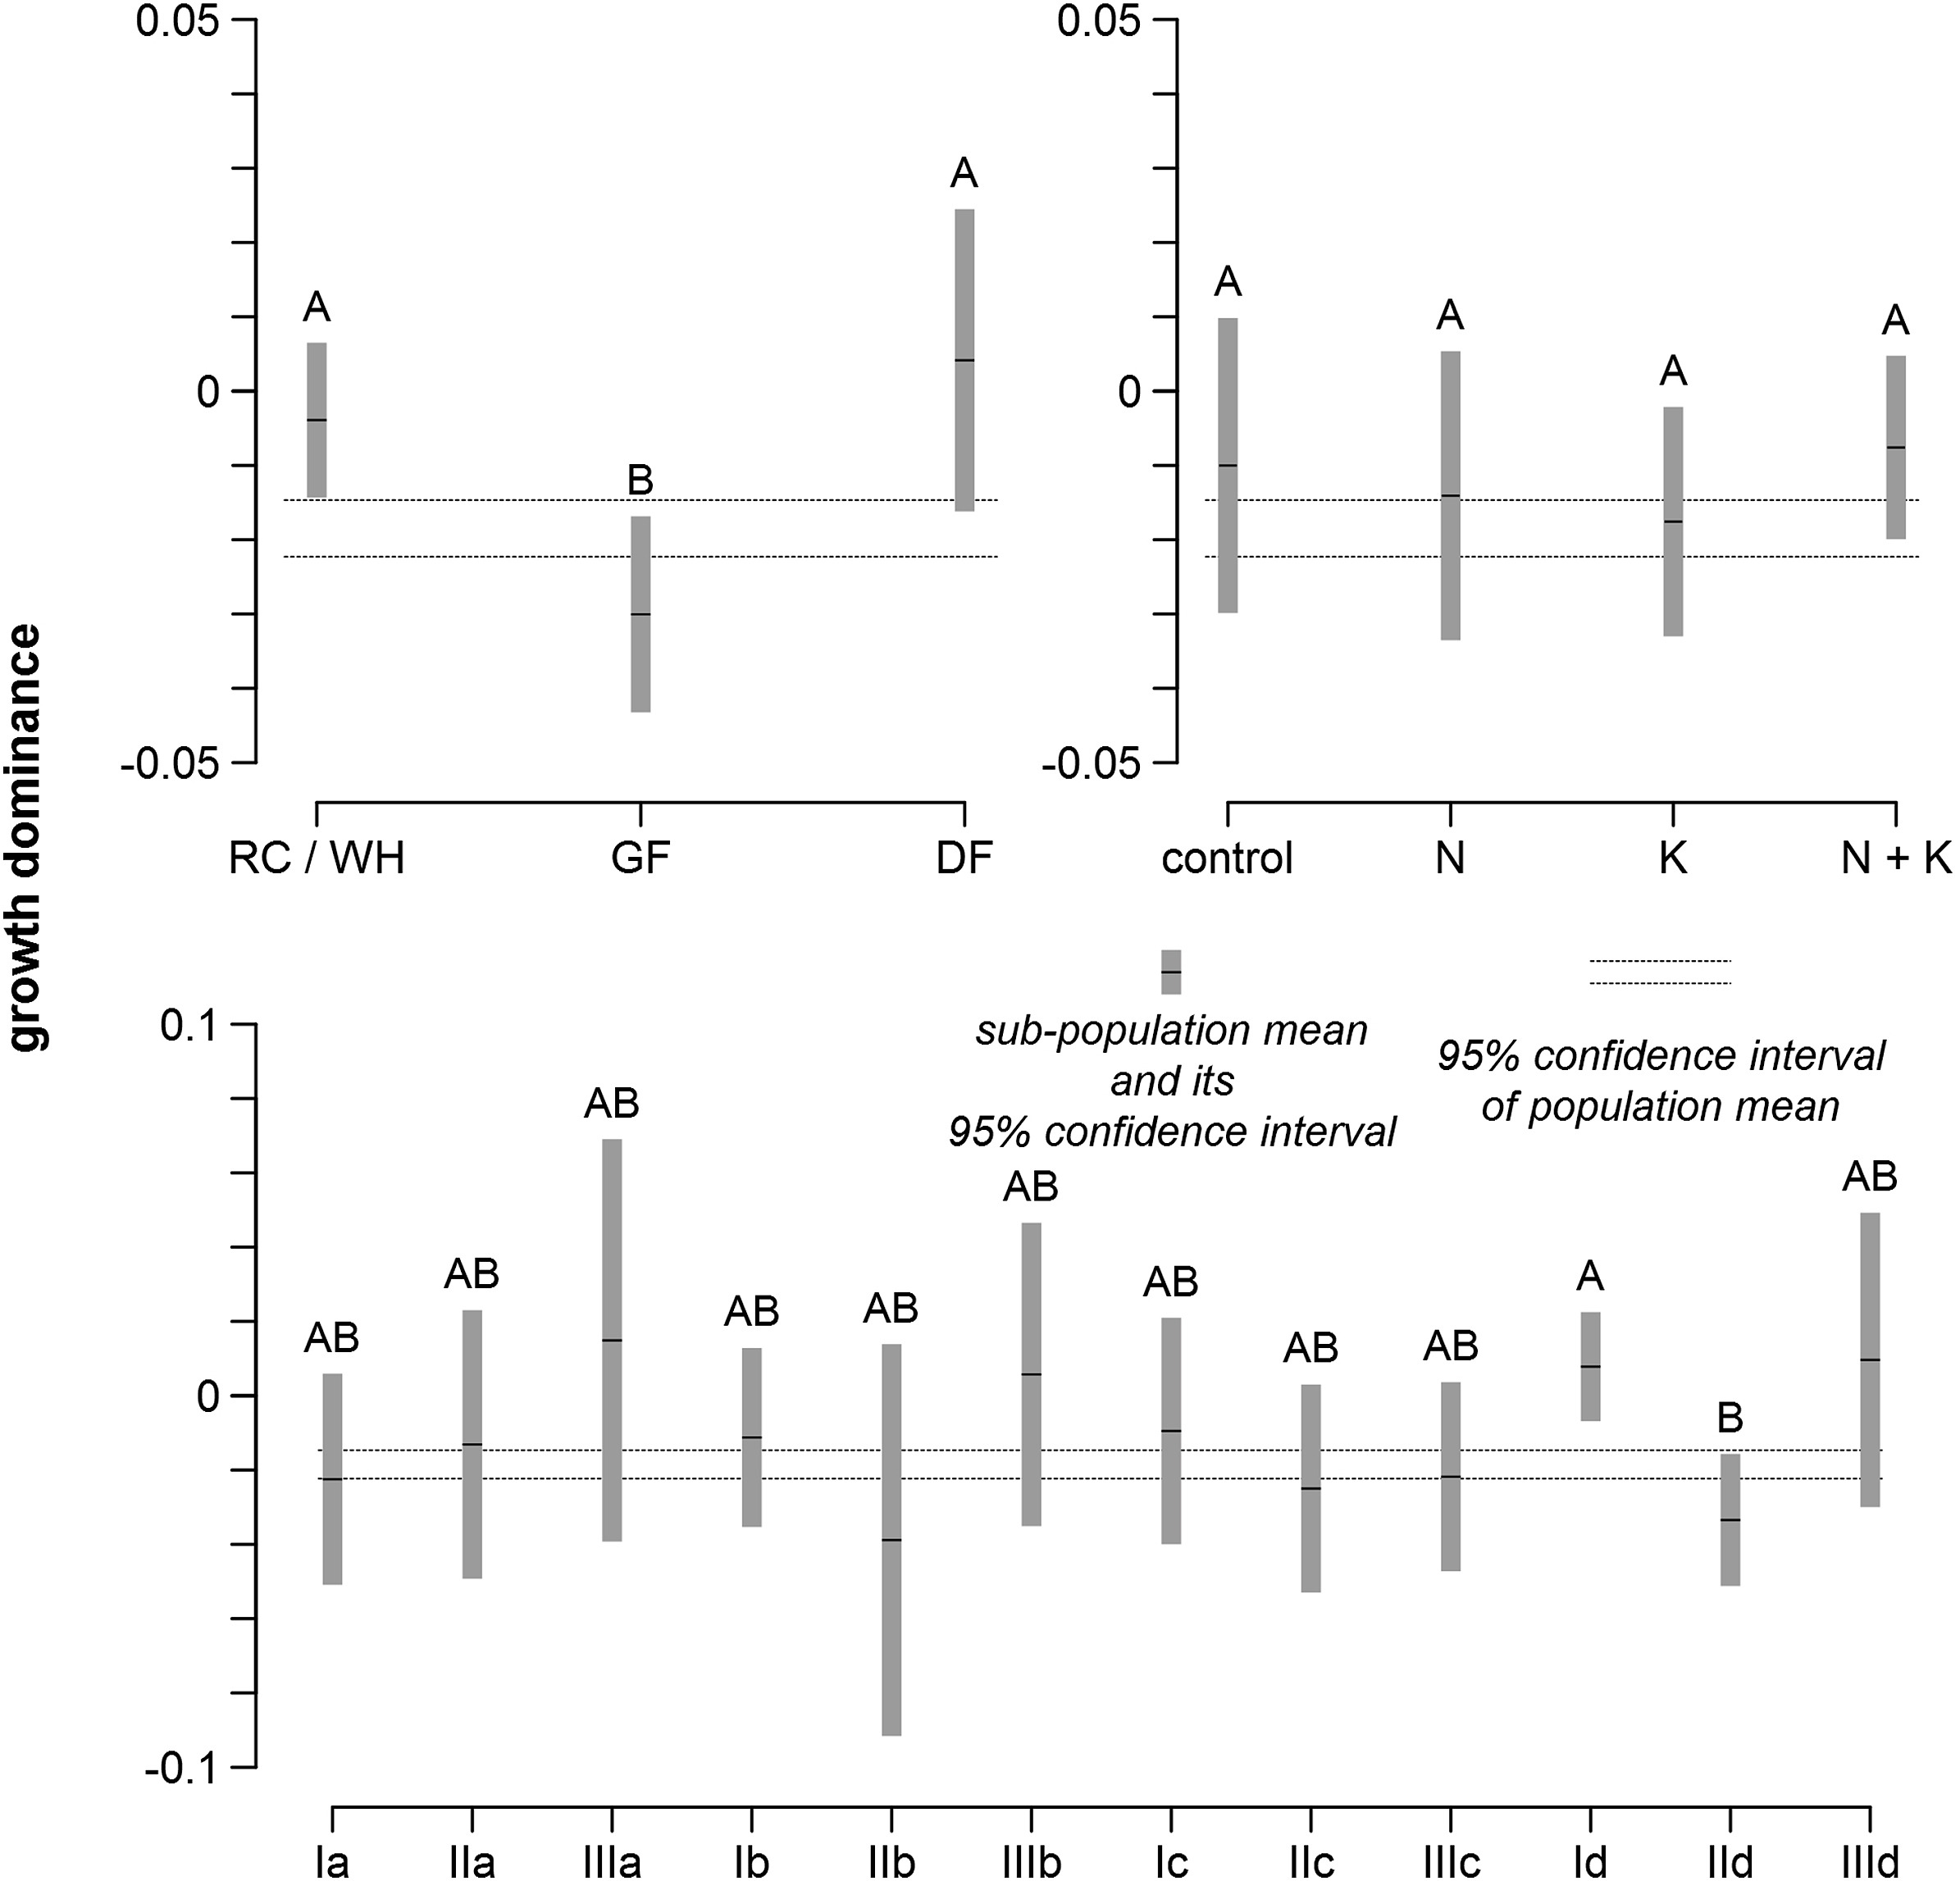
Growth dominance varied considerably across plots in the same vegetation series that received the same fertilization treatment (Fig. 2). Both decreases and increases in growth dominance were observed in each occasion shown in Fig. 2 and appeared not to be related to stand age. Mean growth dominance was at small magnitudes ranging from −0.06 to 0.01 and mostly negative over time and across fertilization treatments (Fig. 3). Most of these statistics, including all of the positive ones, were not significantly different from 0 at the 0.05 significance level (Fig. 3). Multivariate analysis of variance showed that mean growth dominance generally was not significantly separated by vegetation series, fertilization treatments, or their interactions (Fig. 4).
Figure
2.
Observed growth dominance two years and eight years after fertilization treatment (left and right ends of the lines, respectively) at corresponding stand ages by vegetation series and fertilization treatment.
Figure
4.
Observed sub-population mean of growth dominance and its 95% confidence interval in comparison to 95% confidence interval of population mean of growth dominance eight years after treatment. Ⅰ is western redcedar/western hemlock series (RC/WH), Ⅱ is grand fir series (GF), Ⅲ is Douglas-fir series (DF), a is control (no fertilization), b is N only fertilization, c is K only fertilization, and d is N + K fertilization. A and B are significantly different, while AB is not significantly different from either A or B, at the 0.05 significance level.
3.2
Effects of growth and mortality on growth dominance
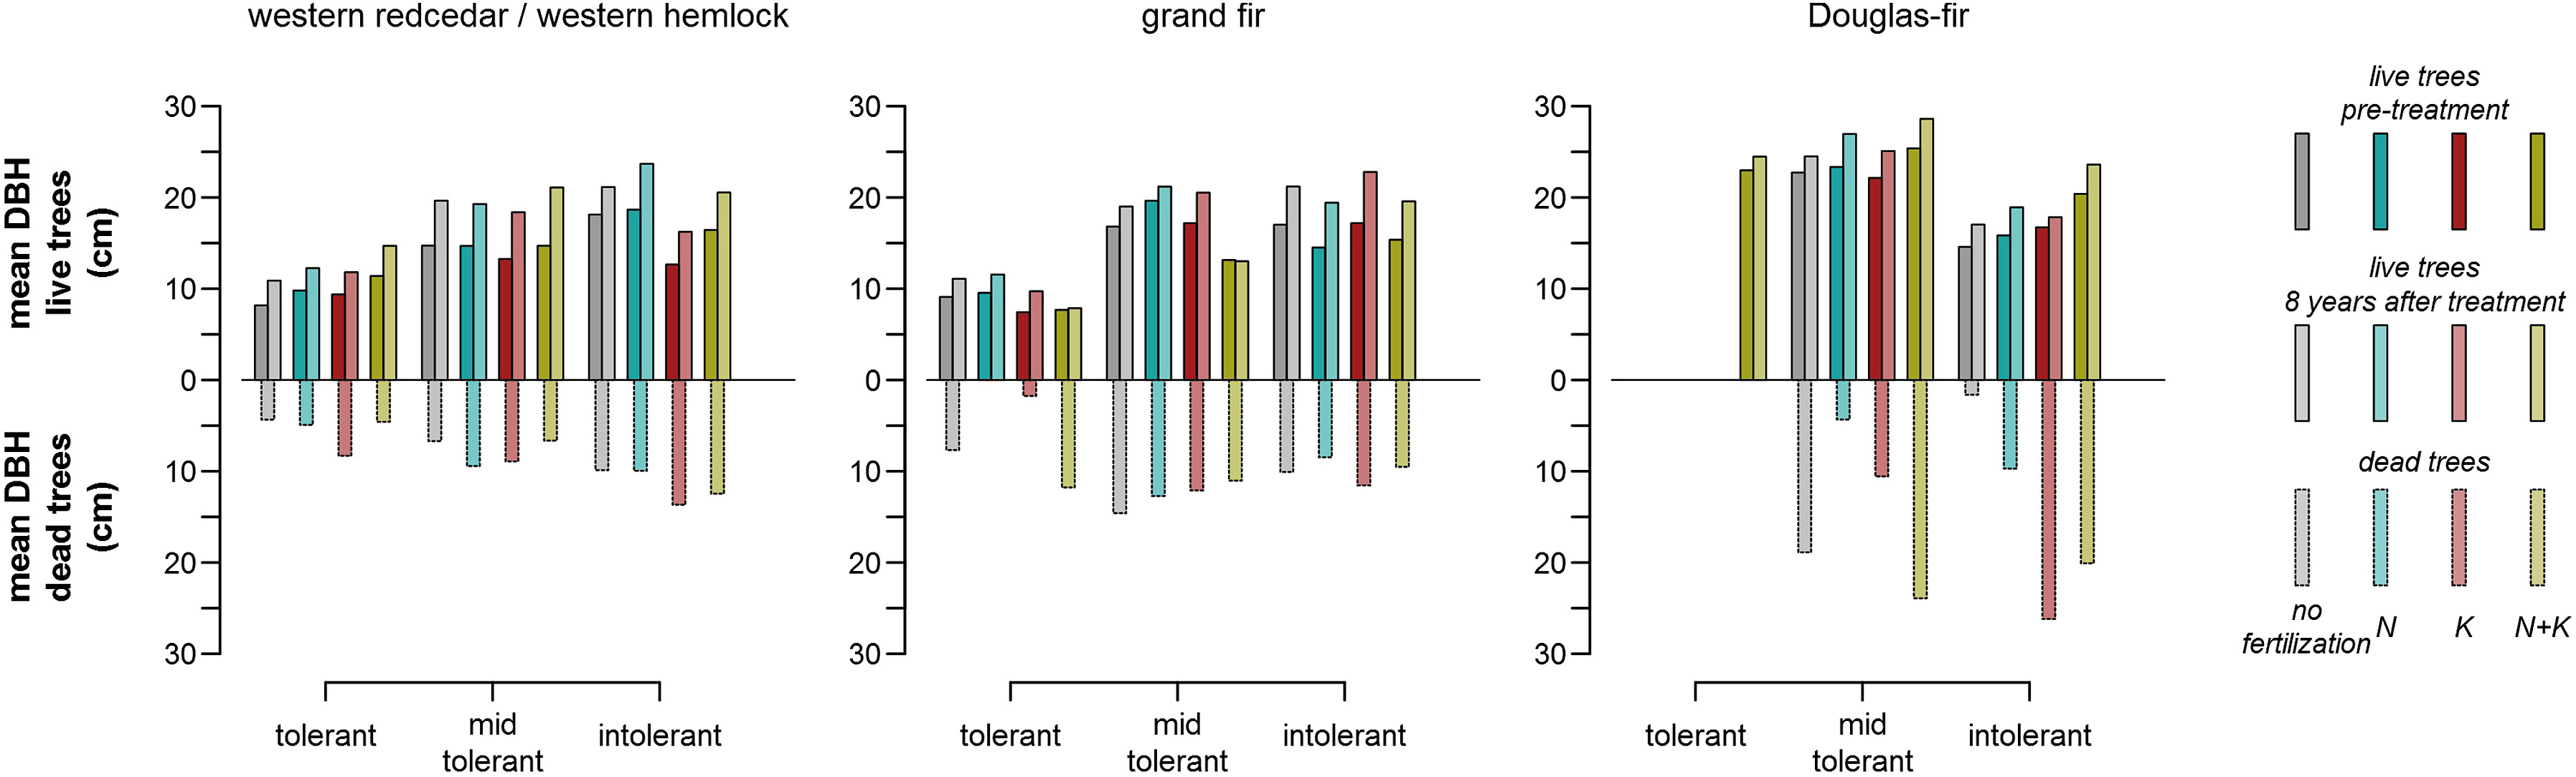
Observations showed that initial DBH was significantly smaller but DBH increments were higher in western redcedar/western hemlock series than in the other vegetation series (Table 3). Both the largest and smallest 25% of trees by volume generally accounted for higher percentages of growth than intermediate trees across fertilization treatments and vegetation series (Table 4), which had a neutralizing effect on growth dominance (Fig. 3). Dead trees were significantly smaller in western redcedar/western hemlock series (5.7 ± 0.3 cm; mean DBH and its 95% confidence interval, where mean DBH is 41% of that of living trees) compared to grand fir (11.0 ± 0.6 cm, where mean DBH is 73% of that of living trees) and Douglas-fir series (17.6 ± 2.1 cm, where mean DBH is 81% of that of living trees; Fig. 5). Mortality of smaller trees resulted in increases in the initially negative growth dominance and simultaneously larger decreases in CV, hence size inequality in western redcedar/western hemlock series compared to the other vegetation series (Table 3, Fig. 3). No clear effect of growth and mortality on growth dominance across fertilization treatments was found.
Table
3.
Pre-treatment and eight years thereafter mean DBH (diameter at 1.37 m above the ground), its 95% confidence interval (in parentheses), and its coefficient of variation (CV) by fertilization treatment and vegetation series.
Table
4.
Observed mean percentages of total stand volume growth in each quartile of stand volume (with first and fourth quartiles being the smallest and largest trees, respectively) by fertilization treatment and vegetation series.
Figure
5.
Observed mean DBH (diameter at 1.37 m above the ground) of living and dead trees by shade tolerance, fertilization treatment, and vegetation series. (For interpretation of the references to colour in this figure legend, the reader is referred to the Web version of this article.)
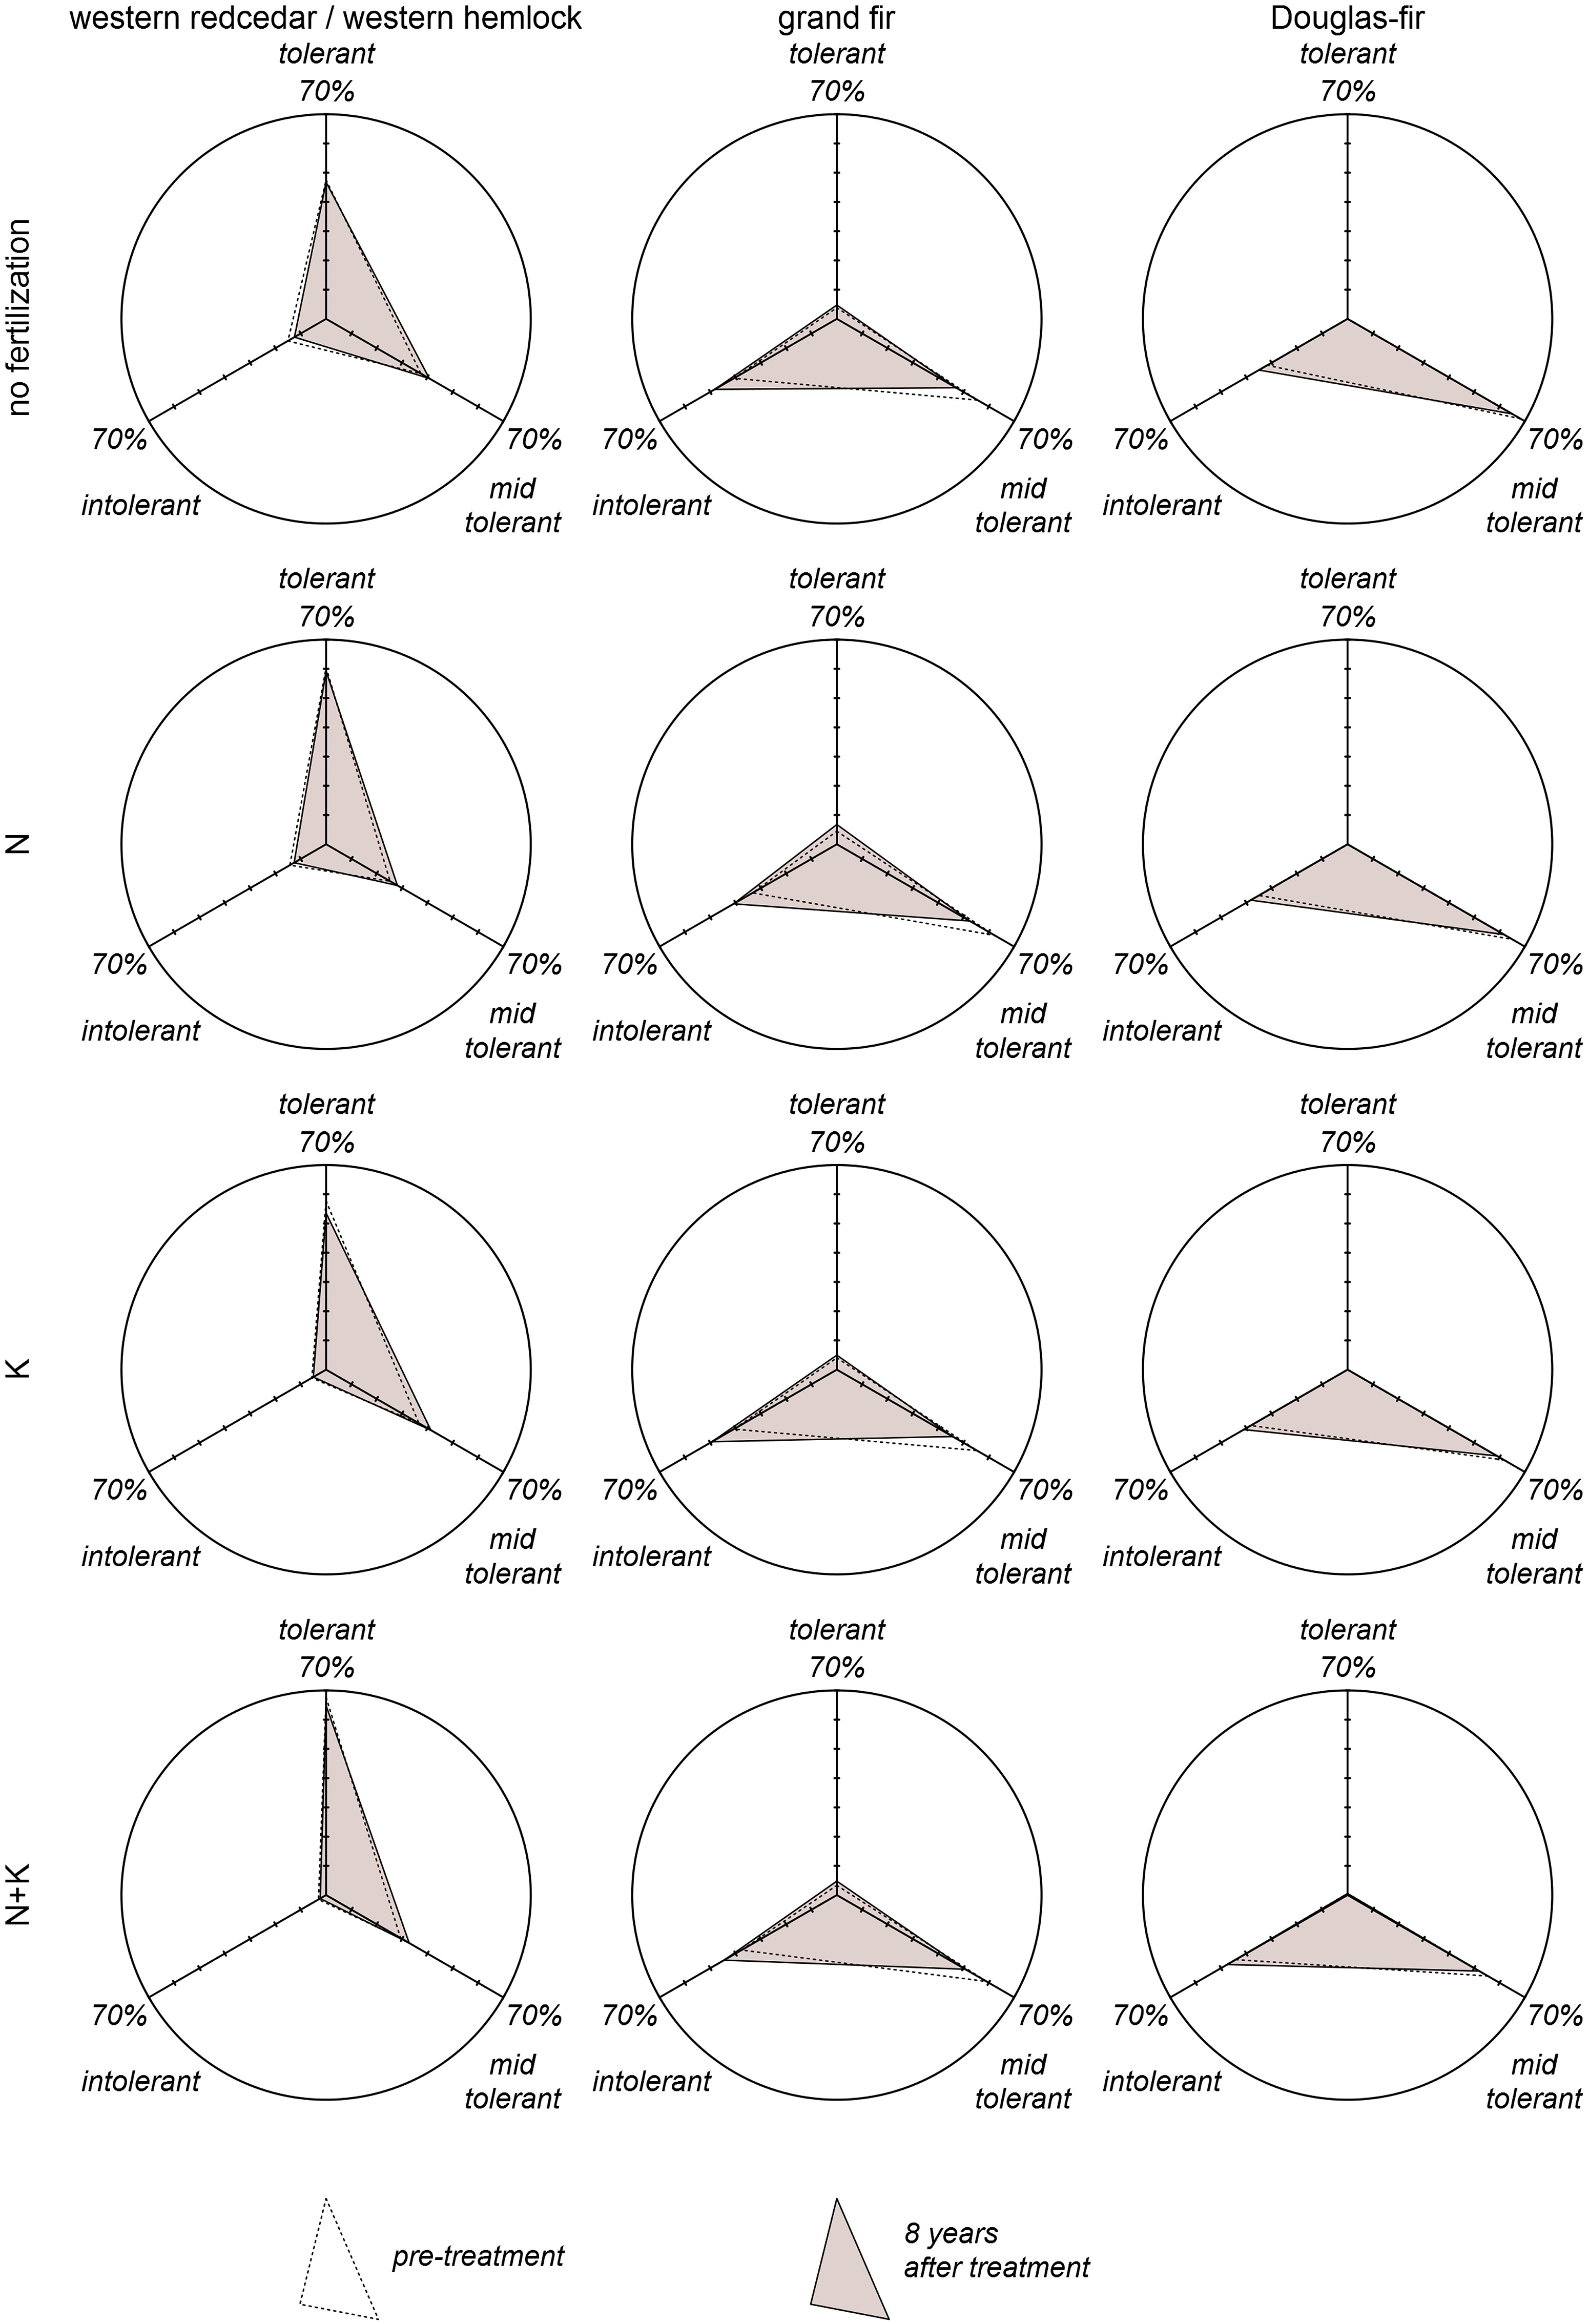
Changes in proportions of trees of varying shade tolerance were highly consistent across fertilization treatments in each vegetation series over the eight-year period (Table 5, Fig. 6). In terms of volume, percentages of shade-tolerant and -intolerant trees decreased with significant increases of mid-tolerant trees ranging from 2.9% to 4.7% over the eight-year period across treatments in western redcedar/western hemlock series (Table 5). In this series, shade-tolerant and -intolerant trees were significantly smaller and larger, respectively, than mid-tolerant trees (Table 6, Fig. 6). Their simultaneous declines neutralized growth dominance. Species composition in grand fir and Douglas-fir series shifted towards shade-intolerant species (volumes increased by 6.9%–8.7% and 2.8%–3.3% across treatments, respectively, over eight years), and most of these changes were significant at the 0.05 significance level (Table 5, Fig. 6). Intolerant species were significantly larger and faster-growing than the others in grand fir series, but the potential positive effect on growth dominance was offset by larger dead trees of tolerant and mid-tolerant species (Table 6, Fig. 6). Intolerant species were significantly smaller but grew faster than the others in Douglas-fir series, but the consequent decreasing effect on growth dominance was countered by mortality of smaller trees of the larger mid-tolerant species (Table 6, Fig. 6).
Table
5.
Mean changes in percentages of varying shade tolerance trees in volume and the ranges of 95% confidence intervals over the eight-year period by fertilization treatment and vegetation series.
Treatment
Western redcedar/Western hemlock
Grand fir
Douglas-fir
Tolerant (%)
Mid-tolerant (%)
Intolerant (%)
Tolerant (%)
Mid-tolerant (%)
Intolerant (%)
Tolerant (%)
Mid-tolerant (%)
Intolerant (%)
Control
‒0.7 ± 2.1a
3.3 ± 2.5
‒2.6 ± 0.7
0.9 ± 0.7
‒8.5 ± 1.2
7.6 ± 1.6
0.0 ± 0.0
‒3.3 ± 1.5
3.3 ± 1.5
N
‒1.2 ± 1.3a
2.9 ± 0.9
‒1.7 ± 1.1
2.3 ± 4.8a
‒9.8 ± 4.5
7.5 ± 3.1
0.0 ± 0.0
‒3.3 ± 1.2
3.3 ± 1.2
K
‒4.1 ± 2.2
4.7 ± 2.9
‒0.6 ± 2.1a
0.9 ± 0.8
‒9.6 ± 2.7
8.7 ± 2.9
0.0 ± 0.0
‒2.8 ± 3.1a
2.8 ± 3.1a
N + K
‒2.8 ± 1.0
3.4 ± 1.0
‒0.7 ± 0.6
1.4 ± 1.6a
‒8.4 ± 2.2
6.9 ± 2.1
0.0 ± 0.0
‒3.4 ± 1.7
3.3 ± 1.7
a Changes not significantly different from 0 at the 0.05 significance level.
Figure
6.
Observed mean percentages of varying shade tolerance trees by volume pre-treatment and eight years after treatment by fertilization treatment and vegetation series.
Table
6.
Observed mean DBH (diameter at 1.37 m above the ground) and its 95% confidence interval (in parentheses) of living and dead trees by shade tolerance and vegetation series.
The lack of a clear pattern in growth dominance found in this study does not agree with the hypothesis of Binkley (2004), who suggested that positive growth dominance occurs between canopy closure and old growth. The initially 15–74 years old stands in this study were expected to exhibit strong positive growth dominance as that reported in the mixed stands in coastal Oregon (Binkley, 2004). Pronounced increases in growth dominance following fertilization and vegetation control have been reported in loblolly pine (Pinus taeda L.) stands in Florida (Martin and Jokela, 2004). However, Tschieder et al. (2012) inferred that growth dominance should decrease in fertilized and irrigated young loblolly pine stands because the size-related differences in relative growth were diminished by higher resource availability for small trees.
The two types of young stands evaluated in Binkley et al. (2006) that were intended to support the hypothesis of Binkley (2004) also did not show significant positive growth dominance. Binkley et al. (2006) speculated that photosynthates shared through grafted roots of lodgepole pine and among ramets of aspen (Populus tremuloides Michx.) clones moderated potentially significant growth dominance. Natural root grafts occur in many tree species including most of those in this study (Graham and Bormann, 1966). If this was a driving factor, it could be a cause of the lack of growth dominance observed in this study.
The mixed species composition of the stands in this study may have also played a role in the lack of growth dominance. Growth dominance was found to be approximately 0 in pure aspen stands but negative in mixed aspen stands (Binkley et al., 2006). This disparity likely was related to the understory conifers in mixed stands that kept high relative growth rates because of improved light interception and/or use efficiency (Binkley et al., 2006). Similarly in this study, shade-tolerant species generally started in lower crown positions with initial mean height at 8.8 m, while initial mean height for other species was 11.1 m. Shade-tolerant species remained in lower crown positions over the eight-year study period, and their relative growth apparently kept pace with large trees (Table 6, Fig. 5). This may be a result of the large pine trees typically having clumped foliage arrangements that allow increased light to reach lower strata trees (Stenberg et al., 1994).
There may be species-specific disparities in developing growth dominance. For example, growth dominance was absent in lodgepole pine stands but accentuated in Eucalyptus saligna stands both across a wide range of stand ages (Binkley et al., 2006; Doi et al., 2010). McGown et al. (2015) found practically no growth dominance over a 35-year period in initially 40–70 years old ponderosa pine stands. Tschieder et al. (2012) concluded that competition generally is symmetrical in pine stands based on 21 years of observations on initially five years old loblolly pine stands, which resulted in null growth dominance.
The abilities of species to develop growth dominance may also interact with site quality. The relatively small mid-tolerant Douglas-fir established growth dominance with increased proportions of stand volumes in moist western redcedar/western hemlock series but did not gain competitive advantages against intolerant pines in dry grand fir and Douglas-fir series (Table 6, Fig. 6).
The phase of increasing growth dominance by large trees proposed by Binkley (2004) may apply to situations where light is the most limiting resource in tree growth, and large trees capture an increasingly larger proportion of light than small trees (Weiner, 1990). Consequently, growth of large trees is sustained and accounts for an increasingly larger proportion of stand growth at the cost of the suppressed growth of small trees. This disproportionate growth of large trees will result in commensurate increases in transpiration and moisture demand (Maggard et al., 2017), but trees' abilities to compete for moisture are considered proportional to their sizes (Lieffers and Titus, 1989; Weiner et al., 1997). In situations of limited moisture availability as may occur in grand fir and Douglas-fir series in this study, large trees would face relatively as much moisture deficiency as small trees, which would hamper the development of disproportionately large crowns and improved light interception. Competition for nutrients also is size-symmetric (Weiner et al., 1997). The alleviation of nutrient deficiency by fertilization generally did not improve growth dominance, especially in dry grand fir and Douglas-fir series. This may be related to large trees unable to utilize nutrients in soil following canopy closure that likely has occurred in many stands in this study. Another possible cause may be the limiting role of soil moisture on mineralization of soil organic matter, release of nutrients, and nutrient transport in the soil-plant continuum (Cole et al., 1990). Positive growth responses to fertilization in this region reported by Shafii et al. (1989) and Moore et al. (1991) may be in part attributed to variations in soil moisture, which was not investigated at these study sites (Chen et al., in preparation).
Increased mortality following fertilization in Inland Northwest has been reported (e.g., Shen et al., 2001), although this mortality occurs more often among small trees mainly because improved stand growth following fertilization intensifies self-thinning (Barclay and Brix, 1985; Elfving, 2010). As a result, tree size distribution narrowed (CV decreased) following fertilization especially in western redcedar/western hemlock series of relatively high initial density (Table 3). Mortality was noticeably present among relatively large trees and more evenly distributed across size classes in dry grand fir and Douglas-fir series. This may be related to large trees facing similar moisture deficiency in the size-symmetric competition with small trees (Table 6, Fig. 5; Weiner et al., 1997) and result in reduced tapering of DBH distribution of remaining trees. Consequently, CV of DBH showed more decreases in western redcedar/western hemlock series than in the other series (Table 3). This observed pattern in CV followed its general trend during stand development (McGown et al., 2015), but Harrington and Devine (2011) found that fertilization broadened tree size distribution in western redcedar dominated stands. Harrington and Devine (2011) considered the cause to be the greatly improved growth of dominant trees and some small redcedar trees having survived the intensified competition but had stagnated growth. Both of these effects were not observed in this study.
Growth dominance does not only result from changes in relative growth of various-sized trees (Binkley et al., 2006). Since it is a statistic computed on survivor trees over a period (e.g., West, 2014), mortality during this period directly affects growth dominance. For example, in a stand where large trees have initial growth dominance (i.e., account for a larger proportion of growth than volume), the death of a large tree will remove relatively more growth than volume and hence reduce the growth dominance of large trees. The lack of positive growth dominance in grand fir and Douglas-fir series may partly result from mortality observed among relatively large trees. This pattern occurred across all treatments including the control.
The minuscule and not significant growth dominance may also be a result of the distribution of growth. It clearly differed between large and small trees in some previous studies (e.g., Martin and Jokela, 2004; Fernández et al., 2011), but both the largest and smallest 25% trees generally accounted for ≥25% of stand growth in this study (Table 4), which had a neutralizing effect on growth dominance. This pattern was consistent across fertilization treatments and vegetation series where site quality and stand age clearly differed. Improved nutrient availability may not be the sole cause since this pattern also was observed in unfertilized plots (Tschieder et al., 2012). Species-specific potentials in developing growth dominance and limited moisture availability may also be contributing factors.
The metric of growth dominance has been considered a useful tool to quantitatively assess the effectiveness of silvicultural treatments such as thinning (Bradford et al., 2010; Keyser, 2012). It was found that thinning eased competition and favored growth of small trees rather than large trees, although the goal of thinning often is to concentrate growth on large crop trees (Nyland, 2016). The general effect of fertilization found in this study is similar to that of thinning. The largely negative growth dominance across fertilization treatments indicates that small trees seem to have maintained higher relative growth rates than large trees, even if absolute growth was higher among large trees. In the case where fertilization does improve stand growth, a significant part of this improved growth will be lost in density-dependent mortality over time if not captured through thinning/harvesting.
A caveat is that growth dominance found in this study and some previous studies (e.g., Binkley et al., 2006; Bradford et al., 2010; Tschieder et al., 2012; McGown et al., 2015) is of very small magnitudes. Growth dominance is computed based on volume, biomass, or other dimensions of trees, which generally are not directly measurable and are predicted using various empirical models. The minuscule growth dominance, whether positive or negative, likely falls within the uncertainties of these models, and may not be able to provide quantitative and even qualitative information to assess the efficacy of silvicultural treatments as proposed by Bradford et al. (2010). In the case of patterns existing in these uncertainties across, e.g., stand structure, composition, and site quality, growth dominance statistics may also be biased according to these patterns, and silvicultural prescriptions based on growth dominance statistics may be misguided. Finally, growth dominance may be evaluated with improved accuracy using data from large sample plots. Otherwise, growth dominance may be overly affected by rare mortality observations. The relatively small plots with an average of ~30 trees likely caused growth dominance to vary in wide ranges across plots in this study.
Ethics approval and consent to participate
Not applicable.
Consent for publication
Not applicable.
Availability of data and materials
Data are available upon requests sent to cen.chen@maine.edu.
Competing interests
The authors declare that they have no competing interests.
Authors' contributions
Conceptualization: AN; Methodology: AN, CC; Software: CC; Validation: CC; Formal Analysis: CC; Investigation: CC; Resources: AN, MK, TS; Data curation: TS; Writing - original draft: CC; Writing - review & editing: AN, CC, MK, TS; Visualization: CC; Supervision: AN; Project Administration: AN; Funding acquisition: AN, MK.
Declaration of competing interest
The authors declare that they have no known competing financial interests or personal relationships that could have appeared to influence the work reported in this paper.
Acknowledgements
We thank Mark Coleman of the University of Idaho for providing feedback to an early draft of this paper.
Barclay, H.J., Brix, H., 1985. Effects of high levels of fertilization with urea on growth of thinned and unthinned Douglas-fir stands. Can. J. For. Res. 15(4), 730-733.
[2]
Binkley, D., 2004. A hypothesis about the interaction of tree dominance and stand production through stand development. For. Ecol. Manag. 190(2), 265-271.
[3]
Binkley, D., Kashian, D.M., Boyden, S., Kaye, M.W., Bradford, J.B., Arthur, M.A., Fornwalt, P.J., Ryan, M.G., 2006. Patterns of growth dominance in forests of the Rocky Mountains, USA. For. Ecol. Manag. 236(2-3), 193-201.
[4]
Bradford, J.B., D'Amato, A.W., Palik, B.J., Fraver, S., 2010. A new method for evaluating forest thinning: growth dominance in managed Pinus resinosa stands. Can. J. For. Res. 40(5), 843-849.
[5]
Chen, C., Nelson, A.S., Shaw, T., Kimsey, M. In preparation. Effects of Fertilization on the Growth and Mortality of Inland Northwest Forests of the United States.
[6]
Cole, D.W., Ford, E.D., Turner, J., 1990. Nutrients, moisture and productivity of established forests. For. Ecol. Manag. 30(1-4), 283-299.
[7]
Coleman, M.D., Shaw, T.M., Kimsey, M.J., Moore, J.A., 2014. Nutrition of Douglas-fir in the Inland Northwest. Soil Sci. Soc. Am. J. 78(S1), S11-S22.
[8]
Cooper, S.V., Neiman, K.E., Roberts, D.W., 1991. Forest habitat types of Northern Idaho: a second approximation. U.S. Department of Agriculture, Forest Service, Intermountain Research Station. General Technical Report INT-236. Ogden, UT.
[9]
Doi, B.T., Binkley, D., Stape, J.L., 2010. Does reverse growth dominance develop in old plantations of Eucalyptus saligna? For. Ecol. Manag. 259(9), 1815-1818.
[10]
Elfving, B., 2010. Natural mortality in thinning and fertilisation experiments with pine and spruce in Sweden. For. Ecol. Manag. 260(3), 353-360.
[11]
Filip, G.M., Ganio, L.M., Oester, P.T., Mason, R.R., Wickman, B.E., 2002. Ten-year effect of fertilization on tree growth and mortality associated with Armillaria root disease, fir engravers, dwarf mistletoe, and western spruce budworm in northeastern Oregon. West. J. Appl. For. 17(3), 122-128.
[12]
Fox, T.R., Lee Allen, H., Albaugh, T.J., Rubilar, R., Carlson, C.A., 2007. Tree nutrition and forest fertilization of pine plantations in the southern United States. South. J. Appl. Finance 31(1), 5-11.
[13]
Gessel, S.P., Miller, R.E., Cole, D.W., 1990. Relative importance of water and nutrients on the growth of coast Douglas fir in the Pacific Northwest. For. Ecol. Manag. 30(1-4), 327-340.
Harrington, C.A., Devine, W.D., 2011. Stand development following precommercial thinning and fertilization treatments in a western redcedar (Thuja plicata) dominated forest. Can. J. For. Res. 41(1), 151-164.
[16]
Jain, T.B., Graham, R.T., 2015. Restoring dry and moist forests of the inland northwestern United States, in: Stanturf, J.A. (Ed. ) Restoration of boreal and temperate forests, 2nd Edition. CRC Press, New York, NY.
[17]
Keyser, C.E., 2008 (revised June 16, 2015). Inland Empire (IE) variant overview - Forest Vegetation Simulator. U.S. Department of Agriculture, Forest Service, Forest Management Service Center. Internal Report. Fort Collins, CO.
[18]
Keyser, T.L., 2012. Patterns of growth dominance in thinned yellow-poplar stands in the southern Appalachian Mountains, USA. Can. J. For. Res. 42(2), 406-412.
[19]
Lieffers, V.J., Titus, S.J., 1989. The effects of stem density and nutrient status on size inequality and resource allocation in lodgepole pine and white spruce seedlings. Can. J. Bot. 67(10), 2900-2903.
[20]
Maggard, A.O., Will, R.E., Wilson, D.S., Meek, C.R., Vogel, J.G., 2017. Fertilization can compensate for decreased water availability by increasing the efficiency of stem volume production per unit of leaf area for loblolly pine (Pinus taeda) stands. Can. J. For. Res. 47(4), 445-457.
[21]
Mandzak, J.M., Moore, J.A., 1994. The role of nutrition in the health of Inland Western forests. J. Sust. For. 2(1-2), 191-210.
[22]
Martin, T.A., Jokela, E.J., 2004. Stand development and production dynamics of loblolly pine under a range of cultural treatments in north-central Florida USA. For. Ecol. Manag. 192(1), 39-58.
[23]
McDowell, N., Pockman, W.T., Allen, C.D., Breshears, D.D., Cobb, N., Kolb, T., Plaut, J., Sperry, J., West, A., Williams, D.G., Yepez, E.A., 2008. Mechanisms of plant survival and mortality during drought: why do some plants survive while others succumb to drought? New Phytol. 178(4), 719-739.
[24]
McGown, K.I., O'Hara, K.L., and Youngblood, A., 2015. Patterns of size variation over time in ponderosa pine stands established at different initial densities. Can. J. For. Res. 46(1), 101-113.
[25]
Moore, J.A., Mika, P.G., Vander Ploeg, J.L. 1991. Nitrogen fertilizer response of Rocky Mountain Douglas-fir by geographic area across the Inland Northwest. West. J. Appl. Finance 6(4), 94-98.
[26]
Newton, P.F., Amponsah, I.G., 2006. Systematic review of short-term growth responses of semi-mature black spruce and jack pine stands to nitrogen-based fertilization treatments. For. Ecol. Manag. 237(1-3), 1-14.
[27]
Niinemets, Ü., Valladares, F., 2006. Tolerance to shade, drought, and waterlogging of temperate northern hemisphere trees and shrubs. Ecol. Monogr. 76(4), 521-547.
[28]
Nyland, R.D., 2016. Silviculture: concepts and applications (3rd edition). Waveland Press, Long Grove, IL.
[29]
Perry, D.A., 1985. The competition process in forest stands, in: Cannell, M.G.R. and Jackson, J.E. (Eds. ) Attributes of Trees as Crop Plants. Institute of Terrestrial Ecology, Abbots Ripton, UK.
[30]
Rothstein, D., 2018. Effect of fertilization on growth and mortality of jack pine growing on poor, sandy soils in Michigan, USA: implications for sustainable management. Forests 9, 549.
[31]
Runyon, J., Waring, R.H., Goward, S.N., Welles, J.M., 1994. Environmental limits on net primary production and light-use efficiency across the Oregon transect. Ecol. Appl. 4(2), 226-237.
[32]
Ryan, M.G., Binkley, D., Fownes, J.H., 1997. Age-related decline in forest productivity: pattern and process. Adv. Ecol. Res. 27, 213-262.
[33]
Schwinning, S., Weiner, J., 1998. Mechanisms determining the degree of size asymmetry in competition among plants. Oecologia 113(4), 447-455.
[34]
Shafii, B., Moore, J.A., Olson, J.R., 1989. Effects of nitrogen fertilization on growth of grand fir and Douglas-fir stands in northern Idaho. West. J. Appl. Finance 4(2), 54-57.
[35]
Shaw, T., Coleman, M., Kimsey, M., Mika, P., 2014. Forest health and nutrition study ten-year growth, mortality and foliar nutrition. University of Idaho, Intermountain Forest Tree Nutrition Cooperative. Technical Document. Moscow, ID.
[36]
Shen, G., Moore, J.A., Hatch, C.R., 2001. The effect of nitrogen fertilization, rock type, and habitat type on individual tree mortality. Forest Sci. 47(2), 203-213.
[37]
Stenberg, P., Kuuluvainen, T., Kellomaki, S., Grace, J.C., Jokela, E.J., Gholz, H.L., 1994. Crown structure, light interception and productivity of pine trees and stands. Ecol. Bull. 43, 20-34.
[38]
Tamm, C.O., 1995. Towards an understanding of the relations between tree nutrition, nutrient cycling and environment. Plant Soil 168-169, 21-27.
[39]
Tschieder, E.F., Fernández, M.E., Schlichter, T.M., Pinazo, M.A., Crechi, E.H., 2012. Influence of growth dominance and individual tree growth efficiency on Pinus taeda stand growth. A contribution to the debate about why stands productivity declines. For. Ecol. Manag. 277, 116-123.
[40]
Vitousek, P.M., Matson, P.A., 1985. Disturbance, nitrogen availability, and nitrogen losses in an intensively managed loblolly pine plantation. Ecology 66(4), 1360-1376.
Weiner, J., Wright, D.B., Castro, S., 1997. Symmetry of below-ground competition between Kochia scoparia individuals. Oikos 79, 85-91.
[43]
West, P.W., 2014. Calculation of a growth dominance statistic for forest stands. Forest Sci. 60(6), 1021-1023.
[44]
Wykoff, W.R., Crookston, N.L., Stage, A.R., 1982. User's guide to the Stand Prognosis Model. U.S. Department of Agriculture, Forest Service, Intermountain Forest and Range Experiment Station. General Technical Report INT-133. Ogden, UT.
Table
3.
Pre-treatment and eight years thereafter mean DBH (diameter at 1.37 m above the ground), its 95% confidence interval (in parentheses), and its coefficient of variation (CV) by fertilization treatment and vegetation series.
Table
4.
Observed mean percentages of total stand volume growth in each quartile of stand volume (with first and fourth quartiles being the smallest and largest trees, respectively) by fertilization treatment and vegetation series.
Table
5.
Mean changes in percentages of varying shade tolerance trees in volume and the ranges of 95% confidence intervals over the eight-year period by fertilization treatment and vegetation series.
Treatment
Western redcedar/Western hemlock
Grand fir
Douglas-fir
Tolerant (%)
Mid-tolerant (%)
Intolerant (%)
Tolerant (%)
Mid-tolerant (%)
Intolerant (%)
Tolerant (%)
Mid-tolerant (%)
Intolerant (%)
Control
‒0.7 ± 2.1a
3.3 ± 2.5
‒2.6 ± 0.7
0.9 ± 0.7
‒8.5 ± 1.2
7.6 ± 1.6
0.0 ± 0.0
‒3.3 ± 1.5
3.3 ± 1.5
N
‒1.2 ± 1.3a
2.9 ± 0.9
‒1.7 ± 1.1
2.3 ± 4.8a
‒9.8 ± 4.5
7.5 ± 3.1
0.0 ± 0.0
‒3.3 ± 1.2
3.3 ± 1.2
K
‒4.1 ± 2.2
4.7 ± 2.9
‒0.6 ± 2.1a
0.9 ± 0.8
‒9.6 ± 2.7
8.7 ± 2.9
0.0 ± 0.0
‒2.8 ± 3.1a
2.8 ± 3.1a
N + K
‒2.8 ± 1.0
3.4 ± 1.0
‒0.7 ± 0.6
1.4 ± 1.6a
‒8.4 ± 2.2
6.9 ± 2.1
0.0 ± 0.0
‒3.4 ± 1.7
3.3 ± 1.7
a Changes not significantly different from 0 at the 0.05 significance level.
Table
6.
Observed mean DBH (diameter at 1.37 m above the ground) and its 95% confidence interval (in parentheses) of living and dead trees by shade tolerance and vegetation series.

 DownLoad:


 Email Alerts
 RSS Feeds